




IntelliPaper
Abstract
In INDIA population is the root of many problems and is also directly linked with fuel consumption. And with increase in affordability index due to economic growth has led to higher aspiration amongst people (especially a need for increased comfort). With high numbers of vehicle on signals, waiting time increases which leads to a situation of heavy traffic congestion at traffic signals and intersections resulting in a very slow traffic movement even when the traffic lights switch green.
An idling vehicle is not only using up valuable fuel and damaging vehicle’s engine, but also causing danger to the environment and a risk to the health of many others. Fuel consumption at signalized intersections has increased, as the vehicles are unable to cross the intersection during one green phase of signal because of long queues at the intersection. Extra fuel loss is due to personal mode of transportation, enhanced trip length and congested intersections. Usually when the vehicles are waiting for their turn to cross the intersection at signals, drivers normally keep their vehicle’s engine on, resulting in extra consumption of fuel. This small amount of fuel wasted, if aggregated over number of cycles per day, for number of days per year and for number of signalized intersections results in a huge quantity of fuel. The wastage of fuel at these intersections results in a huge loss of valuable fuel resources. The paper presents the results of fuel loss at signalized intersections due to delay of vehicle.
Explore Digital Article Text
I. INTRODUCTION
In the last few years with the increase in population there has been a significant growth in vehicular traffic for travelling and carrying goods from one place to another. With increase in demand of mobility, more vehicles are owned and operated. Increase in no. of vehicles results in traffic and transportation problems in the form of increment in traffic congestion, air & noise pollution, accidents, delays and emission of greenhouse gases. The long queues of vehicles results in delay and during this interval vehicle is generally in idling condition, causes extra fuel consumption. Moreover within two decades, there is continuous increment in vehicle ownership and vehicle size preferences. The tracking of energy consumption in transportation over the years must consider both the changes in travel patterns and vehicle fleet characteristics. It is well known that the energy consumption in transportation has a very high proportion of a society's total energy consumption. Therefore, from the perspective of saving energy and reducing energy consumption, study of transportation system not only reduce the total energy consumption, but also has an important significance for the future sustainable development of transportation. Ever increasing vehicular flow causes heavy delays at intersections due to stoppage of vehicles during red phase resulting in wastage of fuel at intersections.
II. LITERATURE REVIEW
Parida and Gangopadhyay (2008) observed various intersections in Delhi to estimate the savings in fuel consumption during delays. And on the basis of the savings accrued at low, medium and high volume intersections, the savings at the total signalized intersections was estimated, assuming similar kind of remedial measures. They observed total 67.78% of saving in fuel consumption and expected 71.12% of saving in the economic loss due to extra fuel consumption. It was observed that 135.86 million kilogram CNG; 47.35 million litres diesel and 147.84 million litres petrol worth Rs. 9945 million is extra consumed during idling condition of vehicles at the signalized intersections in Delhi.
Shipchandler et al. (2008) estimated the total quantity of emissions of greenhouse gases produced in idling condition of vehicles in Chicago metropolitan area using reasonable assumptions. It was done by developing an emission factor and multiplying total number of vehicles and total idling time with this factor. It was observed that fuel consumed during idling of vehicles for heavy duty trucks was 1gallon/hr. and for passenger vehicles it was.5 gallon/hr.
Li et al. (2012) observed an advanced driving alert system that provides traffic signal status information to help drivers for avoiding hard braking at intersections and defines a method for evaluating fuel consumption & emissions at intersections. This study shows the savings on fuel consumption up to 8% and the reduction of emissions around 7% when traffic was in medium congestion.
Tiwari et al. (2013) also estimated fuel wastage due to idling of vehicles at road traffic signal in Indore Madhya Pradesh. The classified traffic volume study was conducted for 12 hours from 10:00 am to 10:00 pm at seven signalized intersection for complete week to estimate extra fuel consumption because of idling of vehicles. The study shows that about liters of petrol and diesel are being wasted.
Pal et al. (2012) evaluated the fuel consumption of vehicles at signalized intersections using precise instruments. Five red light traffic signals of different traffic volume had been considered and estimated the fuel loss during idling and delay of vehicles. An average fuel cost Rs.19, 175.00 was wasted per day due to delay at signalized intersections. It was also observed that 85% drivers did not switch off the engine of a vehicle at red light traffic signals that lead to extra fuel consumption. The results showed that the delay of vehicles at five red light traffic signals was greater than 60 seconds that lead to wastage of 389.68 litres of diesel and 810.38 litres of petrol. Total loss output work found were Rs. 61,072 per day and Rs. 2, 22, 91,198 per annum. The fuel consumption for petrol car was 573 ml/hr. and diesel car was 705 ml/hr.
Vlieger et al. (2000) effect of normal and aggressive driving on the tailpipe pollutants and fuel consumption of vehicles were studied. The fuel consumption was highest in city traffic conditions and in rural conditions. The exhaust tailpipe pollutants were increased by 8 times for aggressive driving as compared with normal driving behaviour. The fuel consumption was increased by 20-45% during intense traffic conditions.
Carrico et al. (2009) human activities and behaviour played a dominant role for increase in tailpipe pollutants and fuel consumption of vehicles. The survey was done on 1300 drivers in United States for calculation of vehicle exhaust pollutants and fuel consumption. An aggressive driving contributed more tailpipe pollutants and fuel consumption as compared with normal driving behaviour.
Lim (2012) studied exhaust emissions from idling Heavy-Duty Diesel Trucks and Commercially Available Idle-Reducing Devices. The emissions and fuel consumption data generated from this study shows that on an average, a class-8 truck could emit 144 gm./hr. of NO and 8224 gm./hr. of CO , and could consume about 0.82 gallon/hr. diesel and also shows that the use of idling reduction devices cuts the emissions and fuel consumption.
III. TYPES OF FUEL CONSUMPTION MODELS
(a) Instantaneous fuel consumption model: - This type of fuel consumption model requires second by second individual data comprising of speed acceleration, de-acceleration, vehicle engine speed, time and location along road section for every individual vehicle. It includes basic model and micro level model. Basic model is an engine type model which constitutes of vehicle design and engine torque as model parameters. Micro level model is a non-engine type model which includes second by second individual vehicle data.
(b) Delay type fuel consumption model: - In this type of model relationship is established between fuel consumption and commonly used traffic measures such as delay and stop. As delay is very effective and popular measure in traffic analysis work, so its use in fuel consumption model is advantageous.
(c) Speed type aggregate fuel consumption model:- In this type of model generally regression analysis is used to establish relationship between fuel consumption and various network wide variables such as travel time, average speed, travel distance and number of stops, as these type of model do not consider second by second speed change in estimation of fuel consumption. Moreover they are insensitive to small traffic condition changes.
IV. OBJECTIVES OF THE STUDY
This study deals with the twelve hours traffic composition of a normal day of an intersection of a city. Total traffic count of the duration is calculated and also the delay during the duration is obtained. Fuel consumption due to delay of vehicles is also estimated along with the monetary losses.
V. STUDY AREA
For the present work, the clock tower intersection of Saharanpur, a city of Uttar Pradesh in Northern India is chosen as the study area. Saharanpur is located at 29.97° N and 77.55° E. It is about 140 kilometres south- southeast of Chandigarh, 170 kilometres north-northeast of Delhi, 65 kilometres north-northeast of Shamli, and about 68 kilometres southwest of Dehradun. It is the main intersection of city for going to neighbouring states Uttrakhand, Haryana and Himachal Pradesh. It is the busiest intersection of city as railway station and bus stand are just at a distance of few minutes. Also Dehradun chowk and the court road intersection are among main intersections of city as they connect the city to the rest of the area. According to census 2011, city had around 7.5 lakh population.
Increase in Road Network (2013-17):24.12km.
Total Road Length in city: 1783.22 Km.
Vehicles Growth (new registration) 2016-17:43486 vehicles,
2017-18: 50178 vehicles,
2018-19: 60615 vehicles.
E-rickshaw & auto based transit system.
Bus Services for Inter & Intra transit: 18 Routes, 437 permit buses including private & government. Number of authorized parking lots increased (2014-17): 3 to 5;
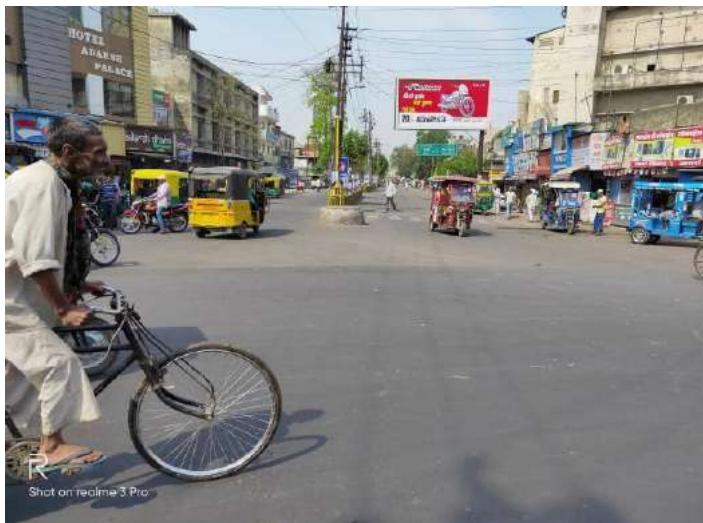 Fig. 1: West Approach of Clock Tower Intersection
Fuel Consumption at Signalized Intersection Due to Delay
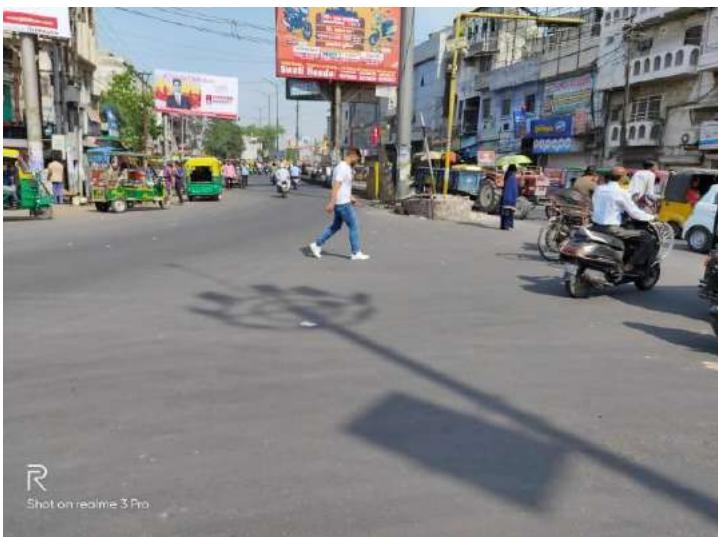 Fig. 2: Approach Towards East of Clock Tower Intersection
VI. DATA COLLECTION
Video graphic technique was used for collection of traffic data. A twelve hours video was collected from traffic police of the desired intersection of the normal day. In total a twelve hours video was collected i.e. from 7:00 am to 7:00 pm. The data collected was divided into lean hour, average hour and peak hour as observed on the basis of vehicular traffic count. Also manually observation of traffic data was done to know the lean average and peak hours of the intersection.
VII. DATA EXTRACTION
From the collected data, hourly traffic data was extracted very effectively and precisely. Data was extracted into various categories of vehicles such as two wheelers, three wheelers, bus, car, trucks and tractor trailers etc. The collected data was as follows as represented in the below tables. Table 1 represents the traffic data of the normal day of three main intersections..
From the extracted data, it was concluded that within this twelve hour study there were three lean hours, six average hours and three peak hours.
Table 1: Traffic volume of 3 intersections
| Intersection | Type of intersection | Traffic count | Duration of data |
| Dehradun chowk | 3 legged | 22754 | 12 hours |
| Court road | 3 legged | 28294 | 12 hours |
| Clock tower | 4 legged | 33260 | 12 hours |
traffic composition {"image_source":{"path":"images/2483f7a67a6b2de4bd26206f0ed9486716a43d0bf5edfb3ae2b4389a358dc526.jpg"},"content":"","chart_caption":[{"type":"text","content":"Figure 1: Traffic Composition of Clock Tower Intersection"}],"chart_footnote":[]}
VIII. CALCULATION OF DELAY
For calculation of delay Reilly's model is used. This model is the modified version of Akcelik's delay model. According to this model total delay is the combination of uniform delay and overflow delay. Now overflow delay is given as
OVERFLOW DELAY (OD) = 450[(X-1) + [(X-1) + √ {12(X-X )/cT}]
Where T is the analysis period in hours; X is volume to capacity ratio; c is the capacity in vehicles per hour; s is the saturation flow rate in vehicles per seconds green time; g is the effective green time in seconds For Overflow Delay, , if then overflow delay is zero.
Thus, total delay = uniform delay (UD) + overflow delay (OD).
In the present study the delay calculated is as follows:
Table 2: Calculated Delays
| Hours | Delay calculated(sec/veh) |
| Lean hours | 24 |
| Average hours | 38 |
| Peak hours | 90 |
Table 3: Total Delay Calculated (In Hours) for Different Vehicles
| Vehicles | Delay for different hours | Total | ||
| Lean hour | Average hours | Peak hours | ||
| Bikes | 25.49 | 130.43 | 164.95 | 320.87 |
| Autos | 3.64 | 20.58 | 33.45 | 57.37 |
| Cars | 5.39 | 28.90 | 43.10 | 77.39 |
| Buses | 0.349 | 3.8 | 5.17 | 9.32 |
| Trucks | 0.67 | 1.5 | 2.62 | 4.79 |
| Tractors | 0.54 | 1.65 | 2.12 | 4.31 |
IX. FUEL CONSUMPTION CALCULATION
Fuel consumption of vehicles is obtained using a CSIR-CRRI report of 2009 for fuel consumption of vehicles. The idling fuel consumption of vehicle is multiplied with the total delay of vehicle obtained in table 3. Table 4 gives different values for fuel consumption of different vehicles.
Table 4: Idling fuel consumption in ml/hr. (CSIR- CRRI 2009)
| Serial no. | Vehicle type | Fuel consumption (ml/hr.) | Fuel type |
| 1 | Maruti gypsy | 1045 | Petrol |
| 2 | Maruti van | 692 | Petrol |
| 3 | Lml motor cycle | 129 | Petrol |
| 4 | Bajaj pulsar | 166 | Petrol |
| 5 | Honda active | 118 | Petrol |
| 6 | Ambassador car | 952 | Diesel |
| 7 | Mahindra jeep | 1052 | Diesel |
| 8 | Hyundai santro | 563 | Petrol |
| 9 | Taxi | 1010 | Petrol |
| 10 | Tata sumo | 717 | Petrol |
| 11 | Tata indica | 547 | Diesel |
| 12 | Esteem | 740 | Petrol |
| 13 | LCV | 690 | Diesel |
| 14 | HCV | 1240 | Diesel |
| 15 | Bus | 3610 | Diesel |
| 16 | Auto rickshaw | 700 | CNG |
Table 5: Total Fuel Consumption of Different Vehicles
| Sr. No. | vehicle | Idling Fuel Consumption | Total delay | Total fuel consumption | Fuel type |
| 1 | Bikes | 150 ml/hr. | 320.87 | 48.13L/hr. | Petrol |
| 2 | Autos | 700ml/hr. | 57.37 | 40.11L/hr. | CNG |
| 3 | Cars | 900ml/hr. | 77.39 | 69.65L/hr. | Petrol |
| 4 | Buses | 3610ml/hr. | 9.32 | 33.64L/hr. | diesel |
| 5 | Trucks | 1240ml/hr. | 4.79 | 5.93L/hr. | diesel |
| 6 | Tractor trailer s | 690 | 4.31 | 2.97L/hr. | diesel |
Table 6: Total Cost of Extra Fuel Consumed
| Sr. no. | Fuel type | Fuel consumed(L) | Present rate Rs/l | Total amount(Rs.) |
| 1 | Petrol | 117.78 | 70.28 | 8227 |
| 2 | Diesel | 42.54 | 63.66 | 2708 |
| 3 | CNG | 40.11 | 51.95 | 2083 |
X. CONCLUSION
From this study it is concluded that a total of 117.78 litres of petrol is extra consumed Worthing of INR.8227, 63.67 litres diesel of INR.2708 and
40.11 litres CNG of INR.2083. Thus during this 12 hour study a total amount of 13018 INR is utilised on extra consumption of fuel. This study is limited to 12 hours and to one intersection only, if the same study to be carried out annually and on all intersection of city then a huge amount of fuel wasted can be carried out.
XI. REMEDIAL MEASURES:
As it is well versed that petroleum products are non-renewable resources and cannot be replenished in short span. Also petroleum products are a major source of carbon emissions largely responsible for environment deterioration, they must be sustainably utilised.
-
Switching off behaviour
-
Encouraging public transport
-
Encouraging non-motorised mode
-
Imparting traffic education
-
Removal and shifting of bus stand from centre of the city.
-
Strict measure to remove encroachment from roadside.
-
Route diversion of heavy vehicles.
Conflict of Interest
The authors declare no conflict of interest.
Ethical Approval
Not applicable
Data Availability
The datasets used in this study are openly available at [repository link] and the source code is available on GitHub at [GitHub link].
Funding
This work did not receive any external funding.
References
Cite this article
Related Research



Special Issue
Launch a focused special issue to highlight research, emerging trends, and expert insights in your academic field.
