



IntelliPaper
Abstract
Aeroponic systems have demonstrated their efficacy for seed potato production in greenhouses using sunlight or artificial light, achieving yields comparable or superior to traditional methods. However, the optimal light requirements, particularly with LED lights in aeroponic farming, remain understudied. This study aimed to determine the light compensation point (Ic) requiered for potato growth under LED lighting.
The light compensation point is the irradiance where photosynthesis equals respiration, varying by species and environment. Selecting an appropriate light intensity is crucial for crop productivity and cost-efficiency. Limited research exists on potato cultivation under LED lighting, especially concerning plant photosynthetic rates. This study evaluated the effects of LEDs on potato plants, focusing on CO2 exchange and biomass production.
Results indicated that blue light was the most efficient for CO2 absorption, with an Ic of ~50 µmol m⁻² s⁻¹, while red light required 67 µmol m⁻² s⁻¹. White and mixed lights exhibited higher Ic values (84.6 and 108.5 µmol m⁻² s⁻¹, respectively). Plants exposed to blue light developed robust structures but had lower biomass compared to those under red light treatments, underscoring the need for further optimization of LED spectra in aeroponic farming systems.
Explore Digital Article Text
I. INTRODUCTION
Artificial light source is a critical component in indoor farming since light quality and intensity are one of the most important environmental factors affecting plant growth and morphology (Rabara et al., 2017) but also to prevail economically within the limits of plant growth and cost reduction (Domurath et al., 2012). The light compensation point is the irradiance at which the photosynthetic activity of a plant is equal to its respiratory activity by exchange (Nobel, 2009), and it depends on species and growing environments (Taiz & Zeiger, 2002). So, it provides a basis for selecting light intensity suitable for developing a particular crop. Moreover, when we graph the Net Photosynthesis vs irradiance, the slope of the line at the light compensation point indicates quantum yield ( ), mol of fixed by mol of photons irradiated (Long & Hällgren, 1993). It is also necessary to consider that 9 mol photons are required to fix a mol of (Osborne & Geider, 1987). So, these measurements help better understand the effect of irradiance on crops.
As an artificial illumination source, Light-emitting Diodes (LEDs) are the most popular for vertical farming or urban agriculture since they can emit a specific wavelength or a combination of them, they have a variety of designs, low heat emission, energy efficiency as well as their long lifetime (Janda et al., 2015; Rabara et al., 2017).
Potatoes are a highly productive crop, and tubers constitute an excellent source of carbohydrates and proteins. Field farming is associated with several risks and uncertainties in vital and environmental stresses, such as high winds, floods, droughts, and pest attacks (Tunio et al., 2020), and also the poor efficiently in the use of natural resources such as soil producing degradation on it and water waste (Lakhiar et al., 2018). Aeroponic culture is a soilless method that offers an innovative solution to ensure the environmental and economic sustainability of food supplies with high nutritional quality, nontoxic food, and labor (Lakhiar et al., 2018).
The potato (Solanum tuberosum L) is, due to its nutritional and energy value, an essential and necessary food in the diet of Mexicans, and its cultivation has excellent economic and social importance for many Mexican families (NOM-041-FITO-2002, 2003). One of the main challenges for the producers of this tuber is the quality of the plant propagation material, since the seed degenerates due to pathogens and diseases in the planting material continued in the cycles of vegetative propagation, affecting yields and the quality of the crop. The in vitro production of potato seed is very convenient since the seedlings are manipulated more easily to eradicate any pathogen present in the tissue (Tapia y Figueroa et al., n.d..). The pre-basic seed is obtained from in vitro plants that originate from the culture of meristems, and these can be used directly for the production of mini tubers (ex vitro) or the formation of microtubers (in vitro) (NOM-041-FITO-2002, 2003; Tapia y Figueroa et al., n.d..).
Potatoes are traditionally grown under open-field conditions, and fewer studies have been conducted on cultivation in a controlled environment illuminated with LEDs. The related lack of information in the literature excludes the benefits of LED or dichromatic light on potato plants or, particularly, the photosynthetic influence on tuberization.
Our research aimed to experimentally determine the minimum light necessary for growth in this culture. We tested photosynthetic rates in aeroponic potato culture under industry-relevant light intensities and various light qualities, measuring leaf gas exchange. These experiments allowed us to determine the light compensation points (LCP) under different conditions, thereby proposing a suitable light intensity for growing Solanum Tuberosum L. aeroponic plantlets.
II. MATERIALS AND METHODS
2.1 Plant material, growth chamber, environmental conditions, and experimental design
Potato (Solanum tuberosum L.) variety Fianna plants in vitro were donated by the Plant Biotechnology Laboratory of the Instituto Tecnológico de Tlajomulco and transplanted in vivo in an aeroponic chamber divided into four zones. Each zone was isolated from any external light source and was illuminated for 10 days with white LED light by Philips HUE multicolor smart bulbs. After transplantation, 10 plants were allocated to each of the four light treatments and kept for the 8-week experimental period, Figure 1. The environmental conditions inside the growth chamber were set to a 12/12 h photoperiod. The energy provided by the LEDs in the chamber was fixed at , which means an irradiance of 61, 42, 51 and 48 \, \mum mol m^{-2} s^{-1} for the colors red, blue, 50% blue:50% red (mix) and white (33% blue, 32% green. 8% yellow, 15% orange and 12% red) respectively, measured with the limited by the technology of the HUE lamps for the blue light. Planck-Einstein's equation (6) was used to convert from PPFF to energy.
The Planck-Einstein equation relates the energy of a photon to its wavelength. It is expressed as:
Where:
E is the energy of the photon (in joules).
h is Planck's constant, approximately
c is the speed of light in a vacuum, approximately
is the wavelength of the photon (in meters).
Relative humidity , and temperature of . Water spray irrigation was one minute every two hours. The plant nutrient solution was made with (meq/L) 10.5 of N, 11.6 of P, 9 of K, 6.1 of Ca, 1.1 of Mg, and 0.5 of S.
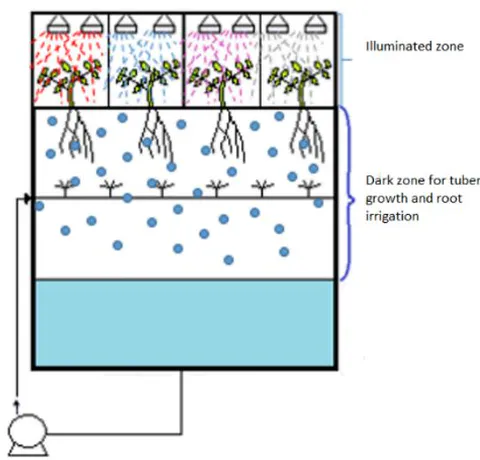
The experiment was performed twice for a randomized design of growth conditions.
2.2 Net photosynthetic rate determination
To determine the net photosynthesis, Pn, as the measurements were made at 100 minutes of illumination, the , not the total Pn for the plant. The equation proposed by Long & Hallgreen (1993) for closed systems was used:
Where:
Pn = Net photosynthetic rate ( mol m s )
C = molar fraction inside the cabin ( )
P = atmospheric pressure
S = leaf surface (m2) t = time (h)
The Light Compensation Point, LCP, is obtained from the graph Pn vs irradiance for each treatment; more specifically, it is the point cross with the x axis. The slope at this point is called an apparent quantum yield, , and it indicates the amount of fixed by mol of photons incident and not absorbed (Long & Hällgren, 1993).
2.3 Phenological monitoring
At the end of the treatment, each plant was measured to determine shoot length, shoot diameter, number of leaves, and root length. Plant tissue samples were dried in an oven for 48 h at 90°C before being weighed.
2.4 Statistical Analyses
Statistical analyses were carried out using the InfoStat Professional v.1.1 program. All the parameters were subjected to variance (analysis ANOVA) and a t-test. Differences were accepted as statistically significant when P < 0.05. Tuckey's test was carried out to identify significance among the samples.
III. RESULTS AND DISCUSSION
3.1 Absorption at Different Light Intensities
Figure 5 presents the absorption by the plants in the cabinet. The first 100 minutes correspond to measurements in the dark. The dotted lines indicate the boundary between dark and illuminated conditions. Overall, the results show that the higher the illumination, the higher the absorption.
Under 10 PPFD, all treatments maintained a slope similar to mitochondrial respiration. We can see that even when photosynthesis has started, this light intensity is insufficient to disrupt the balance between the absorbed via photosynthesis and the produced by mitochondrial respiration. When exposed to 50 PPFD, only plants under blue light reached equilibrium ( absorbed = produced). Plants treated with white and mixed lights reached this equilibrium at approximately 100 PPFD. Meanwhile, plants under red light required 100 PPFD to generate a positive balance. Blue light proved the most efficient in facilitating absorption, while red light was the least efficient.
{"image_source":{"path":"images/e216ece7600ea8736723231a6a9a5b9ce124e775233424f1659f82d0d88ee1bb.jpg"},"content":"","chart_caption":[],"chart_footnote":[]} {"image_source":{"path":"images/8c8c27ddf8b3a112c950c0ce54347b5a60ff005f5ee97b8918b81bdfb8c2439f.jpg"},"content":"","chart_caption":[],"chart_footnote":[]}
{"image_source":{"path":"images/e73c258e4b0bd2c96cded530643bddef03e327d4ddda1e7039b9cab9dd77ed0b.jpg"},"content":"","chart_caption":[],"chart_footnote":[]} {"image_source":{"path":"images/7d022cf6bccbb7d32c44ef374befb2d012d4839f8053f241c8c615c27f3b9070.jpg"},"content":"","chart_caption":[{"type":"text","content":"Figure 5: "},{"type":"equation_inline","content":"{2}"},{"type":"text","content":" absorption at different light intensity. "},{"type":"equation_inline","content":"{2}"},{"type":"text","content":" absorption vs time measured under a) white LED, b) blue LED, c) mix LED, and d) red LED. The blue line shows the "},{"type":"equation_inline","content":""},{"type":"text","content":" absorption by the plant to"}],"chart_footnote":[]}
10 PPFF, the green line to 30 PPFF to range line is the answer of the plant to illumination of 50 PPFF, gray line is the answer to 100 PPFF and yellow line to 200 PPFF. The vertical dotted lines indicate the beginning of the illumination.
3.2 Light Compensation Point and Quantum Yield
Figure 6 illustrates the relationship between net photosynthesis (Pn100) and light intensity for each treatment. Table 4 summarizes the light compensation point (LCP) and quantum yield ( ) calculated from these data. Blue light treatments achieved the lowest LCP ( ), significantly lower than white (84.6 ), mixed (108.5 ), and red light (67 ) treatments. Therefore, this suggests that blue light promotes higher photosynthetic efficiency under low light conditions, consistent with findings that highlight the role of blue spectra in enhancing uptake and stomatal conductance (Li et al., 2017; Paradiso et al., 2019). The quantum yield was highest for white light ( ), followed by mixed, red, and blue lights. In contrast, plants under blue light operated near their LCP, which limited the calculation of a reliable quantum yield equation.
{"image_source":{"path":"images/a282f83042b31b0fe692f8b0bff53b1043a9f21530da45b001c32f142e37cabc.jpg"},"content":"","chart_caption":[{"type":"text","content":"a)"}],"chart_footnote":[]} {"image_source":{"path":"images/b4b45822d68deee7feed7a360c49a7f884c3ec0af2f693fd9ea6a787bd8d57b7.jpg"},"content":"","chart_caption":[{"type":"text","content":"b)"},{"type":"text","content":"Figure 6: a) "},{"type":"equation_inline","content":"Pn_{100}"},{"type":"text","content":" vs irradiance until "},{"type":"equation_inline","content":"100 \mu mol m^{-2} s^{-1}"},{"type":"text","content":", b) "},{"type":"equation_inline","content":"Pn_{100}"},{"type":"text","content":" vs irradiance until "},{"type":"equation_inline","content":"200 \mu mol m^{-2} s^{-1}"},{"type":"text","content":", showing the extrapolation lines and their equations at the LCP."}],"chart_footnote":[]}
The light compensation point is mainly related to respiration and the light source used for the treatments (Azcón & Osmond, 1983). Due to the characteristics of this experiment, where dark respiration was established at 800 ppm, there are no other differences between the experiments, and calculated LCP was affected only by light source. Plants were grown in a light level close to the blue and red light compensation point. In this way, these plants grow and pass through the vegetative stage. Increasing the PPFD of light above the compensation point with these treatments is necessary to understand the light effect on biomass and the tuberisation process.
The light compensation point (LCP) (Table 4, Figure 5) was achieved at the lowest photon flux density with blue light (50 mol m s ), making it the most efficient for photosynthesis. Red, mix, and white light required higher fluxes (67, 84.6, and 108.5 mol m s , respectively). The high efficiency of blue light correlates with its ability to increase stomatal conductance and net photosynthesis (Li et al., 2017). However, white light's quantum yield ( ) was the highest among treatments, indicating its potential for efficient energy use once plants grow above the LCP. These results support further testing of white light under optimized conditions.
| LED light treatment | Eq. Pn vs PPFF | LCP (μmol m-2s-1) | Φ (μmol CO2/ μmol photon) |
| White | y= 0.1543x - 13.045R2= 0.997 | 84.6 | 0.1543 |
| Blue | ---- | ~50 | --- |
| Mix | y= 0.051x - 5.54R2= 0.9948 | 108.5 | 0.051 |
| Red | y= 0.029x - 1.94R2=0.9986 | 67 | 0.029 |
3.3 Dry Biomass
The results in Figure 7 show that at three weeks, all plants developed longer roots than stems. At this stage, plants grown under red light displayed the longest roots, whereas those under mixed light had the shortest roots. In some studies made with in vitro plantlets, monochromatic red and far-red findings were stem elongation and leaf thinning in those seedlings producing fragile plants (Chen et al., 2020; Miyashita et al., 1995). This researcher found that blue light caused leaf expansion and increased leaf thickness (Chen et al., 2020) and hurt the growth of potato seedlings, but the plants were more robust and had broader leaves (Miyashita et al., 1995).. In our experiments, the same growth tendencies were observed in plants at three weeks of transplanting, However, at the end of eight weeks, these differences disappeared as observed in Figure 7b, mainly taining only the thickness in stem and fragility for plants under red light treatment, which also showed the thinniest leaves. However, to compensate, plants increased the amount of leaf biomass, translating to a more significant number of leaves per plant.
Blue light produced the shortest roots at both time points, significantly smaller than other treatments.
{"image_source":{"path":"images/38f7fac21373872ba0f73753bf6580c8e876efb93ec24ef19b3810ca61a73087.jpg"},"content":"","chart_caption":[{"type":"text","content":"a)"}],"chart_footnote":[]} {"image_source":{"path":"images/33281e59435c814065d5c6d4632de3df3fb302ed1441230ceadf9d79d9f94c3e.jpg"},"content":"","chart_caption":[{"type":"text","content":"b)"},{"type":"text","content":"Figure 7: Physiological growth at week 4 (a) and eight weeks (b) after transplanting. The left axis refers to the length in mm for stems and roots. The right axis is referred steam diameter. Data are presented as means ± standard error (n = 4). Different letters indicate significant differences between values (p < 0.05)."}],"chart_footnote":[]}
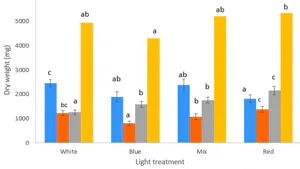
{"image_source":{"path":"images/2730483f180d184de1524cd748e50c40637e20cf60440ad48ec7579514219ad3.jpg"},"content":"","chart_caption":[{"type":"text","content":"Figure 8: Dry weight of three plants after 8 weeks of light treatment at "},{"type":"equation_inline","content":"10.65 \, J m^{-2} s^{-1}"},{"type":"text","content":". Data are presented as means ± standard error (n = 4). Different letters indicate significant differences between values (p < 0.05)."}],"chart_footnote":[]}
IV. CONCLUSIONS
Solanum tuberosum L. plants derived from in vitro culture successfully grew in our aeroponic chamber illuminated with LED lights in blue, red, mixed (50:50 red and blue), and white spectrums over eight weeks. The findings highlight significant differences in the physiological responses of plants to varying light qualities and intensities. Blue light most efficiently achieved equilibrium at the lowest light compensation point ( ), promoting robust plant structures. Red light, although less efficient, produced the highest foliar biomass. The mix and white light treatments required higher irradiance levels to reach the compensation point, yet they balanced structural development and biomass production.
These results indicate white and mixed light spectrums as promising candidates for further studies, particularly under conditions above their respective light compensation points. However, this study did not progress to the tuberization stage, a critical phase to validate the suitability of these light treatments for mini-tuber production. Future experiments should evaluate these light spectrums under various intensities above the compensation point to determine the optimum light conditions for maximizing tuber yield and quality. Based on these findings, we recommend using white light for future experiments due to its high and mixed light for balancing energy use and biomass output. Further research should explore the impact of light intensities above the LCP to optimize growth and tuberization.
Conflict of Interest
The authors declare no conflict of interest.
Ethical Approval
Not applicable
Data Availability
The datasets used in this study are openly available at [repository link] and the source code is available on GitHub at [GitHub link].
Funding
This work did not receive any external funding.
References
Cite this article
Related Research

Special Issue
Launch a focused special issue to highlight research, emerging trends, and expert insights in your academic field.

