


IntelliPaper
Abstract
The research “Measuring the Costs of Faculty Turnover and Teacher Absenteeism and Their Implications for the Performance of Higher Education Institutions” aims to demonstrate the costs arising from turnover at the Faculty of Economics, University 11 de Novembro (FEUON). This study is relevant for institutional management as it allows the identification of dysfunctions that undermine organisational efficiency and financial sustainability. It is a descriptive–exploratory study with a qualitative approach, conducted through field research. Data collection was carried out using semi-structured interviews applied to the heads of the Human Resources, Financial, and Scientific departments, as well as to the teaching and research units, including both active and former faculty members. The information was analysed using statistical techniques that enabled the explanation of the cause–effect relationship between faculty turnover and absenteeism and the costs incurred by the institution. The findings revealed hidden costs amounting to AOA 6,501,607.20, most of which were intangible and identified through the application of the SOF Method. It was observed that faculty turnover not only increases the visible cost structure but also results in productivity loss, disruption of the teaching–learning process, and organisational demotivation, thereby compromising academic quality and institutional performance. The analysis, grounded in socio-economic and behavioural theory, demonstrates that the absence of effective policies for the retention and appreciation of human capital raises hidden costs, undermining the competitiveness and sustainability of FEUON in the medium and long term.
Explore Digital Article Text
I. INTRODUCTION
Staff turnover in modern management has posed significant challenges to institutions, as the diverse ways of performing tasks provide workers with multiple employment alternatives. Consequently, institutions face increasing difficulties in maintaining structures aligned with their workforce, resulting in high turnover rates (Locateli, Lima, Domenico, Andreoli & Tissot, 2023), which in turn generate both visible and hidden costs.
In the current context, the concern of Angolan companies and higher education institutions, particularly those based in Cabinda, should not be restricted solely to the accounting of financial transactions. Instead, attention must be directed towards identifying the origins of costs—such as those associated with turnover—and recording them in order to provide management with necessary, sufficient, and comprehensive information for analysing their cost structure (Deco, 2023).
High turnover rates generate not only economic but also social costs, which may fail to yield returns for institutions, including higher education institutions, directly affecting their strategies and policies, and specifically their economic and social outcomes. This requires economic agents, such as higher education institutions, to bear the costs of dismissals, for example, severance payments, as well as expenses related to new recruitment, such as interviews, advertisements, and fees for specialised recruitment professionals.
Turnover, understood as the inflow and outflow of personnel within an institution, tends to generate costs that are not always readily identifiable, demanding that organisations adopt effective strategies for recognising and mitigating these impacts. Thus, people management becomes more assertive, whether in cases of resignation initiated by employees or by the employer, contributing to the institution's competitiveness in the market. Within this context, the present study seeks to demonstrate how faculty turnover affects the cost structure of the Faculty of Economics, revealing significant implications for both organisational performance and institutional sustainability.
II. PROBLEM STATEMENT
The core problem of this study lies in the fact that, in increasingly competitive institutional environments, the absence of effective policies for faculty management and retention has led to high turnover rates at the Faculty of Economics, University 11 de Novembre (FEUON). This phenomenon, in addition to undermining the stability of the teaching staff, generates significant hidden costs that are not recorded by traditional accounting practices. Such costs affect not only the financial structure but also the social and academic outcomes of the institution, thereby compromising both teaching quality and management sustainability. In this regard, it becomes essential to understand the extent to which turnover and absenteeism impact institutional costs and how their accurate measurement can contribute to more effective strategies for valuing and retaining human capital, with the ultimate goal of maximising the institution's performance.
III. THEORETICAL FRAMEWORK
3.1. Behavioural Theory
The Behavioural Theory, initially developed by Gilad and Kaish (1984) and later refined by Katona and Sent (2004), seeks to understand how workers respond to institutional structures. From this perspective, human performance results not only from economic rationality but also from emotional and motivational factors such as satisfaction and recognition (Lima, Almeida & Solva, 2023; Deco, 2023). The application of this approach makes it possible to explain organisational dysfunctions that affect productivity, since workers' decisions and attitudes reflect the direct interaction between structure and behaviour. In this context, faculty turnover is interpreted as a phenomenon arising from this relationship, which is why Behavioural Theory constitutes the analytical foundation adopted in the present study.
3.2. People Management
The human element is fundamental within a healthy organisation, and according to Xavier (2006, p. 23), the foundation for effective people management is:
- Believing in human beings and their potential;
- Encouraging subordinates to give their best and achieve higher performance standards;
- Taking pleasure in helping people develop and achieve increasingly challenging goals;
Assuming a leadership role and the responsibility that comes with it.
It can be stated that investing in people management may help to prevent several negative phenomena within organisations, such as turnover and absenteeism. In this context, and according to Cardozo (2005, p. 9), people are indispensable resources for the growth and development of organisations.
3.3. Concept of Turnover
Turnover is an English term that defines the movement of employees entering and leaving an organisation (Silveira, 2011). Marras (2011, p. 50) defines turnover as the number of employees leaving the company during a given period in comparison with the average workforce.
Turnover refers to the departure of employees from a company and their subsequent replacement (Pinheiro & Souza, 2013). It describes the flow of people entering and leaving an organisation, that is, new entries to compensate for employee departures. Almost every termination corresponds to the hiring of a replacement (Chiavenato, 2014).
According to Savall and Zardet (2019), within the framework of socio-economic theory, turnover has a hidden dimension, as it represents the investment made in human resources that leave the organisation. This includes the costs of recruitment, training, disruptions in operations, as well as the investments made in their replacements.
3.3.1. Types of Turnover (Separation)
There are two types of separations: those initiated by the employee and those initiated by the organisation.
Employee-initiated separation: occurs when the employee decides, for personal or professional reasons, to terminate the employment relationship with the employer. The decision to resign depends on two main perceptions: the employee's level of dissatisfaction with the job and the level of attractive alternatives available outside the organisation.
Organisation-initiated separation (dismissal): occurs when the organisation decides to terminate the employee's contract.
3.3.2. Turnover Rate
According to Chiavenato (2014), given the recurrence of employee separations within an organisation, it is necessary to measure the level of turnover. The turnover rate measures the proportion of separations in relation to the size of the workforce. This formula considers only departures and does not account for new hires within the organisation. Algebraically, it is expressed as follows:
Turnover Rate (TR)
Source: Chiavenato, 2014, p.83.
The turnover rate is defined by several authors. Pinheiro and Souza (2013), as cited by Pontes (1996), state that an appropriate turnover rate may be close to or below per year, which corresponds to slightly less than per month.
3.3.3. Consequences of Turnover
One of the main consequences generated by turnover is cost. The departure of an employee, their replacement, and the training of the new employee generate both financial and economic costs for the organisation (Eckert, Mecca & Giacomet, 2011).
Human Resources (HR) costs related to hiring begin as soon as the organisation starts searching for a candidate in the labour market. During recruitment, the company must seek candidates externally, often through advertisements in newspapers, on the radio, and other channels. From the moment an advertisement is placed, costs associated with the hiring process begin to occur. Once candidates are recruited, additional expenses arise, such as the time invested by HR professionals in conducting interviews, psychological testing, and the office materials consumed during the process. These represent some of the "hidden" costs for the purposes of cost analysis. After a candidate has been selected, they must undergo a medical examination, which is also financed by the organisation (Eckert et al., 2011).
3.3.4. Turnover Costs
The costs generated by employee turnover are significantly high for organisations, as they include expenses related to recruitment and selection, exit interviews, hiring, and severance payments (Locateli et al., 2023).
According to the authors, the cost of turnover for a dismissed employee corresponds to the cost of hiring their replacement, or vice versa. In this sense, institutions may calculate dismissal costs by considering the expenses incurred in the admission of a substitute.
Employee replacement requires time and can generate considerable expenses for organisations. These costs encompass not only the employee's dismissal but also the recruitment and training of their replacement (Santos, M. & Santos, R., 2022).
In general, turnover costs are divided into three groups: training, replacement, and termination of the departing employee (Bohlander & Snell, 2009). Similarly, Chiavenato (2009) asserts that turnover costs can be categorised into three groups: primary (quantifiable) costs directly related to separations and hirings; secondary (qualitative) costs, which are difficult to measure; and tertiary (estimable) costs, which refer to the medium- and long-term effects of turnover.
According to Locateli et al. (2023), turnover costs include recruitment, selection, exit interviews, hiring, and severance payments. Additionally, Santos, M. and Santos, R. (2023) argue that these costs also encompass the expense associated with the departing employee, training of the replacement, productivity loss, reduced service quality, among others.
Based on the authors' perspectives, turnover costs can be structured as follows:
- Direct turnover costs = Recruitment and selection costs + Training costs + Severance costs
- Indirect turnover costs = Productivity loss + Decline in service quality + Other indirect costs
The sum of direct and indirect costs can be referred to as the average cost. Thus:
Formula 1: Turnover Cost (TC)
TC=Average cost per employee× Number of employees separated
3.4. Concept of Absenteeism and Its Classification
From the perspective of Chiavenato (2014), absenteeism is understood as the "absence from work due to absences, delays, or medical leave, which negatively impact organisational productivity."
It is a management indicator that reflects the number of absences occurring within a given period (Marras, 2011).
Absenteeism can be classified into different categories: justified absenteeism, unjustified absenteeism, voluntary absenteeism, involuntary absenteeism, and presenteeism (Chiavenato, 2004; Marras, 2011).
From a socio-economic perspective, according to Deco (2023), the cost elements of absenteeism may be classified as follows: time spent by supervisors, downtime in production, time spent by workers in reallocating tasks, non-production, occasional quality defects, additional wage costs (overtime, additional staff), and reduced productivity of substitute workers.
Absenteeism Rate
3.5. Socioeconomic Theory
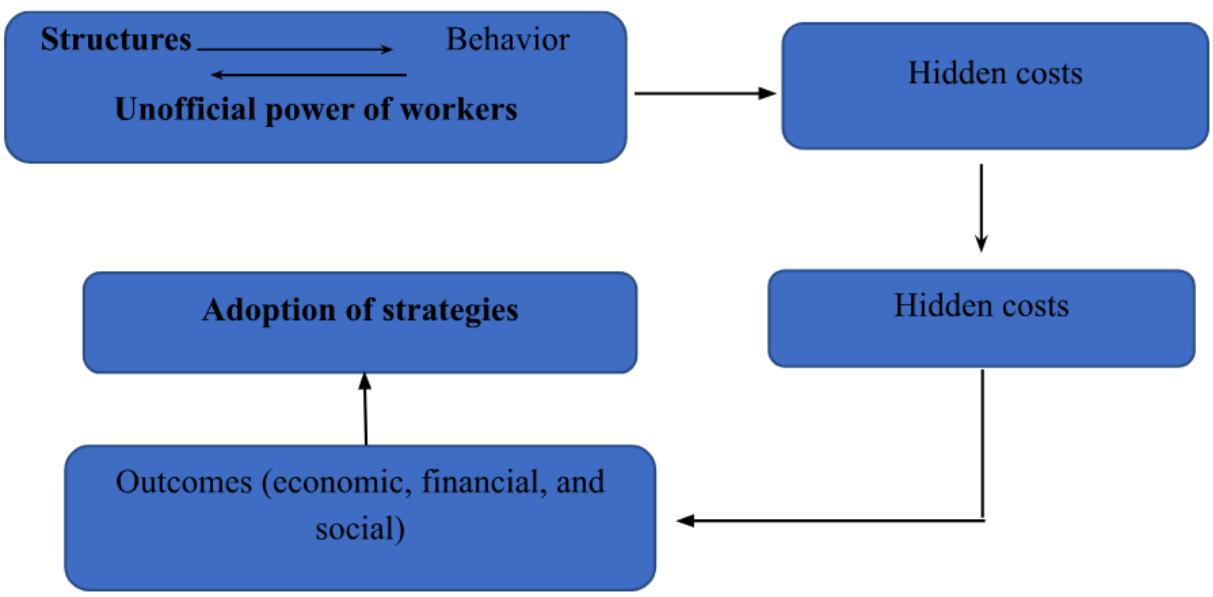
The socioeconomic theory, developed by Savall in the early 1970s, emerged as a complement to Cost Accounting, overcoming its limitations in the identification of hidden costs. It is based on the idea that the organization is a system composed of structures and people who, within the informal sphere, constantly react to the structures at their disposal, often displaying negative behaviour that generates dysfunctions. These dysfunctions are expressed as hidden costs, framed in the indicators of absenteeism, work accidents, staff turnover, deviations in direct productivity, and quality defects (Savall & Zardet, 2006; Deco, 2023). From this perspective, human capital is regarded as a strategic resource, and its devaluation leads to outcomes below expectations (Trejo et al., 2010; Napoleão, 2023). The theory thus enables the measurement and mitigation of these costs, offering institutions a more realistic framework of their economic and social structure, which is essential for ensuring sustainability and organizational effectiveness.
For this purpose, the socioeconomic methodology is structured into four stages: diagnosis, project, implementation, and evaluation, aimed at identifying, measuring, and assessing the dysfunctions that cause hidden costs in organizations.
Functional Diagnosis: consists of identifying and quantifying the dysfunctions that generate hidden costs, such as absenteeism, turnover, and productivity deviations, through interviews, observation, and document analysis (Souza et al., 2013).
- Project: in this phase, the suggestions collected are organized into improvement projects, assessed in terms of their economic and social impact (Savall & Zardet, 2006).
- Implementation of Proposed Actions: carried out in a monitored and controlled manner, ensuring alignment with institutional objectives.
- Evaluation: compares the results achieved with the socioeconomic indicators defined, allowing the measurement of performance gains or losses (Button et al., 2015).
For the evaluation of hidden costs, according to Savall and Zardet (2020), the socioeconomic theory uses two methods:
a) SOF Method: through the description and application of the social, organizational, and financial modules, it analyses absenteeism, work accidents, staff turnover, quality defects, and deviations in direct productivity across the three modules.
b) Structural Cost Contribution Method (MCCE): converts into monetary values the time lost due to dysfunctions, based on the hourly contribution margin over variable costs.
This approach enables institutions to measure hidden costs and, consequently, adopt more effective strategies for their mitigation.

Source: Adaptation with reference to DECO (2023)
Figure 3: Socioeconomic Theory
IV. METHODOLOGY
The research has a historical, comparative, exploratory-descriptive, and explanatory character, with a predominantly qualitative approach. The comparative character was manifested in the analysis of the causes of turnover resulting from the attitude of workers toward the structures made available to them, including working conditions. The exploratory-descriptive character stemmed from the practical investigation of the phenomenon under study, "faculty turnover and absenteeism," as well as from the description of the higher education institution. The explanatory character was present insofar as the research sought to understand the factors that give rise to faculty turnover and its consequences in terms of hidden costs in institutional performance.
In order to address the research problem and the hypotheses raised, a field study was conducted, which, according to Marconi and Lakatos (2005), consists of seeking answers to a hypothesis to be tested with the aim of acquiring knowledge about a problem.
For data collection, a semi-structured interview of approximately 30 minutes was conducted with those responsible for the Human Resources section, the financial area, the scientific area, the teaching and research departments, as well as with active and dismissed (terminated) faculty members of the institution. The research was carried out at the Faculty of Economics of the 11 de Novembre University between 2018 and 2023.
The institution is predominantly staffed by faculty members with a Master's degree, who represent of the total number of active faculty members. The remainder is composed of PhD faculty and Bachelor's degree holders of the total academic staff.
V. RESULTS
The results presented were drawn from interviews conducted with those responsible for the Human Resources section, the financial area, the scientific area, the teaching and research departments, as well as with active and dismissed (terminated) faculty members.
The purpose of the interviews was to understand working and operating conditions in order to identify possible dysfunctions, determine the reasons for hiring and dismissal (termination), and assess the associated costs. The data collected include: number of faculty members (permanent and contracted), faculty admitted and dismissed during the analysis period (2018-2023), and the total annual cost of academic staff. The main objective was to determine the turnover rate, identify dysfunctions for the calculation of hidden costs resulting from turnover, and, therefore, assess its influence on the institution's personnel cost structure as well as on its social outcomes.
For the monetary values presented in Akz, the following exchange rate was considered: 1 USD = 917 Akz.
5.1. Data Collection
Through the interviews conducted with the various departments of the institution, as described in the methodology, as well as with the faculty members (hired and dismissed), it was possible to obtain the following data:
- The names and years of admission and dismissal of hired and dismissed faculty;
Means of admission (public tender or direct hiring); - Courses and subjects taught;
- Working conditions (number of subjects per faculty member, classrooms and their respective conditions, and workload);
- Reasons for hiring and dismissal;
Faculty remuneration by category;
Annual personnel costs for academic staff.
The data in Table 1 refer to the behaviour of the number of faculty members and turnover over the years.
Table 1: Number of Faculty Members by Employment Status (2018-2023)
| Faculty | Fiscal Years | |||||||||||
| 2018 | 2019 | 2020 | 2021 | 2022 | 2023 | |||||||
| FA | FR | FA | FR | FA | FR | FA | FR | FA | FR | FA | FR | |
| Permanent | 34 | 83% | 37 | 76% | 43 | 90% | 38 | 88% | 44 | 86% | 44 | 80% |
| Contracted | 7 | 17% | 12 | 24% | 5 | 10% | 5 | 12% | 7 | 14% | 11 | 20% |
| Total | 41 | 100% | 49 | 100% | 48 | 100% | 43 | 100% | 51 | 100% | 55 | 100% |
Source: Research Data (2025)
Table 1 provides concrete information regarding the variation in the number of faculty members. It can also be observed from the table that there are two methods of faculty admission: public competition and direct hiring, with the majority of faculty members each year being permanent staff.
In 2018, the Faculty of Economics recorded the highest number of contracted faculty members, representing approximately of the total faculty at that time.
The year 2023 was the period in which the institution recorded the highest number of permanent faculty members, representing of the total faculty in permanent positions.
Figure 1: Faculty Members from Fiscal Years 2018 to 2023
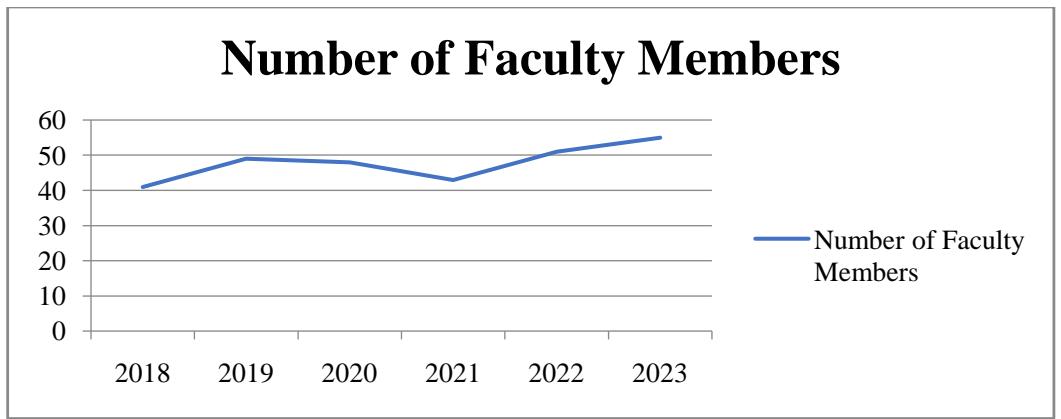
Source: Research Data (2025)
Figure 1 shows the variation in faculty turnover, highlighting that the institution experienced an increase in the number of faculty members between 2018 and 2020. This growth was associated with the rise in student admissions during that period, the consequent expansion of the institution's physical infrastructure, and the increase in the number of classrooms. Furthermore, the occasional departure of faculty members required new hires to ensure the continuity of teaching activities and maintain the quality of education.
Table 2: Number of Faculty Members Admitted (Permanent and Contracted)
| Contract Type | Fiscal Years | Total | |||||
| 2018 | 2019 | 2020 | 2021 | 2022 | 2023 | ||
| Permanent | 1 | 7 | - | - | 6 | - | 14 |
| Contracted | 7 | 12 | 5 | 5 | 7 | 11 | 47 |
| Total | 8 | 19 | 5 | 5 | 13 | 11 | 61 |
Source: Research Data (2025)
The graph presents the number of faculty members admitted during the period from 2018 to 2023 and the respective admission methods. As can be observed, the institution relied more heavily on direct hiring to fill vacancies. This may be due to the timeframe established by the Ministry of Higher Education, Science, and Technology (MESCT) for faculty admissions in this education sector. According to the data, during the six-year period under analysis, the Faculty, through MESCT, admitted faculty members three times, averaging about twice per year, and the number of admissions via public competition was relatively low compared to direct hiring.
Table 3: Motivations of Faculty Members Admitted to Higher Education
| Motivation | Description |
| Unique Opportunity | - The market did not offer other alternatives; - Decision driven by it being the only option at the time. |
| Fulfillment of a Dream | - A pre-existing and long-awaited passion. |
| Contribution to Science | - Willingness to contribute and advance science at FEUON; - Produce articles, books, and other scientific outputs, including extensions; - Share acquired scientific knowledge with students. |
| Salary and Other Benefits | - Obtain a dignified source of income; - Opportunity to build networks and gain social benefits (reputation, health plan including family, access to daycare, etc.), easier access to credit, and support and leave for training. |
| Other | - Desire for career development in Higher Education. |
Source: Research Data (2025)
Through interviews with faculty members, it was possible to determine the motivations of those who joined the Higher Education teaching staff. From the table, it can be observed that motivations vary from faculty member to faculty member; however, in general, they revolve around reasons of opportunity, the pursuit of fulfilling a personal dream, and the desire to contribute to the advancement of science within the Faculty of Economics.
Table 4: Number of Faculty Members Dismissed
| Dismissal Type | Fiscal Years (Academic Year) | Total | |||||
| 2018 | 2019 | 2020 | 2021 | 2022 | 2023 | ||
| Voluntary (Faculty-Initiated) | 2 | 3 | 4 | 2 | 3 | 6 | 19 |
| Involuntary (Institution-Initiated) | 1 | - | - | - | - | - | 1 |
| Contract Expiration | - | - | - | - | - | - | - |
| Total | 3 | 3 | 4 | 2 | 3 | 6 | 20 |
Source: Research Data (2025)
Table 4 presents the trends in faculty member dismissals and their types. Of the three types of dismissals outlined in the interviews and as reported in the literature, the institution predominantly records dismissals initiated by faculty members, with the lowest number observed in 2021, when only two faculty members resigned.
Table 5: Reasons for Faculty Member Turnover and Absenteeism
| Motivation | Description |
| Emergence of a New Opportunity | - The market offers differentiated opportunities with more advantageous proposals. |
| Working Conditions | - Air conditioning and climate control; workload incompatible with remuneration; faculty room conditions below expectations; lack of dedicated research rooms; absence of faculty journals for publication; classrooms without projectors; computer labs with few functional computers, among others. |
| Dissatisfaction with Salary and Benefits | - Remuneration does not yet provide the expected purchasing power; - Lack of medical assistance benefits, salary advances, or specific and continuous programs for ongoing training; - Lack of bonuses or incentives for achieving targets or scientific production. |
| Institutional Policies | - Absence of talent retention policies; - No faculty housing programs; - Lack of Human Resource Management (HRM) policies that enhance the prestige of the teaching staff. |
| Difficulty in Career Advancement | - Bureaucracy in the promotion process; - High requirements and long duration for promotion; - Expectations easily frustrated due to bureaucratic hurdles and high demands. |
Source: Research Data (2025)
The table describes the reasons that led faculty members to be absent or leave the Faculty during the fiscal years under analysis. The primary motivations were dissatisfaction with remuneration and lack of benefits, institutional policies, and difficulties in career progression.
Table 6: Faculty Turnover Rates from 2018 to 2023
| Faculty Members | Fiscal Years | Total | |||||
| 2018 | 2019 | 2020 | 2021 | 2022 | 2023 | ||
| Separated (Leavers) | 3 | 3 | 4 | 2 | 3 | 6 | 21 |
| Average Staff (Headcount) | 41 | 49 | 48 | 43 | 51 | 55 | - |
| Turnover Rate (TRT) | 7.3% | 6.1% | 8.3% | 4.7% | 5.9% | 11% | 43.3% |
Source: Research Data (2025)
The table demonstrates that the turnover rate is negatively affected by the number of faculty members who leave during the academic year. It can be observed that the greater the number of departures, while keeping the average staff size constant, the higher the turnover rate will be. It is also evident that, over time, the Faculty has recorded increasing turnover rates, with the highest level observed in 2023, indicating that the faculty structure is not significantly stable.
To better visualize the behavior of the turnover rate over the years under analysis, Figure 2 presents the trend of the turnover index and the number of departing faculty members.
Figure 2: Behavior of the turnover index and departing faculty members
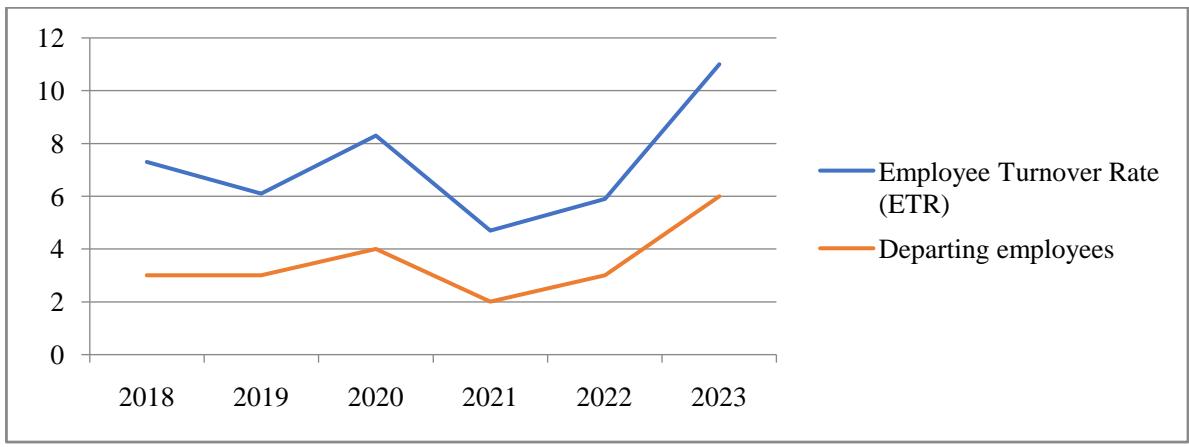
Source: Research Data (2025)
The graph in question shows the behavior of the Employee Turnover Rate (ETR) of the institution in parallel with the number of departing employees in the period from 2018 to 2023. It can be observed that the institution presents a growing turnover rate, although it showed a significant reduction in 2021 to about .
5.2. Absenteeism Rate (AR)
The absenteeism rate determined here had turnover as its main factor, that is, after the resignation (termination) of a faculty member, the Faculty of Economics (FE), in the specialization cycles of the undergraduate degree, recorded a period of absence of the departing lecturer and consequently class interruptions.
According to the data collected in the interviews, the institution does not have immediate substitute lecturers in the specialization periods, that is, from the third (3rd) to the fourth (4th) year, which therefore creates the need for new hires. In the case of admission through a public recruitment process, the minimum hiring period is about 2 years, leading the institution to record a level of absenteeism in the classrooms due to the absence of lecturers.
According to the interviews conducted, the maximum period for replacing a departing lecturer through direct hiring is about 1 month (i.e., 30 days). However, considering the regular weekly teaching days (5 days per week), this corresponds to 20 days.
Table 7: Hours of absence of the departing Assistant Professor without classes
| Description | Value / Formula | Result |
| Number of departing lecturers | - | 6 |
| Weekly teaching load / lecturer | - | 10 hours |
| Teaching days / week | - | 5 days |
| Daily teaching load | Weekly teaching load ÷ Teaching days / week | 2 hours / day |
| Period without replacement (through direct hiring) | - | 20 days |
| Hours without classes / lecturer | 2 hours/day × 20 days | 40 hours |
| Total hours without classes (6 lecturers) | 6 lecturers × 40 hours | 240 hours |
Source: Research Data (2025)
According to the data presented in Table 7, it can be seen that one (1) departing Assistant Professor, considering the replacement period through direct hiring, accounts for approximately 40 hours of absence. In other words, the level of absenteeism in terms of hours is 40, and when considering the six lecturers in this category, the total absenteeism hours amount to 240.
5.3. Determination of the Absenteeism Rate (AR)
The absenteeism rate seeks to determine the absenteeism index of a worker, in this case a faculty member, considering the hours of absence and the normal working hours established by law.
Hours of absence of one lecturer (Assistant Professor) = 40 hours;
Expected hours of one lecturer (Assistant Professor) = 40 hours (reference on an annual basis).
The absenteeism rate of a departing faculty member is . In other words, during the period in which the faculty member remains unfilled until another is hired to cover the vacancy, students are left without classes, while the institution continues to bear the costs of maintaining all teaching conditions during this unproductive period.
5.4. Cost Structure Analysis
Given the number of permanent faculty members, considering both entries and exits, it was possible to observe fluctuations in the cost structure. The higher the number of faculty members in a given fiscal year, the greater the cost structure.
Table 8: Cost Structure
| Year | No. of Faculty | Salary (A kz) | Cost Structure (A kz) |
| de custos | |||
| 2018 | 41 | 2 104 950,18 | 86 302 957,38 |
| 2019 | 49 | 2 104 950,18 | 103 142 558,82 |
| 2020 | 48 | 2 104 950,18 | 101 037 608,64 |
| 2021 | 43 | 2 104 950,18 | 90 512 857,74 |
| 2022 | 51 | 2 104 950,18 | 107 352 459,18 |
| 2023 | 55 | 2 104 950,18 | 115 772 259,90 |
| Total | - | 12 629 701,08 | 604 120 701,66 |
Source: Research data (2025)
The table above presents the cost structure based solely on faculty remuneration over the years. Remuneration costs varied over time, influenced by the number of faculty members listed on the payroll. The fiscal year 2023 recorded the highest cost structure value, due to staff turnover, that is, a positive variation resulting from the entry and exit of faculty members in the institution.
5.4.1. Costs for Hiring a Faculty Member
For the recruitment and onboarding of a faculty member, the institution follows specific procedures and incurs costs, as detailed in the table below.
Table 9: Costs for Hiring a Faculty Member
| Nature of Cost | Stage | Value (Kz) |
| Radio and Newspaper | Public course announcement | 83.750,00 |
| Meals | C.C. deliberation and commission setup | 192.000,00 |
| Consumables | Public course announcement | 89.890,00 |
| Communication | Public course announcement | 340.500,00 |
| Jury Panel Commission | Publications | 1.100.000,00 |
| Training / Seminars | Publications | 940.000,00 |
| Grand Total | - | 2.746.140,00 |
Source: Research Data (2025)
For the recruitment of a faculty member through a public tender, the institution incurs a total cost of 2,746,140.00 Kz (Two Million, Seven Hundred and Forty-Six Thousand, One Hundred and Forty Kwanzas). The determination of its unit cost depends on the number of faculty members hired. Due to price fluctuations and the inclusion or removal of elements (cost categories), the total amount may be updated, meaning it must be determined according to the specific circumstances of the period under analysis.
Based on the position of Localateli et al. (2023) and Santos, M. & Santos, R. (2022), the cost of dismissing a worker also includes the cost of hiring them. Therefore, for the calculation of the total cost of faculty turnover and the unit cost of dismissed faculty members, the hiring cost will be taken into account, as further detailed in Table 10.
Table 10: Unit cost of admitted and dismissed lecturers
| Year | Total Cost (Kz) | Dismissed | Unit Cost of Dismissal (Kz) | Admitted | Unit Cost of Admission (Kz) |
| 2018 | 2.746.140,00 | 3 | 915.380,00 | 8 | 343.267,50 |
| 2019 | 2.746.140,00 | 3 | 915.380,00 | 19 | 144.533,68 |
| 2020 | 2.746.140,00 | 4 | 686.535,00 | 5 | 549.228,00 |
| 2021 | 2.746.140,00 | 2 | 1.373.070,00 | 5 | 549.228,00 |
| 2022 | 2.746.140,00 | 3 | 915.380,00 | 13 | 211.241,54 |
| 2023 | 2.746.140,00 | 6 | 457.690,00 | 11 | 249.649,09 |
| Total | 2.746.140,00 | 21 | - | 61 | - |
Source: Research Data (2025)
The total unit cost of dismissing a lecturer during the period under review is 130,768.6 Kz (One Hundred and Thirty Thousand, Seven Hundred and Sixty-Eight Kwanzas and Six Cents). This may vary according to the number of dismissals in each year, that is, the higher the number of dismissals, the lower the unit dismissal cost of that year, and vice versa. As shown in Table 10, the unit cost in 2023 was the lowest due to the higher number of dismissals, while the unit cost in 2021 was the highest since the institution absorbed fewer dismissals that year.
The cost of admission follows the same principle: the higher the number of admissions, the lower the unit cost of admission. The total unit cost of admission, considering the total number of workers during the period under analysis, is .
5.4.2. Hidden Costs of Turnover and Absenteeism
Hidden costs can be determined using two methods: SOF and the Structural Cost Contribution Method (SCCM). For this research, the SOF method was applied.
a) Functional Diagnosis (Identification of Dysfunction)
This phase consisted of identifying dysfunctions, which, according to the observation technique applied by the authors, were identified at FEUON as follows: absence from the workplace (classroom) for a period of 30 days, associated with lecturer turnover based on dismissal.
b) Determination of Hidden Costs
Hidden costs are generated by dysfunctions which, according to the data collected through interviews and observation, originate not only from absenteeism but also from the turnover of teaching staff.
The total unit cost is 130,768.6 Kz (One Hundred and Thirty Thousand, Seven Hundred and Sixty-Eight Kwanzas and Six Cents).
Turnover Cost (TC) = average cost per employee × number of dismissed lecturers
Turnover Cost (TC) = 130,768.5714 Kz × 21
Turnover Cost (TC) = 2,746,140.00 Kz, the visible cost of turnover.
Hidden Turnover Cost = Visible Turnover Cost × TR
Hidden Turnover Cost = 2,746,140.00 AOA × 44%
Hidden Turnover Cost = 1,208,301.60 AOA
Absenteeism Cost = Turnover Cost × Absenteeism Rate
Absenteeism Cost = 2,746,140.00 AOA × 100%
Absenteeism Cost = 2,746,140.00 AOA
Table 11: Determination of hidden and visible costs using the SOF method
| Hidden Cost Indicators Non-production | Component | Total Costs |
| Não produção | ||
| Absenteeism | 2.547.165,6 | 2.547.165,6 |
| Turnover (hidden) | 1.208.301,60 | 1.208.301,60 |
| Total Hidden | 3.755.467,20 | 3.755.467,20 |
| Turnover (visible) | 2.746.140,00 | 2.746.140,00 |
| Grand Total | 6.501.607,20 | 6.501.607,20 |
Source: Field Research (2025)
According to the table above, the diagnosis carried out on the services provided by the Faculty of Economics of the 11 de Novembre University (FEUON), based on socioeconomic theory, identified only one component—non-production—caused by dysfunctions resulting from absenteeism and faculty turnover during the academic years 2018 to 2023.
According to the Social, Organizational, and Financial (SOF) method, during the six years under study, both hidden and visible costs were recorded, amounting to 6,501,607.20 Kz (Six Million, Five Hundred and One Thousand, Six Hundred and Seven Kwanzas and Twenty Cents).
The hidden costs identified, totaling 5,293,305.60 Kz (Five Million, Two Hundred and Ninety-Three Thousand, Three Hundred and Five Kwanzas and Sixty Cents), will be added to the cost structure,
considering the six-year period under analysis. That is, the average hidden costs resulting from turnover per year will be the quotient between the total costs identified and the number of years analyzed. Thus, we obtain:
Annual (Average) Turnover and Absenteeism Costs =
Average Annual Hidden Costs (Turnover) =
Average Annual Hidden Costs (Turnover) = 1.083.601,20 Akz. This means that the faculty incurred an annual cost, with a large hidden or even invisible percentage, amounting to 1,083,601.20 Akz (One Million Eighty-Three Thousand Six Hundred and One Kwanzas and Twenty Cents), which will be added to the cost structure.
Table 12: Restructuring of Faculty Costs
| Year | N° of | Salaries | Cost | Costs | Total |
| Faculty | (Akzs) | Structure | Turnover and Absenteeism | ||
| 2018 | 41 | 2 104 950,18 | 86 302 957,38 | 1 083 601,20 | 89 491 508,76 |
| 2019 | 49 | 2 104 950,18 | 103 142 558,82 | 1 083 601,20 | 106 331 110,20 |
| 2020 | 48 | 2 104 950,18 | 101 037 608,64 | 1 083 601,20 | 104 226 160,02 |
| 2021 | 43 | 2 104 950,18 | 90 512 857,74 | 1 083 601,20 | 93 701 409,12 |
| 2022 | 51 | 2 104 950,18 | 107 352 459,18 | 1 083 601,20 | 110 541 010,56 |
| 2023 | 55 | 2 104 950,18 | 115 772 259,90 | 1 083 601,20 | 118 960 811,28 |
| Total | - | 12 629 701,08 | 604 120 701,66 | 6 501 607,20 | 620 252 009,94 |
Source: Field Research (2025)
From Table 12, it can be seen that turnover and absenteeism generated costs, averaging 1,083,601.20 Akz annually, and these costs were not considered when determining the cost structure. It can also be observed that the previously determined cost structure did not express the exact reality of the facts, since part of the personnel costs, namely 6,501,607.20 Akz, were not recorded over the six (6) years, as they were hidden and not identified by traditional methods, except for the visible ones.
VI. DISCUSSION
The analysis carried out showed that faculty turnover at the Faculty of Economics of the Universidade 11 de Novembro (FEUON) has generated significant hidden costs, which directly impact the institution's cost structure but had not previously been properly recognized or measured.
From the theoretical framework, it is clear that authors such as Chiavenato (2014), Marras (2011) & Santos, M. and Santos, R. (2022) have already highlighted the financial and organizational effects of employee turnover. In the specific case of the Faculty of Economics of the Universidade 11 de Novembro, the empirical data corroborate these insights, revealing a significant average turnover rate, peaking at in 2023, and an absenteeism rate of , which resulted in average annual hidden costs of 1,083,601.20 Akz.
The main causes of turnover and absenteeism identified were dissatisfaction with working conditions, deficient institutional policies, lack of incentives, and limited career progression opportunities. This confirms the theoretical proposition that turnover is not solely due to external factors, but also the absence of effective human resource management policies (Xavier, 2006; Cardozo, 2005).
Another relevant point was the high level of faculty absenteeism, which directly impacted the interruption of classes, particularly during the specialization phase of undergraduate studies, resulting in negative consequences for the quality of education provided. This phenomenon, associated with a lack of planning and rapid replacement, led to 240 hours of classes not being taught per year, which, in addition to the pedagogical loss, represents a real economic cost. Therefore, the institution has been operating with an underestimated cost structure. The inclusion of hidden turnover costs revealed a deviation of more than 5 million Kwanzas (Akz) over six years, a figure that compromises strategic decisions based on incomplete information.
VII. FINAL CONSIDERATIONS
This research demonstrated, based on socio-economic theory and the foundations of Cost and Management Accounting, that faculty turnover at the Faculty of Economics of the Universidade 11 de Novembro (FEUON) has been a significant source of hidden costs. Using an exploratory-descriptive methodological approach, combined with the application of the SOF method, it was possible to quantify impacts that substantially affect the institution's productivity, resulting in hidden costs. Hence, it is recommended to integrate cost and management accounting into the personnel department to allow continuous measurement of hidden costs.
During the economic years 2018 to 2023, the institution recorded 21 faculty resignations, with an average turnover rate of , reaching in 2023, the highest rate of the period. These resignations, driven by poor working conditions such as workload, lack of equipment and classroom air conditioning, institutional policies—particularly concerning remuneration, medical assistance, housing, access to credit, and career progression difficulties—resulted in total hidden costs of 5,293,305.60 Akz (Five Million, Two Hundred and Ninety-Three Thousand, Three Hundred and Five Kwanzas and Sixty Cents), averaging 882,217.60 Akz per year.
As pointed out by Chiavenato (2009; 2014), turnover costs include both direct expenses (such as recruitment, selection, and termination) and intangible effects (loss of productivity, impact on organizational climate, and institutional image). At FEUON, these costs are further manifested by absenteeism during periods without faculty replacement, representing 40 hours of missed classes in a single year, totaling 240 hours over the six years analyzed.
Therefore, as emphasized by Xavier (2006) and Cardozo (2005), valuing human capital is a central element for institutional performance. At the Faculty of Economics, the absence of faculty retention programs, a structured career progression system, and continuous training plans contributed to increased turnover and, consequently, to the rise in structural costs.
The theory defended by Locateli et al. (2023), which states that the cost of turnover goes beyond the visible and undermines organizational competitiveness, is fully confirmed in this study. Hidden costs from turnover and absenteeism significantly and silently increase the cost structure of the Faculty of Economics of the Universidade 11 de Novembro, affecting the institution's economic, financial, and academic results. Thus, it is recommended to adopt personnel planning strategies that allow for agile and less impactful replacements, and to build an institutional career model with incentives for training, scientific production, and professional stability.
Finally, this study contributes to the literature by reinforcing that turnover is not merely a personnel flow phenomenon, but a generator of costs and organizational dysfunctions. Its non-identification and measurement can compromise the efficiency, effectiveness, and sustainability of public higher education institutions in Cabinda.
RECOMMENDATIONS
In light of the results obtained, we recommend the following for the Faculty of Economics of the Universidade 11 de Novembro (FEUON):
- To implement faculty retention policies, including economic incentives and social benefits, as a way to reduce resignations motivated by dissatisfaction;
- To structure a transparent career progression plan, capable of ensuring professional appreciation and continuous motivation of the faculty (Cardozo, 2005);
- To adopt strategies for the immediate replacement of resigned faculty members, minimizing the effects of prolonged absenteeism and ensuring the continuity of pedagogical activities (Santos & Santos, 2022);
- To integrate cost and management accounting into the personnel department for the continuous measurement of hidden costs, applying methods such as the Contribution of Structural Costs, in order to support strategic decisions (Savall & Zardet, 2006; Deco, 2023).
Conflict of Interest
The authors declare no conflict of interest.
Ethical Approval
Not applicable
Data Availability
The datasets used in this study are openly available at [repository link] and the source code is available on GitHub at [GitHub link].
Funding
This work did not receive any external funding.
Cite this article
Related Research

Special Issue
Launch a focused special issue to highlight research, emerging trends, and expert insights in your academic field.
