


IntelliPaper
Abstract
Purpose – The purpose of this paper is to support operating facilities in identifying the appropriate and adequate initial turnaround (TA) inspection scope strategies and prioritizing operation, maintenance & engineering efforts to help deliver production operational targets by limiting the TA on to the equipment that internal inspection is necessary and avoid unnecessary replacement of internal parts (e.g., catalysts, desiccant, etc.) due to exposing the equipment to internal inspection. Furthermore, identify the inspections that can be performed non-intrusively and online, which can shorten the TA duration, minimize business interruption, and maximize plant availability.
Design/methodology/approach – The case study was conducted using one of the most widely deployed risk models in the oil and gas industry, where a full assessment was performed on an offshore gas-producing platform.
Explore Digital Article Text
I. INTRODUCTION
In the chemical industry, major losses are primarily generated by asset failures . Therefore, adopting proper maintenance strategies allows for increased reliability while reducing the impact of unexpected breakdowns . The only way to ensure the integrity and sustainability of the physical assets used in the process industries, including the oil and gas industry, is to perform turnaround (TA) maintenance with project management considerations . However, in an intensely competitive global market characterized by increasing scales of production, the effective planning and management of that maintenance activity is coming to be seen as an ever more critical business process . Nowadays, TA projects have to meet very challenging safety, environmental, operability, quality, and even community affairs standards in addition to best-in-class cost and schedule goals. Consequently, a more serious and focused effort has recently gone into the design of technologies capable of monitoring and maintaining plants online, minimizing costly outages with all their attendant risks to safety, reliability, business, and the environment. While the quest for production without regular plant shutdown goes on, and the goal remains tantalizingly out of reach, there will remain the need to organize and perform significant maintenance activity in the form of plant TAs.
For static equipment, inspections play a pivotal role in ensuring integrity and reliability. If there are effective integrity management systems, most equipment failures do not occur without any warning signs . However, there will remain some inspection work that can only be conducted when the plant has been taken offline and made safe for the performance of such work. Thereby, TA is defined as periodic maintenance in which plants are shutdown to allow for inspections, repairs, replacements, and overhauls that can be conducted only when the assets (plant facilities) are taken out of service . TA activities typically include:
1. Work that cannot be done unless the whole plant is shutdown;
Work that can be done while equipment is in operation but requires a lengthy period of maintenance work and a large number of maintenance personnel; and
Defects that are pointed out during operation but cannot be repaired will be maintained during the TA period.
TA cost, duration, and execution strategy are dependent upon the inspection scope of work. Approximately 50% of all shutdown projects are delayed by more than 20% and 80% overrun budget by more than 10% [25]; therefore, having optimal TA scope is highly critical to the success of the TA maintenance projects. Consequently, over the past few decades, a lot was work has been done to develop Risk-based maintenance strategies to provide a basis not only for considering the reliability of a system when making decisions regarding the type and the time for maintenance actions, but also to be able to take into consideration the risk that would result as a consequence of an unexpected failure. Furthermore, the maintenance evolved to more sophisticated strategies like condition monitoring and reliability-centered Maintenance . ASME introduced a risk-based approach to manage maintenance. This is part of the holistic asset integrity management system . Many research studies have highlighted the integrated and hybrid solution for maintenance decision-making, but the integration of cost, risk, and performance is something that can be researched in the future scope of work .
In mathematical terms, this issue of maintenance optimization or planning constitutes a sequential decision-making problem in an uncertain environment, and its resolution is a difficult challenge, and the selection of the most cost-efficient strategy is seldom straightforward. [20]. It entails using stochastic models to describe and quantify reliability, random degradation processes, or the outcome of maintenance decisions [21, 22]. The purpose of maintenance optimization is to plan preventive actions in order to get the best possible outcome according to some selected criteria, usually expected cost [20]. The process of determining the TA scope is affected by many factors and a multitude of variables, which may be stochastic, fuzzy, or unknown, and requires a comprehensive formal framework for decision making. Therefore, the motivation of this article is to establish a correlation between achieving effective TA while optimizing the maintenance and inspection resources [1].
1.1 Statement and Objectives of the Framework Proposed
TA maintenance is the most expensive maintenance activity because of the high direct cost of tools, materials, and labor, and more importantly, the indirect cost of lost revenue due to the shutting down of production. Both cost components are directly dependent on the duration of the shutdown interval. The industry's TA performance statistics show that there is still significant improvement required to achieve predictably competitive TA results. To satisfy the present-day business environment of optimistic targets, business viability and manufacturing competitiveness are now highly defined by the ability to deliver superior TA performance.
Competitive TA performance is not possible without an aggressive scope control and optimization effort. [7] Proposed a critical index for deciding on activities that should be included in the TA process. They compared this method with the risk-based decision-making method in the case study of TA in a refinery in Italy and reported a significant improvement in resource consumption reduction. Therefore, the primary objective in planning TA maintenance activities is to minimize the length of the shutdown time duration. Other important objectives include minimizing the total cost and maximizing safety and reliability [8].
The goal of the framework presented here is to create an optimal inspection strategy that minimizes overall costs consisting of both breakdown and inspection costs. Solving multi-criteria problems like optimization can be done either by using deductive logic with scaled assumptions, or the other method is developing a hierarchy or network system and inserting all possible factors to derive all possible outcomes .
This paper aims to introduce a structured and logical methodology for developing a TA inspection scope that is economically justifiable with minimum risk to the enterprise.
The very first question is, 'Is the initial Turnaround necessary at all?
Performing the initial TA after the plant startup at an interval shorter than the normal or subsequent TA is recognized as a mandatory requirement in the Oil and Gas (O&G) industries to verify the design and operation integrity of the equipment for corrosion, fouling, fabrication and construction defects, and/or any other potential damage mechanisms. This is to establish baseline data and determine the subsequent TA intervals. The initial TA intends to reduce operational, health, and safety risks while capturing the following, but not limited to:
Shortcomings inherited from design, procurement, installation, and commissioning.
Development of inspection baselines and integrity performance records.
Addresses Project quality deficiency carryovers.
Ramification of equipment with improper material selection and design.
Resolving commissioning and operational upsets.
The details of the inspection scope and the practice of inspection test planning are key variables that must be clearly defined to establish a complete and effective TA scope of work. The inspection of static equipment commenced with internal inspections to verify the equipment's mechanical integrity. This internal inspection involves taking the equipment out of service and preparing it for examination, which includes performing an internal visual inspection supported by Non-Destructive Testing (NDT).
It is worthwhile to introduce the so-named Risk-Based Shutdown (RBS), which is a particular kind of Risk-Based Inspection (RBI) or maintenance that considers the devices that cannot be maintained or inspected without stopping the operation of the plant. During the past decades, RBS has also gained much popularity in several application fields . Inspection and maintenance activities are prioritized based on quantified risks resulting from equipment failure so that the overall risk of the system is minimized .
II. FRAMEWORK METHODOLOGY
The purpose of this work is to provide a structured framework for conducting an I-TA inspection scope optimization study, which aims to determine a cost-effective inspection strategy that provides satisfactory confidence in the equipment's safe and reliable operation. The proposed methodology aims to balance defining and evaluating various aspects of equipment technical integrity with the necessary depth of analysis for each relevant point. This approach is intended to make cost-effective decisions while maintaining asset integrity and meeting the objectives of the initial TA. It involves examining the equipment journey from a comprehensive perspective, considering past experiences, current factors, and potential future issues.
A key characteristic of multi-attribute decision-making (MADM) problems, such as developing TA scope, is that there is typically a limited number of predetermined alternatives that correspond to varying levels of achieving the attributes. Based on these attributes, a final decision must be made. This task is quite complex and demands consideration of a wide spectrum of issues; therefore, the approach presented here seeks to add clarity and consistency to the process of identifying the most cost-effective initial TA inspection scope for every piece of equipment. It provides structured guidelines for systematically identifying and classifying the main assets' criticality while considering operational and maintenance constraints, thereby minimizing subjectivity in determining the TA scope.
The Analytic Hierarchy Process (AHP) is an MADM technique that has become, over the past decades, a very common tool for decision-making . The methodology is developed based on the hierarchical model created according to AHP rules . AHP is a robust and flexible methodology that consists of three steps: Step I, formulating the decision problem in a hierarchical structure where the top level reflects the ultimate objective of the decision problem, i.e., the optimum TA scope that balances between integrity and resources utilization. The lower layers comprise the attributes and factors that influence the decision. In the second step, the multidisciplinary team evaluates all those different attributes and their relative weights and importance, simultaneously performing multidimensional risk analysis. The team needs to agree on the preferences to incorporate subjectivity, e.g., uncertainty, biases, knowledge, augmentation of various conflicting experts' opinions, etc. The last step is determining the inspection scope based on the multidimensional (MD) risk analysis.
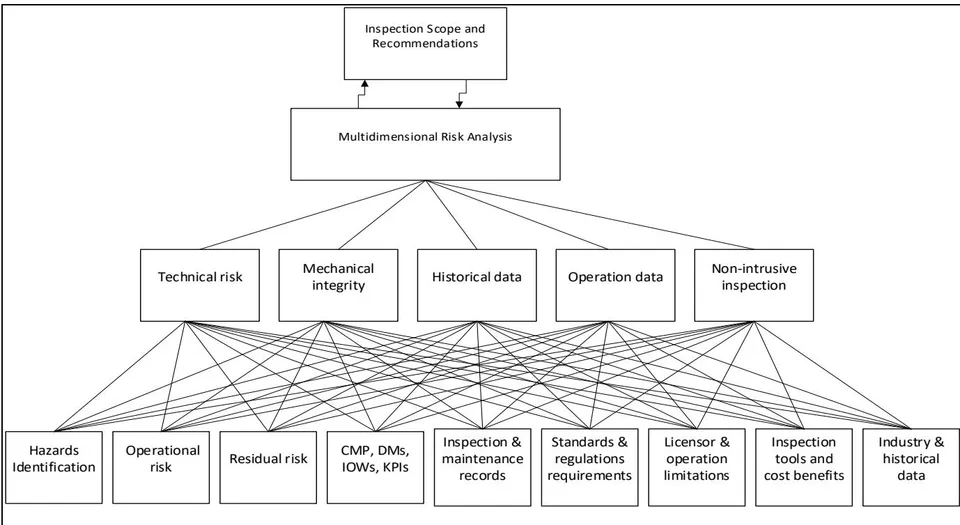
MCDM accounted for diverse factors that serve as central elements in determining the I-TA scope. A comprehensive review is to be conducted for the units included in the study, where the following 5 Dimensions, as illustrated in Figure 1, shall be covered:
Technical risk, including the operational risk, FMEA/FMECA, and residual risk from the fabrication, installation, and construction phases, and the adherent operational risk.
Mechanical Integrity, including startup, baseline inspection, DNs, trips, MOC, etc.
Historical Operation Data, i.e., sister plant/equipment inspection, maintenance, and industry practices.
Operation Integrity to cover compliance with integrity operating windows (IOWs), KPIs, CMP, etc.
5. Detection capability of non-intrusive inspection (NII)
Traditionally, inspecting static equipment required taking it out of service for internal visual inspection and Non-Destructive Testing (NDT). Advances in NDT now allow inspections without downtime, known as Non-Intrusive Inspection (NII). NII can enable performing inspection while the equipment is online, thereby eliminating the need for personnel to enter confined spaces to perform the inspection. This advantage can significantly decrease the frequency of confined space entries, minimizing line breaks and subsequent leak tests. Additionally, it increases equipment availability, reduces lost and deferred production, and shortens TA duration. It is estimated that as much as 80% of equipment can be assessed using non-intrusive methods [32].
However, NII must be thorough enough to identify potential damage and evaluate equipment integrity. It must also provide information for safe operation until the next turnaround. When using NII, it is crucial to show that the method is as effective as internal inspections. This part of MCDM assesses NII in verifying design integrity, applicability, capabilities, and operational limitations of online inspections.
{"image_source":{"path":"images/6df19312c0377c6b4ebdc221b2353b1d2dff03b5efa47f248d1f0648cefa8d92.jpg"},"content":"","chart_caption":[{"type":"text","content":"Figure 1: Dimensions of integrity evaluation"}],"chart_footnote":[]}
These 5 dimensions are cascaded into eleven sub-elements, as illustrated in Figure 1:
Evaluating the inherent risk to each piece of equipment, including the residual and operational risks.
Determining the potential damage mechanisms based on the material of construction, process, and operating conditions.
Reviewing the inspection histories of other sister plants and the industry practices and experience.
Reviewing the industry historical data and best practices.
Verifying the design integrity during the initial TA.
Reviewing the fabrication and construction records.
Figure 2 provides an overview of the methodology concept and basic components.
Reviewing the operation and maintenance history.
Verifying compliance with the corrosion management program, KPIs, and integrity operating windows [29, 30, 31].
Reviewing the operation system configuration, i.e., redundancy, isolation, etc.
10. Evaluating the applicability of NII.
- Validating the initial TA requirements stated in the relevant regulations and legislations.
III. CORROSION MANAGEMENT
Materials and corrosion reviews should address all material, corrosion, and welding issues, along with in-place corrosion monitoring and control measures. Corrosion control documents (CCD) detail design features and operating requirements related to materials selection, coatings, cathodic protection, inhibitors, chemical treatment, corrosion allowances, monitoring and inspection, post-weld heat treatment if needed, scraping, and microbiologically induced corrosion control. API RP 970 [34] provides CCD guidelines specific to refining. The effectiveness of the corrosion management program is assessed by reviewing
CCDs and IOWs, including checking chemical treatment, wash water systems, and damage mechanisms. The CCD shall be utilized for the following purposes:
Ensure all equipment is included in the CCD with appropriate materials and corrosion control measures.
Review and update damage mechanisms in the corrosion loop diagrams from the detailed design phase. This requires a thorough review of design data, process information, materials, and available inspection data. Figure 3 illustrates the process of Damage Mechanism Review (DMR)
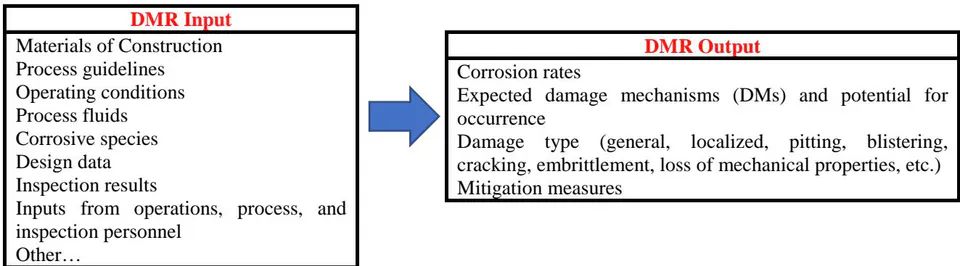
IOWs set limits for process variables impacting equipment integrity if operations deviate for a given time , the DMR involves identifying the type of damage (e.g., thinning, pitting, or cracking) expected for each asset and reviewing the established IOWs and their related details (service & operating parameters, tag, values, source, minimum, maximum, measuring unit, frequency, IOW Type, root cause of any deviation, associated risk, required action, and consequences when minimum or maximum is exceeded). Additionally, it includes a review of direct corrosion data, such as probes/coupons in correlation with the On-stream inspection (OSI) data. The following summarizes the main items that need to be checked:
Corrosion monitoring systems, trends, performance reports, and adequacy and direct corrosion monitoring (i.e., probes/coupons). Sampling points' parameters data that are part of the Corrosion Management Solution (CMS).
Inspection data such as OSI, corrosion monitoring locations (CMLs), i.e., numbers, locations, and inspection technique, positive material identification (PMI), injection points, and corrosion under insulation (CUI) plans.
Completed and opened management of change (MOC) and changes in process operating parameters, IOW parameters, plant's capacities/throughput, and any plans.
Maintenance and reliability reports, bad actor lists, failure reports, and other statistics, including replacement frequencies.
Review risk-based inspection (RBI) assessments' recommendations.
Risk assessment is typically applied as an aid to the decision-making process. As all possible options are evaluated, it is critical to analyze the level of risk introduced with each option. The analysis addressed the inherent criticality of equipment that has two dimensions: asset configuration and utilization. The first dimension (asset configuration) considers the availability of redundancy and buffers. As the redundancy level and buffer capacity increase, the criticality of the assets decreases. Asset configuration has four levels (1, 2, 3, and 4). Level 1 represents the most critical situation, where the asset has no redundancy and no downstream buffer. Level 2 presents the case where the asset has a downstream buffer only, while Level 3 is for the asset with redundancy only. Finally, level 4 represents the scenario where the asset has redundancy and a downstream buffer or more than one redundancy level, which is the least critical scenario. Therefore, in addition to the initial Risk-based Inspection (RBI) assessments, a qualitative approach aligned with API RP 580 was implemented to determine the inspection schema of each piece of equipment. This qualitative risk-based approach requires data inputs based on descriptive information using engineering judgment and experience as the basis for the analysis of the probability and consequence of failure.
Verify the as-built design and materials of construction and perform comparative analysis between operating conditions and design parameters (temperature, pressure, flow, composition, etc.).
Other items to evaluate include equipment performance, such as thermal efficiency, the output specification (e.g., columns, reactor, recovery, etc.), and licensors' technical alerts/recommendations.
Review any deficiencies/issues found during hydrotest and lay-up in the pre-commissioning phase and/or mothballing.
3.1 In-Service Inspection Review
Operational experience is beneficial in confirming the theoretical assessments utilized in FEED and detailed design. Inspection histories of other equipment documented the types and sizes of any flaws found in service (or the absence of flaws), indicating the required inspection for other similar new equipment. This is applicable only if the conducted inspection was effective for the anticipated level of degradation and potential damage mechanisms. The area inspector and corrosion engineer to discuss with the process engineer the following key issues:
Changes in process parameters from the original design and the adopted MOC.
Changes in the plant layout or routing of the process fluids, addition or subtraction of the static equipment, and the adopted MOC procedures.
Any process upsets and their impact on the equipment integrity.
Existing inspection issues in the plant.
Major findings from the sister Plants/Units' previous TA and the remedial actions taken.
The following step-by-step procedure should be applied to all static equipment on the subject plant:
Conduct a systematic review of the inspection record for each equipment in the plant. Consider the temperature and pressure conditions, the corrosiveness of the streams, the material of construction, and the corrosion allowance.
Evaluate the adequacy of the implemented inspection programs based on the conditions and the DMs within each corrosion loop.
Verify the integrity and reliability of the equipment based on the available sister equipment's inspection history findings, inspection scope coverage, and potential damage mechanisms.
Evaluate the effectiveness of the OSI program for the equipment and ensure coverage of the potential damage mechanisms. The review shall be extended to the presence of the equipment OSI drawings, location/distribution of the CMLs, the adequacy of CMLs' types and distribution, and the OSI history results for high corrosion rate and low remaining life.
Review inspection reports for equipment within each corrosion loop and thoroughly analyze for any observations or concerns that could result in a potential failure or increase risk in the plant.
Evaluate the extent of the inspection and the monitoring routine/scope for all equipment. Based on the process, stream conditions, and potential damage mechanisms for the equipment, check if the existing inspection practices are adequate to completely validate and monitor the integrity of equipment and piping. If discrepancies are found, recommendations should be given for the appropriate inspection technique and the extent of the inspection. The established corrosion/erosion rate should be used (if known) for adjusting the frequency and extent of the additional inspection.
All of the problems documented in the inspection records and reports, such as original manufacturing flaws or those related to operations. If the problems are operations-related, recommendations for follow-up inspections should be given. The active damage mechanisms in the equipment should be considered while planning the follow-up inspection recommendations.
Review of the current operating parameters versus the design ones to identify any discrepancies that may result in a potential failure.
Review initial and subsequent TA reports of sister assets.
3.2 Fabrication and Construction Review
One of the main objectives of performing I-TA is to inspect for fabrication and construction deficiencies that may not be revealed during the construction phase and to ensure the adequacy of the equipment design to the operating condition, i.e., design integrity. After finding all deficiencies, confirm the boundaries of each process unit and the actual mode of operation to gain a full understanding of changes in operation.
The fabrication and construction records, such as Equipment Deficiency Reports (EDRs), Non-conformance Reports (NCRs), Box up certificates, etc., shall be reviewed to verify and evaluate any residual risks or threats from the project phase. EDR is to investigate the root cause of the defective materials that have been detected after the completion of manufacturing and site arrival. Box-up is a detailed inspection of the equipment to confirm that all internal shown on design drawings have been correctly installed and inspected Typically this shall include not only trays, but also all internal parts, such as structure packing, baffles, dividers, vortex breakers, nozzles, flow distributors, piping, demister pads and catalyst supports and other mechanical parts of equipment.
whereas normal defects are mostly non-critical imperfections to the equipment's technical integrity. All corrective actions for the field observations need to be reviewed to confirm that all observations were rectified before the equipment was put into service. Finally, all Major construction observations that were rectified were tabulated in the I-TA study detailed Excel sheet and reviewed again during the study workshop stage for the final decision-making of TA categorization.
3.3 Operation and Maintenance History
One of the main criteria used to determine the process units that can be included in this study is having at least a full year of operational history. The objective of this constraint is to ensure the operation conditions reach steady states and all equipment is in operation for quite enough time to evaluate the actual operating conditions versus the design conditions. Moreover, review the maintenance history, such as the MOCs, DNs, and any other repairs or changes made to the equipment since the start-up date.
3.4 Multi-Dimensional Risk Analysis
The methodology utilizes multi-dimensional risk assessment as an aid to the decision-making process, whereas all possible TA options are evaluated, it is critical to analyze the level of risk introduced with each option. An accurate portrayal of risks is a key step in the methodology to ensure reaching the optimum inspection plan without jeopardizing asset integrity or the objective of the I-TA. The primary challenge in risk assessment lies in its multidimensional nature. A commonly accepted and relatively quantitative definition of risk is the product of probability and consequence. While this definition allows for a straightforward quantification of risk, it can sometimes be problematic, particularly when estimating probability is subjective. This is often the case with new equipment for which there is insufficient data to accurately assess the probability of failure. The methodology introduced here integrates various dimensions of risk, breaking down the probability aspect into two distinct sub-dimensions. This approach has resulted in the development of Multi-Dimensional Risk Analysis (MDRA).
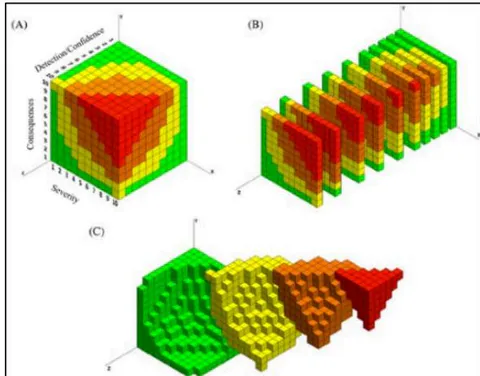
The MDRA technique includes risk evaluation that is conducted for every sub-element of the MADM 5 Dimensions and their sub-elements. A 3D risk analysis, as illustrated in Figure 4, shall be conducted to evaluate three dimensions of risk:
The dimension is the Confidence and Detectability. This dimension presents the SMEs' confidence in the equipment's technical integrity based on the available data and the probability of NII detecting any deterioration in the equipment's mechanical integrity.
The dimension is the severity of the operating environment and the in-place monitoring and control schema. Moreover, consider any flaw rolled over from the fabrication, installation, or construction.
The dimension is the consequences of failure. The consequence analysis shall address the inherent criticality of equipment, which has two dimensions: asset configuration and utilization. The first aspect (asset configuration) considers the availability of redundancy and buffers. As the redundancy level and buffer capacity increase, the criticality of the asset decreases. Asset configuration has four levels (1, 2, 3, and 4). Level 1 represents the most critical situation, where the asset has no redundancy and no downstream buffer. Level 2 presents the case where the asset has a downstream buffer only, while Level 3 is for the asset with redundancy only. Finally, level 4 represents the scenario where the asset has redundancy and a downstream buffer or more than one redundancy level, which is the least critical scenario.
The failure consequences can be measured in terms of their impact on people, environment, economy (i.e., production losses), and company reputation. Therefore, operating facility Health, Safety, and Environment (HSE) objectives need to be considered as part of the asset failure consequences. All assets that have been identified by risk assessment studies as safety-critical shall be flagged, and this flag shall dominate the inspection recommendations category.
Evaluating the asset failure needs to focus on the key failure modes and damage mechanisms that lead to the worst consequences on plant availability due to their high failure frequency (e.g., chronic failures), severe failure consequences, and/or failures with extended downtime duration (e.g., maintenance difficulties, availability of repair, etc.). It is imperative to utilize actual and accurate operational data after facility start-up to establish and develop the inspection strategy. Relying on design data implies huge uncertainty and poses a great risk to the safety and availability of the facility.
Qualitatively evaluating the consequences of the failure of each piece of equipment, the primary objective of this stage is to determine what undesirable incidents could occur (the consequence) as a result of degradation that is measurable by one or more inspection techniques. The risk evaluation also includes an open-ended section to consider the in-place preventive and corrective actions to control and mitigate any potential equipment mechanical integrity deterioration.
The utilized 3D risk matrix given in Figure 4 is a volumetric cube composed of 11 volumetric layers. Each volumetric layer represents one of the 11 sub-elements.
Risk assessment should involve the integration of information to gain insights into the operational risks associated with equipment. To achieve this, it is essential to address the following three questions:
1. What potential failures could occur?
What is the probability of these failures?
What consequences would arise from these failures?
Special course of actions should be determined for some equipment where the risk is unacceptable and cannot be mitigated to an acceptable level by NII; for these equipment items, internal inspection should be deemed necessary.
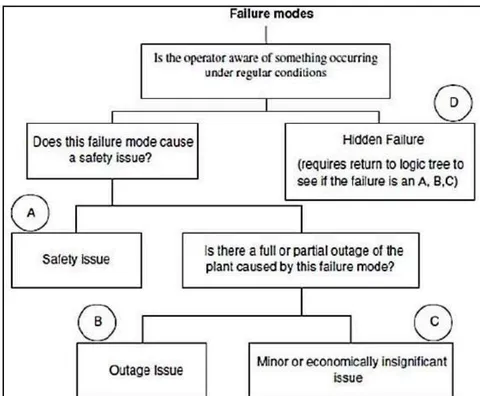
For non-pressure containing parts of equipment or parts associated with hidden failure modes Failure modes such as Fouling on shell/tube side, Leak shell to tubes, Leak tubes to shell, Tube sheet leak, Tray damage, Tray pluggage, Flooding, Down comer damage/plugging, Loss of reflux, etc. hazards should be identified and analyzed by applying failure mode and effect analysis (FMEA/FMECA). FMEA is a widely accepted methodology to determine the maintenance strategy and manage risk [27]. This methodology is basically identifying the potential failure mode of the equipment that will cause the equipment under analysis to fail to perform its intended function and estimating the consequence of that failure [28]. FMEA includes answering these questions related to failure modes (What could go wrong?) Failure causes (Why would the failure happen?)
Failure effects (What would be the consequences of each failure?). FMEA rates each potential failure mode and effect based on the following three factors:
Severity—the consequence of the failure when it happens;
occurrence—the probability or frequency of the failure occurring; and
detection—the probability of the failure being detected before the impact of the effect is realized.
The risk priority is estimated by considering the severity rating, the occurrence probability rating, and the detection probability rating. Figure 5 shows an example of the FMEA for a heat exchanger tube bundle. The logic tree given in Figure 6 can be used for the risk index/priority scheme. A and B have higher priority over C when it comes to the allocation of scarce resources, and A is given higher priority than B.
Figure 5: FMEA for heat exchanger tube bundle
| # | Failure Mode | Cause(s) | Indications/"Announcement" | Predicted Frequency | Consequences | Risk |
| 1 | Tube failure | Corrosion from fluids (shell side). | Odors at the cooling tower. Hydrocarbon detector on the tower. | Frequent—has happened twice in ten years. | Hydrocarbon is at higher pressure than the cooling water. Therefore flammable materials could enter the cooling tower and cause a major fire. | A |
| 2 | Tubesheet failure | See tube failure. Vibration of the tubes may cause the sheet to fail even if the tubes hold up. | See #1. | Rare | See #1. | B |
IV. DELPHI WORKSHOP
The challenges in asset management (AM) in the current industrial era generally include organizational challenges that entail the integration of all stakeholders across the organization hierarchy for the successful implementation and improvement of AM practice . The main characteristic of MADM problems is that there are usually a limited number of predetermined alternatives that are associated with a level of achieving the attributes. Based on the attributes, the final decision is to be made .
Therefore, an in-person workshop shall be conducted and should start with a process presentation of the section of the plant that is covered in the study, and should highlight all commissioning and startup challenges, process and operation concerns, and history. Other disciplines will follow in presenting their findings and recommendations. A Master Sheet shall be used to perform a thorough review of every piece of equipment and shall be used to document all discussion items, any further action, conclusions, and recommendations.
The Delphi technique effectively reaches consensus and forecasts future events by collecting opinions from subject matter experts (SMEs). The Delphi method involves structured communication, anonymity, controlled feedback, iteration, and formal group judgment.
The list of required documents, records, and data outlined in the next section (Case Study) should be reviewed and utilized during the workshop to reach a consensus among the Study team. The decision-making process includes the following steps:
Identifying a wide range of potential options, including novel approaches.
Effectively evaluate the relative merits of each inspection option.
Allowing for appropriate levels of input, review, and analysis.
Assessing all applicable options and the challenges associated with each.
Employing timely and fair decision-making methods to reach a consensus.
The study recommendations shall be categorized as follows:
Category I: Equipment that needs to be taken out of service for a full internal inspection. This also includes equipment that was selected to be a sample (Category III) for other equipment, e.g., fin-fan coolers, heat exchangers, drums, etc.
Category II: Equipment for which NII can be performed in lieu of internal inspection.
Category III: Equipment that is part of the sampling equipment group. For example, if there are six similar fin-fan coolers, then two coolers will be laid under Category I, and the remaining four coolers will be laid under Category III.
Category IV: Equipment that needs internal inspection, but the scope is optimized. For example, the inspection of the shell and tube heat exchanger can be performed without pulling out the tube bundle.
V. DECISION-MAKING GUIDANCE
This section offers a decision-making process to determine the appropriateness of considering NII for inspecting a specific piece of equipment.
Identify the equipment for which NII should not be considered or where the required information cannot be obtained from such an inspection.
Confirm that the equipment is intrinsically suited to inspection by non-intrusive means; that is, there are no immediately obvious impediments to NII being undertaken. These include factors such as where there is no access to the equipment exterior, extreme surface temperatures, geometry constraints, and restrictions to access, as well as any requirement for the inspection of internal fittings.
Identify equipment with no previous in-service inspection history or for which there is a reason that the inspection history may no longer be relevant (due, for example, to a change in process conditions) should not normally be considered for NII.
Identify if there is other equipment for which the inspection history may be directly relevant to the equipment under consideration. Substantially the same in terms of design, geometry, construction, and conditions of service (i.e., normally empty /full, etc.), and there are no factors with potential to cause a difference in nature, distribution, or rate of degradation that can be identified.
Identify opportunities for internal inspection; when the equipment is to be opened for other reasons, advantage should be taken of the opportunity to perform an internal visual inspection. This does not mean that NII should not be done. However, if it is intended to do NII in parallel with internal inspection, then this can be done without additional justification.
Identify the effectiveness and confidence of NII to determine whether NII is appropriate in principle. This requires consideration of how confidently potential flaw types and locations can be predicted, the effectiveness of previous inspections, and the severity and rate of any known or predicted degradation. The decision on whether NII is appropriate in principle is based, to a large extent, on confidence in being able to predict all active degradation mechanisms and, hence, specify methods capable of identifying the associated flaws. The ability to predict degradation mechanisms depends on several factors such as uncertainty in the equipment condition due to confidence in the quality control processes during fabrication, installation, and construction, consequences of failure, severity, detectability, in-place IOWs, process control and monitoring, etc.
VI. CASE STUDY
The proposed methodology was applied to several newly constructed refineries and gas plants that had completed at least one year in stable operation. One of these use cases was for a clean fuel expansion project that consists of Naphtha Hydrotreating (NHT), Continuous Catalytic Regeneration (CCR), Reforming and Isomerization Units to upgrade the diesel and gasoline produced by a refinery, hence, to improve refinery profitability. This is done by decreasing the sulfur content in gasoline to 10 ppm S, benzene content to less than 1% vol, and aromatics content to less than 35% vol.. CFP also produces ultra-low sulfur diesel to 10 ppm and low sulfur diesel to 500 ppm with T85% distillation at 350°C. NHT capacity of 138,000 BPSD, which is further split into two streams after treatment into Light naphtha and Heavy naphtha. The heavy naphtha is further processed in Reforming CCR with a capacity of 90,000 BPSD, whereas the Light naphtha with the other light naphtha available in the refinery, is processed in the Isomerization unit with a capacity of 64500 BSD.
The most crucial phase of the Study is data collection, reconciliation, and quality checks for accuracy:
General
Manufacturers' recommendations for proprietary equipment.
Equipment technical information, such as data sheet, design drawings, and as-built drawings.
Complete list of past failures associated with materials, welding, or corrosion.
Complete list of challenges and changes encountered during commissioning, startup, and the one year of continuous operation.
Failure analysis reports and RCA.
TA reports from sister plants/units.
Incident investigation reports.
Historical capacity/process changes.
Safety Management System (SMS) compliance reports.
List of all MOCs, either closed or opened.
Process Engineering
Operation manual and process description.
Design feed characteristics, product specifications, and properties, and controls.
Material and Heat Balances of the plant.
Battery limit conditions.
Process upset history and IOWs trends from the start-up for at least one year.
Equipment performance evaluation spreadsheets, software, and simulation models.
Operations: operation modes and parameters, trending procedures, HAZOP studies.
Instrumentation and control systems: ESD and control valves' specifications, performance, and maintenance practices.
Tendency to fouling, carry over, or other operation challenges.
Inspection
Final Quality Dossier (FQD) to verify and evaluate any residual risks or threats from the project phase. All NCRs were reviewed during the study to ensure that all NCRs were closed with proper corrective action.
History of equipment preservation.
Box-up inspection reports.
box-up inspection report.
Equipment inspection history and piping replacement.
Documentation for all inspection programs, dead legs, small bore piping/nipples, vents, drains, and corrosion under insulation.
Inspection: OSI and CMLs: isometric drawings and results.
Outstanding and completed Defect Notifications (DNs).
Materials, Welding & Corrosion
Corrosion management techniques and control methods.
Leakage history.
Listing of IOWs with targets, for NHT/CCR, the IOWs consist mainly of parameters associated with the NHT reactor feed heater's skin temperatures, Reaction feed/effluent exchangers, stripper feed/reactor effluent exchanger, Reactor effluent air condenser, separator drum, Reactor effluent air condenser, Regenerator, stripper reflux drum, and catalyst lift velocity. For the Isomerization unit, the IOWs consist mainly of parameters such as Caustic concentration, water pH, Chloride content, etc., associated with Naphtha feeds surge drum, Mercury guard bed, Sulfur guard bed feed/effluent exchangers Naphtha feeds steam heater, Naphtha feeds sulfur guard bed, and Naphtha feeds sulfur guard bed.
Corrosion, cracking, and fouling problems.
Cathodic protection systems conditions.
Corrosion loops, annotated with damage mechanisms.
Heat Transfer Equipment
Original thermal calculation.
Original mechanical calculation.
Repair history for all heat exchanger equipment.
Mechanical drawings for all heat exchangers equipment.
Heater original thermal calculation.
Heater original mechanical calculation.
Heater operation and repair history.
Heater inspection history, including the UT tube thickness readings.
Process parameters trend.
Operation vs. design condition for all heat exchangers.
Heater process parameter trends include tube skin temperature, such as heater duty trend, process flow rate trend, inlet & outlet temperatures trend, fire box Temperature trend, stack temperature trend, heater draft trend, heater excess trend, fuel rate trend, fuel temperature trend, and tube skin temperature trend.
Baseline UT Measurements for the radiant tubes section of all fired heaters.
VII. RESULTS
In the final stage of the risk analysis, the scheme of examination is established for every piece of equipment. It is important to note the interaction between the above stages. The scheme of examination and scope of work were determined based on the type and location of possible deterioration, the inherent operational and technical risk, and the optimum essential inspection effectiveness category to achieve the required risk reduction. Eventually, the inspection and testing techniques, along with the coverage percentage, were selected based on the Inspection Effectiveness Tables. Figure 7 shows the distribution of the recommendations, where 62.21% of equipment falls under Category I, which requires full internal inspection, and 3.97% of equipment falls under Category IV, which requires internal inspection but with an optimized scope.
In total, internal inspection is required for 66.18%. On the other hand, NII is found to be an equivalent substitute to internal inspection for 25.05% that falls under Cat.
II. The scope of work for the remaining 8.77% falls under Category III and will depend on the inspection results of other identical equipment (i.e., no inspection would be required if the inspection was performed on other identical equipment with no major findings.
{"image_source":{"path":"images/d769ae58fed100e4a5a18124a649e028c052bfe8ed7745e4c595ef4c7d2efae2.jpg"},"content":"","chart_caption":[{"type":"text","content":"Figure 7: Distribution of the study recommendations"}],"chart_footnote":[]}
All use cases resulted in around a 40-50% reduction in the original scope. In other words, we optimized the inspection and maintenance resources by focusing on the necessary scope. This reduction in the TA scope means a shorter duration of the TA, which in turn increases plant availability and minimizes business interruption costs. Having a controlled TA scope means less complexity, which translates to a minimum risk of cost overrun and schedule slip. Minimizing personnel safety risk is achieved by avoiding unnecessary maintenance and inspection activities, such as confined space work. Avoiding unnecessary internal inspection and exposing the equipment to the atmosphere can minimize disposal, water washing, steam out, and chemical usage such as alkaline and acidic solutions, i.e., Green TA!
VII. CONCLUSION
There are several MADM methodologies, such as AHP; however, none of these methodologies explicitly address or quantify the risk. This paper introduced a novel hybrid methodology that combined the MADM technique with MDRA to determine the initial TA inspection scope. The methodology presented here was developed at both the strategic level of optimizing the scope of TA toward establishing a cost-effective organization and the tactical level, where a detailed framework was presented to conduct a successful optimization study.
This new methodology forms a corpus of principles, routines, and processes that were deployed at different plants and found to be a sound basis for managing the development of the initial TA inspection scope. The paper presented a use case at a new refinery to identify the appropriate and adequate initial TA inspection scope to aid in optimizing the TA scope, delivering production operational targets, and avoiding unnecessary replacement of internal parts (e.g., catalysts, desiccants, etc.) due to exposing the equipment to internal inspection. The study resulted in around a 50% reduction in the original scope, which minimized the TA duration, increased plant availability, and minimized business interruption costs and environmental impact. Thus, promoting a more sustainable 'Green TA' approach that reduces both business disruption and environmental footprint.
For future work, this innovative methodology should be expanded across diverse plant types, incorporating real-time data analytics or machine learning into the risk assessment, and expanding the framework to cover post-TAs.
Conflict of Interest
The authors declare no conflict of interest.
Ethical Approval
Not applicable
Data Availability
The datasets used in this study are openly available at [repository link] and the source code is available on GitHub at [GitHub link].
Funding
This work did not receive any external funding.
References
Cite this article
Related Research


Special Issue
Launch a focused special issue to highlight research, emerging trends, and expert insights in your academic field.