



IntelliPaper
Abstract
This research delves into the critical role of Environmental, Social, and Governance (ESG) metrics in optimizing energy systems within Chinese industries from 2006 to 2020. By harnessing comprehensive datasets from the China Energy Yearbook and Bloomberg, we conduct a detailed analysis of ESG practices across diverse sectors and regions, correlating them with key energy metrics. Our approach utilizes a range of advanced statistical and analytical methods to unravel the multifaceted ESG-energy relationship. Through sophisticated regression analysis, we quantify the impact of ESG metrics on energy efficiency and sustainable practices. We leverage cutting-edge machine learning algorithms, including deep learning and ensemble methods, to predict future energy development trends. Additionally, network analysis and agent-based modeling offer insights into the complex interplay between ESG factors and energy dynamics. Employing advanced econometric tools like VAR and Panel Data Analysis, our study provides both temporal and cross-sectional perspectives on energy optimization in the context of ESG initiatives. The results indicate notable variations in ESG adoption and energy efficiency across different industries and regions, highlighting the imperative for customized sustainability strategies. This study significantly contributes to the sustainable energy discourse, underscoring the integration of ESG metrics as a pivotal element in shaping efficient and environmentally-conscious energy policies and practices within the rapidly evolving Chinese industrial framework.
Explore Digital Article Text
I. INTRODUCTION
In the evolving landscape of global energy dynamics, the integration of Environmental, Social, and Governance (ESG) metrics with energy development has garnered unprecedented attention, particularly within the context of rapidly industrializing countries like China. This surge of interest is warranted as the transition to sustainable energy systems becomes critical against climate change concerns and shifting policy directives. The intricate relationship between ESG factors and energy dynamics in industrial sectors, especially in China—a global frontrunner in industrialization and energy consumption—is ripe for exploration. This study, situated within the domain of energy engineering and research, seeks to illuminate this intersection, with a specific focus on the Chinese industrial landscape. The interplay between ESG metrics and energy development is complex and multifaceted. Existing research extensively highlights the significance of renewable energy sources, like wind and solar power, in fostering sustainable energy transitions (Galimova, Satymov, Keiner, & Breyer, 2024; Daxini & Wu, 2024). These studies underscore the role of technological advancements and environmental considerations in shaping energy systems. However, there is a significant gap in understanding how these advancements interact with social and governance aspects within the energy sector, particularly in China's diverse and rapidly evolving industrial ecosystem. Furthermore, the literature indicates that methods of energy extraction and utilization, such as geothermal energy in the Gonghe Basin (Hou et al., 2024) or the in-situ pyrolysis of oil shale (Zhang et al., 2024), have substantial implications for energy efficiency and environmental impact. These insights highlight the need for optimizing extraction methods and understanding their ecological footprints, thus contributing to sustainable industrial practices. The concept of energy conservation at the workplace, explored by Ahuja and Puppala (2024), introduces an organizational dimension to energy sustainability, resonating with the governance component of ESG metrics. Similarly, the work by Lin and Teng (2024) on the moderating effect of digitization on carbon emission intensity in industrial chains underlines technological innovation's potential to mitigate environmental impacts.
Moreover, the focus on biomass energy projects (Gao et al., 2024) and energy-saving potential in heating systems (Lu et al., 2024) expands the spectrum of sustainable energy practices. These studies contribute to a more comprehensive understanding of renewable energy sources and their practical applications, reinforcing the need for multi-dimensional analysis in energy research. This backdrop informs our primary research question:
How do ESG metrics influence energy efficiency, conservation, and sustainability practices across different industries in China? This question guides our exploration of the complex interdependencies between ESG factors and energy dynamics. Our research aims to synthesize these diverse perspectives into a cohesive narrative focused on China's industrial context, making a novel contribution by integrating disparate elements and employing advanced statistical and analytical models. This approach fills the identified gaps in the literature and promises significant insights for policymakers, industry stakeholders, and the academic community, advancing sustainable energy practices in the context of ESG metrics. Following this introduction, the paper is structured as follows: Section 2 reviews relevant literature, setting the stage for the hypothesis development in Section 3. Section 4 articulates the research methodology, Section 5 discusses the findings,
II. LITERATURE REVIEW
2.1 Renewable Energy Sources and Technological Advancements
The pivot towards renewable energy sources and their technological advancements forms a cornerstone of sustainable energy transitions. Galimova et al. (2024) illustrate the global implications of such transitions by exploring Greenland's potential as a renewable energy exporter, which is crucial for understanding sustainable energy dynamics. Complementing this, Daxini and Wu (2024) provide a thorough review of solar spectral influences on photovoltaic performance, highlighting the importance of technological nuances in renewable energy production. These studies underscore the environmental component of ESG metrics and their critical role in shaping modern energy systems.
2.2 Energy Extraction and Utilization Methods
Energy extraction and utilization methods significantly influence both energy efficiency and environmental impact. The work of Hou et al. (2024) in geothermal energy extraction in the Gonghe Basin exemplifies this, offering insights into the ecological footprints of such methods. Zhang et al. (2024) further contribute to this discourse through their investigation of oil shale pyrolysis, highlighting the need for optimization to enhance both efficiency and environmental sustainability.
2.3 Organizational and Governance Aspects of Energy Conservation
The role of corporate and organizational practices in energy conservation is explored by Ahuja and Puppala (2024), who introduced the Workplace Energy Conservation Index (WECI). This study aligns with the governance aspect of ESG metrics, emphasizing organizational strategies in energy sustainability. Similarly, Lin and Teng (2024) delve into the moderating effects of digitization on carbon emission intensity, linking technological innovation with governance and policy in energy practices.
2.4 Practical Applications of Renewable Energy Sources
Focusing on practical applications, Gao et al. (2024) discuss the site selection for biomass energy projects, offering a sustainable perspective on energy demand and environmental protection. Lu et al. (2024) examines energy-saving potentials in heating systems, providing alternative solutions for energy efficiency in specific climatic conditions. These studies enrich our understanding of the practical implementation and impact of renewable energy sources.
2.5 Gaps in Current Literature and Need for Multi-Dimensional Analysis
Despite these comprehensive studies, there is a noticeable gap in the literature concerning an integrated analysis of ESG metrics within China's industrial sectors. Most research tends to isolate individual ESG aspects or specific energy technologies, lacking a holistic exploration of their interplay in an industrial context. This gap is particularly evident in the need for advanced modeling techniques to analyze complex interdependencies within rapidly evolving industrial ecosystems like China's.
III. THEORETICAL FRAMEWORK
The intersection of Environmental, Social, and Governance (ESG) metrics with energy development is a nuanced area of study underpinned by several key theories. Sustainable development theory, a cornerstone in this field, posits the need for balancing environmental protection, social equity, and economic growth, crucial for understanding the multidimensional impact of ESG metrics (Magnér S. 2020). Furthermore, the concept of corporate social responsibility (CSR) is pivotal in examining governance practices within the energy sector, offering insights into how corporations can contribute to sustainable energy goals (Carroll, 1991). Theories surrounding energy policy, especially in the context of China's rapid industrialization, provide a lens to understand the regulatory and policy frameworks influencing energy practices (Cheng H, Hu Y.2010). These theoretical foundations are instrumental in framing the study's approach to exploring ESG metrics within China's energy landscape.
3.1.1 Contextual Background of China's Energy Sector
China's energy sector, characterized by its massive scale and rapid transformation, presents a unique landscape for the application of ESG metrics. The nation's journey from heavy reliance on fossil fuels to increasing adoption of renewable energy sources marks a significant shift in its energy paradigm. This transition, while pivotal for global sustainability efforts, is fraught with challenges such as balancing economic growth with environmental conservation and managing the social implications of energy policy changes (Zhou et al., 2010). Understanding these dynamics is essential for contextualizing our study within the broader narrative of global and national energy trends.
3.1.2 Review of Advanced Modeling Techniques
In navigating the complexities of ESG metrics' impact on energy dynamics, our study employed a suite of advanced and novel modeling techniques, alongside robust mathematical models, to offer unparalleled insights:
Regression Analysis: Linear and multiple regression analyses were utilized to examine the relationships between ESG metrics and energy outcomes. This technique helped in quantifying the extent to which variations in ESG metrics can explain changes in energy efficiency and sustainability practices.
Predictive Analytics with Machine Learning: Beyond conventional machine learning approaches, we integrated state-of-the-art algorithms like deep learning and ensemble methods. These techniques, known for their ability to handle large datasets and uncover intricate patterns, were pivotal in predicting future trends and behaviors in energy development and ESG metrics integration.
Network Analysis for ESG Interdependencies: Utilizing network analysis, we mapped and analyze the intricate web of relationships between various ESG factors and energy outcomes. This approach helped reveal the systemic interdependencies and influence patterns that traditional analyses might overlook.
Agent-Based Modeling (ABM): ABM were used to simulate the interactions of agents (industries, government bodies, etc.) within the Chinese energy sector. This allows us to understand the emergent behaviors from the bottom-up and see how individual decisions and interactions lead to complex system-level outcomes.
Advanced Econometric Models: We employed cutting-edge econometric models, such as Vector Autoregression (VAR) and Panel Data Analysis, to quantitatively assess the dynamic relationships over time and across different industries and provinces.
Mathematical Modeling of Energy Systems: Building custom mathematical models enable us to precisely quantify the impact of various ESG metrics on energy efficiency and sustainability. These models were designed to integrate complex variables and parameters specific to China's energy sector, providing a tailored analytical approach.
Scenario Analysis through System Dynamics Modeling: To explore various future scenarios in China's energy sector, system dynamics modeling was used. This helps us in understanding the long-term implications of different ESG strategies under various policy and environmental conditions. Each of these methods is chosen for its ability to dissect the multi-layered relationship between ESG metrics and energy development, ensuring that our analysis is not only comprehensive but also at the forefront of methodological innovation.
3.1.3 Preliminary Discussion on Data Sources
The study utilizes two comprehensive datasets: one focusing on ESG metrics across various industries and provinces in China, and the other detailing energy-related metrics in these contexts. These datasets provide a rich source of information for analyzing the interdependencies between ESG factors and energy dynamics. The data spans several years from 2006 to 2020 allowing for an in-depth temporal analysis, and covers multiple industries, offering a broad perspective on the industrial application of ESG metrics in relation to energy practices. This preliminary overview sets the stage for a detailed exploration in the methodology section.
3.2 Hypotheses
Hypothesis 1: ESG Metrics and Renewable Energy Adoption
H1: Higher ESG metrics in industries are positively correlated with increased adoption of renewable energy sources.
This hypothesis is informed by the findings of Galimova et al. (2024) and Daxini & Wu (2024), who highlight the significance of renewable energy in sustainable transitions. The hypothesis posits that industries with higher ESG scores, indicative of stronger environmental commitments, are more likely to adopt renewable energy technologies. This aligns with sustainable development theories, suggesting that environmental stewardship drives renewable energy initiatives.
Hypothesis 2: ESG Metrics and Energy Efficiency in Industrial Processes
H2: Industries with higher ESG ratings demonstrate greater energy efficiency in their operations.
Drawing from the studies by Hou et al. (2024) and Zhang et al. (2024), which emphasize the need for optimizing energy extraction methods, this hypothesis proposes that industries with robust ESG practices will exhibit more energy-efficient operations. It aligns with the concept of corporate social responsibility, where efficient energy use is seen as part of broader responsible industrial practices.
Hypothesis 3: Organizational ESG Practices and Workplace Energy Conservation
H3: Strong governance components of ESG metrics are associated with more effective workplace energy conservation strategies.
Based on Ahuja and Puppala's (2024) exploration of workplace energy conservation, this hypothesis suggests that organizations with better governance (as part of ESG metrics) will have more effective energy conservation measures in place. It reflects the role of organizational structures and policies in facilitating energy sustainability.
Hypothesis 4: Impact of Digitalization on ESG and Energy Dynamics
H4: The integration of digital technologies in industries positively influences the relationship between ESG metrics and energy sustainability.
Informed by Lin and Teng's (2024) work on digitization and carbon emissions, this hypothesis explores the moderating role of digital technologies in enhancing energy sustainability within the framework of ESG metrics. It posits that digitalization can be a catalyst in strengthening ESG practices, particularly in energy management.
IV. METHODS
4.1.1 Description of the Datasets
ESG Metrics Dataset
Sourced from Bloomberg, this dataset provides an extensive array of ESG metrics across varied industries and provinces in China. It incorporates nuanced aspects of environmental policies, social responsibility initiatives, and governance structures, offering a granular perspective on ESG practices.
Energy Data Dataset
Sourced from China Energy Yearbook Complementing the ESG dataset, this compilation offers in-depth insights into energy metrics, such as consumption patterns, production figures, efficiency ratings, and renewable energy adoption, presenting a holistic view of the energy sector's dynamics.
4.1.2 Advanced Statistical Models and Analytical Techniques
We Employing sophisticated regression techniques, including linear and multivariate models, the study explores the depth of the connection between ESG metrics and energy outcomes. Advanced statistical methods, like ridge regression and Lasso, are incorporated to manage multicollinearity and overfitting, ensuring robust and reliable insights.
4.1.3 Predictive Analytics with Advanced Machine Learning
We Integrated cutting-edge machine learning techniques, including neural networks and ensemble models, the study dives deep into complex datasets, extracting predictive patterns and trends. These algorithms are pivotal in forecasting future trajectories in energy development and ESG integration.
4.1.4 Comprehensive Network Analysis for ESG Interdependencies
A detailed network analysis was conducted to unravel the intricate web of interactions among ESG factors. Utilizing advanced graph theory algorithms, this approach illuminates systemic interdependencies and influence patterns, offering a multi-dimensional perspective on the ESG-energy interplay.
4.1.5 Sophisticated Agent-Based Modeling (ABM)
ABM was deployed to simulate the dynamic interactions among stakeholders within China's energy sector, including industries, government entities, and consumers. This bottom-up modeling approach is enriched with behavioral economics and game theory concepts to reflect the complexity of decision-making processes.
4.1.6 Cutting-edge Econometric Models
Advanced econometric models, like Vector Autoregression (VAR) and Dynamic Panel Data Analysis, were utilized to dissect the temporal and cross-sectional dynamics of ESG metrics and energy parameters. These models are adept at capturing the evolving nature of relationships across diverse industries and regions.
4.1.7 Comprehensive Mathematical Modeling of Energy Systems
Custom mathematical models were developed to quantify the impact of ESG metrics on energy systems. These models incorporate stochastic processes and non-linear dynamics, aligning with the unique characteristics of China's energy landscape.
The Formulas and detailed methodologies for each model are provided to illustrate their application in analyzing the relationship.
Model 1. Linear Regression Analysis
Here Y represents the energy outcome variable (e.g., energy efficiency, sustainability index). X is the independent variable representing a specific ESG metric.
is the y-intercept , is the slope coefficient indicating the effect size of the ESG metric on the energy outcome, and is the error term. This method was used to assess the direct impact of individual ESG metrics on specific energy outcomes.
Multiple Regression Analysis
Y is the dependent variable related to energy outcomes.
represent different ESG metrics.
is the y-intercept , are coefficients for each ESG metric, indicating their individual contribution to the prediction of
We employed multiple regression to understand the combined impact of various ESG metrics on energy outcomes. This approach is crucial for analyzing situations where multiple ESG factors simultaneously influence energy dynamics.
Model 2. Predictive Analytics with Machine Learning
Deep Learning Model:
Where is the activation function, are the weights, are the input features (complex ESG metrics), and b is the bias.
This model was used to capture the nonlinear relationships and interactions among the ESG metrics and energy outcomes.
Model 3. Network Analysis for ESG Interdependencies
Centrality Measures Formula:
where is the centrality of node v, N is the set of nodes, and is the distance between nodes v and w Central
This model was used to understand the influence and importance of various ESG factors in the network structure.
Model 4. Agent-Based Modeling (ABM)
where is the state of agent i at time t, N is the neighborhood of agent i and P represents policy parameters.
This model allows for modeling complex interactions and emergent behaviors in the energy sector, considering individual agent characteristics and actions.
Model 5: Advanced Econometric Models VAR Model
Where is the intercept vector, and are coefficient matrices. Panel Data Analysis
where captures unobserved individual effects.
This model control for unobservable heterogeneity, isolating the impact of ESG metrics on energy outcomes.
Model 6.. Mathematical Modeling of Energy Systems
Energy Efficiency Model:
Where is energy efficiency, are operational parameters, are ESG scores, and are energy consumption metrics.
This Model Quantifies how different operational parameters and ESG metrics interact to impact energy efficiency.
Table 1: Energy Data Descriptive Statistics
| Ad minis trativeDivvisionCode | Longi titudee | Indicator | 2 | 2 | 2 | 2 | 2 | 2 | 2 | 2 | 2 | 2 | 2 | 2 | 2 | 2 | 2 | 2 | 2 | 2 | 2 | 2 | |
| 0 | 0 | 0 | 0 | 0 | 0 | 0 | 0 | 0 | 0 | 0 | 0 | 0 | 0 | 0 | 0 | 0 | 0 | 0 | 0 | ||||
| 0 | 0 | 0 | 0 | 0 | 0 | 0 | 0 | 0 | 0 | 0 | 0 | 0 | 0 | 0 | 0 | 0 | 0 | 0 | 0 | ||||
| 0 | 1 | 2 | 3 | 4 | 5 | 6 | 7 | 8 | 9 | 2010 | 1 | 1 | 1 | 1 | 1 | 1 | 1 | 1 | 2 | ||||
| 1 | 2 | 3 | 4 | 5 | 6 | 7 | 8 | 9 | |||||||||||||||
| 19652 | 2 | 2 | 2 | 2 | |||||||||||||||||||
| 28499 | 949 | 28500 | 1 | 1 | 1 | 1 | 1 | 1 | 1 | 1 | 1 | 1 | 1 | 2 | 2 | 2 | 2 | 2 | 2 | 2 | 2 | 2 | 1 |
| 8 | 0 | 0 | 3 | 3 | 4 | 5 | 7 | 7 | 8 | 9 | 2 | 2 | 1 | 2 | 2 | 2 | 2 | 0 | 1 | 7 | |||
| 4 | 5 | 6 | 0 | 3 | 7 | 2 | 5 | 6 | 3 | 1 | 4 | 4 | 8 | 6 | 5 | 6 | 7 | 5 | 5 | 8 | |||
| 9 | 5 | 7 | 7 | 9 | 2 | 7 | 5 | 9 | 5 | 1 | 5 | 5 | 9 | 7 | 6 | 1 | 0 | 6 | 7 | 2 | |||
| 9 | 1 | 9 | 2 | 0 | 3 | 2 | 3 | 1 | 8 | 7 | 8 | 3 | 1 | 6 | 6 | 3 | 1 | 6 | 4 | 9 |
| 2 | 1284Energy Construction -State-Owned | Beijing | Economy Energy Industry Fixed Asset Investment (Billion Yuan) | 948 | 31 | 1 | 1 | 3 | 3 | 2 | 4 | 5 | 5 | 7 | 8 | 9 | 7 | 1 | 1 | 1 | 1 | 1 |
| 1 | 3 | 9 | 9 | 3 | 4 | 8 | 4 | 8 | 2 | 2 | 4 | 8 | 6 | 9 | 1 | 3 | 3 | 5 | 1 | 8 | ||
| 1 | 3 | 2 | . | 8 | 8 | 7 | 7 | 6 | 6 | 1 | 6 | 8 | 8 | 2 | 1 | 9 | 4 | 8 | 6 | 1 | ||
| 38 | 2 | . | 9 | 0 | 4 | 9 | 0 | 1 | 1 | 5 | 1 | 7 | 5 | 5 | 2 | 0 | 3 | 1 | 1 | 8 | 3 | |
| 30 | 38 | 5 | 9 | . | 3 | . | 4 | . | . | . | . | 10222. | . | . | 7 | 3 | 1 | 1 | 4 | 9 | 0 | |
| 13. | 43 | 0 | 0 | 0 | 1 | 4 | 8 | 6 | 4 | 5 | 5 | 7 | 1 | 2 | 9 | 6 | 5 | 6 | 5 | 0 | 4 | |
| 43 | 91 | 5 | 9 | 7 | 9 | 9 | 0 | 4 | 0 | 4 | 1 | 0 | 3 | 4 | 3 | 8 | 9 | 7 | 4 | 4 | 4 | |
| 43 | 0 | 3 | 7 | 6 | 4 | 2 | 0 | 9 | 7 | 0 | 5 | 1 | 7 | 6 | 2 | 7 | 6 | 4 | 4 | 7 | 1 | |
| 43 | 5 | 0 | 9 | 6 | 8 | 1 | 1 | 2 | 1 | 4 | 6 | 4 | 9 | 0 | 4 | 1 | 9 | 4 | 6 | 7 | 0 | |
| 43 | 5 | 3 | 9 | 9 | . | 2 | 6 | 2 | 8 | 5 | 9 | 9 | 7 | 9 | 3 | 7 | 1 | 5 | 9 | 8 | 7 | |
| 8 | 6 | 3 | 3 | 3 | 2 | 3 | 1 | 3 | 5 | 4 | 6 | 4 | 5 | 4 | 5 | 1 | 7 | 8 | 6 | 1 | ||
| . | . | 6 | 2 | 5 | 3 | 5 | 0 | 7 | 0 | 2 | 8 | 8 | 1 | 3 | 9 | 1 | 5 | 9 | 5 | 1 | ||
| 16 | 3 | 6 | 3 | 6 | 4 | 4 | 3 | 5 | 9 | 2 | 5 | 4 | 5 | 2 | 3 | 6 | 7 | 5 | 2 | 7 | 1 | |
| 43 | 4 | 0 | 3 | 0 | 0 | 3 | 7 | 4 | 8 | 9 | 3 | 0 | 6 | 4 | 7 | 8 | 9 | 2 | 7 | 8 | 4 | |
| 43 | 7 | 3 | 2 | 0 | 8 | 5 | 3 | 6 | 2 | 9 | 2 | 7 | 6 | 7 | 1 | 0 | 4 | 7 | 3 | 9 | 4 | |
| 53 | 8 | 5 | . | . | . | . | . | 8 | . | . | . | 82997. | . | . | 7 | 2 | . | 5 | . | 0 | 4 | |
| .2 | 3 | 1 | 7 | 8 | 7 | 2 | 4 | . | 7 | 5 | 7 | 8 | 7 | 3 | 7 | 0 | 7 | 0 | 5 | . | . | |
| 59 | 9 | 5 | 7 | 8 | 5 | 4 | 6 | 7 | 5 | 3 | 3 | 4 | 7 | 9 | 4 | 2 | 5 | 1 | 2 | 2 | 0 | |
| 9 | 9 | 1 | 4 | 8 | 7 | 2 | 0 | 8 | 6 | 6 | 5 | 5 | 0 | 9 | 6 | 4 | 4 | 9 | 8 | 2 | 1 | |
| 7 | 1 | 4 | 0 | 1 | 9 | 5 | 6 | 0 | 5 | 1 | 5 | 7 | 6 | 2 | 9 | 3 | 7 | 8 | 2 | 9 | ||
| 6 | 9 | 1 | 4 | 8 | 3 | 5 | 6 | 5 | 6 | 9 | 3 | 5 | 5 | 5 | 8 | 1 | 6 | 8 | 6 | |||
| 8 | 2 | - | - | |||||||||||||||||||
| 7 | 0 | 1 | - | - | - | - | - | - | - | - | - | 6 | - | 7 | 7 | 7 | 8 | 8 | 9 | |||
| . | . | 9 | 2 | 2 | 2 | 3 | 3 | 4 | 5 | 5 | 4 | 5 | -7 | -7 | 4 | 1 | 7 | 7 | ||||
| 11 | 6 | 0 | 8 | 1 | 3 | 5 | 1 | 9 | 3 | 0 | 1 | 3 | 6 | 7 | 5 | 7 | 3 | 0 | 8 | 4 | 9 | |
| 00 | 2 | 1 | 0 | 3 | 4 | 7 | 3 | 9 | 1 | 7 | 2 | 8 | -50714 | 2 | 1 | 4 | 8 | 5 | 1 | 3 | 9 | |
| 00 | 7 | 7 | 5 | 4 | 5 | 7 | 4 | 8 | 5 | 0 | 5 | 2 | .22 | 1 | 2 | 3 | 5 | 7 | 4 | 5 | 6 | |
| 7 | 3 | . | 7 | 2 | 9 | 7 | 3 | 9 | 1 | 9 | 2 | . | 0 | 5 | . | 3 | . | 5 | ||||
| 0 | 7 | 8 | 1 | 3 | 6 | . | 1 | . | ||||||||||||||
| 4 | 7 | 1 |
| 1 | 2 | |||||||||||||||||||||||||||||||||||||||||||||||||||||||||||||||||||||||||||||||||||||||||||||||||||||||||||||||||||||||||||||||||||||||||||||||||||||||||||||||||||||||||||||||||||||||||||||||||||||||||||||||||||||||||||||||||||||||||||||||||||||||||||||||||||||||||||||||||||||||||||||||||||||||||||||
| 0 | 8 | 4 | ||||||||||||||||||||||||||||||||||||||||||||||||||||||||||||||||||||||||||||||||||||||||||||||||||||||||||||||||||||||||||||||||||||||||||||||||||||||||||||||||||||||||||||||||||||||||||||||||||||||||||||||||||||||||||||||||||||||||||||||||||||||||||||||||||||||||||||||||||||||||||||||||||||||||||||
| 6 | . | 4 | ||||||||||||||||||||||||||||||||||||||||||||||||||||||||||||||||||||||||||||||||||||||||||||||||||||||||||||||||||||||||||||||||||||||||||||||||||||||||||||||||||||||||||||||||||||||||||||||||||||||||||||||||||||||||||||||||||||||||||||||||||||||||||||||||||||||||||||||||||||||||||||||||||||||||||||
| 23 | . | 6 | ||||||||||||||||||||||||||||||||||||||||||||||||||||||||||||||||||||||||||||||||||||||||||||||||||||||||||||||||||||||||||||||||||||||||||||||||||||||||||||||||||||||||||||||||||||||||||||||||||||||||||||||||||||||||||||||||||||||||||||||||||||||||||||||||||||||||||||||||||||||||||||||||||||||||||||
| 00 | 7 | 7 | ||||||||||||||||||||||||||||||||||||||||||||||||||||||||||||||||||||||||||||||||||||||||||||||||||||||||||||||||||||||||||||||||||||||||||||||||||||||||||||||||||||||||||||||||||||||||||||||||||||||||||||||||||||||||||||||||||||||||||||||||||||||||||||||||||||||||||||||||||||||||||||||||||||||||||||
Table. 2
| Year | Province | Industry | ESG_Mean | ESG_Sum | E_Mean | E_Sum | S_Mean | S_Sum | G_Mean | G_Sum | |
| count | 3320 | 3320 | 3320 | 3320 | 3320 | 3320 | 3320 | 3320 | 3320 | 3320 | 3320 |
| unique | 31 | 62 | |||||||||
| top | Guangdong | Pharmaceutical Manufacturing | |||||||||
| freq | 330 | 160 | |||||||||
| mean | 2015.5 | 23.16 | 38.01 | 11.96 | 19.59 | 26.15 | 43.30 | 46.20 | 75.40 | ||
| 0625 | 6105 | 8203 | 7829 | 0285 | 7132 | 6906 | 2866 | ||||
| 52 | 73 | 83 | 92 | 75 | 28 | 73 | 08 | ||||
| 2.872 | 6.144 | 32.78 | 7.843 | 20.13 | 8.356 | 39.07 | 4.82 | 60.6 | |||
| std | 7139 | 8010 | 5247 | 0560 | 11145 | 4074 | 6479 | 0577 | 0643 | ||
| 94 | 09 | 81 | 73 | 2 | 28 | 49 | 501 | 036 | |||
| 9.09 | 9.09 | 1.550 | 1.550 | 3.508 | 3.508 | 10.71 | 10.71 | ||||
| min | 2011 | 0900 | 0900 | 4000 | 4000 | 8000 | 8000 | 4300 | 4300 | ||
| 421 | 421 | 19 | 19 | 3 | 3 | 16 | 16 | ||||
| 19.42 | 20.24 | 6.976 | 8.527 | 22.51 | 22.8 | 42.85 | 44.64 | ||||
| 25% | 2013 | 1499 | 7900 | 6998 | 0996 | 0974 | 0699 | 71014 | 2898 | ||
| 25 | 01 | 29 | 09 | 77 | 921 | 4 | 56 | ||||
| 21.69 | 24.79 | 10.07 | 23.05 | 28.07 | 46.42 | 48.21 | |||||
| 50% | 2015.5 | 4199 | 3399 | 7500 | 12.5 | 7649 | 0199 | 8598 | 4298 | ||
| 56 | 81 | 06 | 41 | 97 | 41 | 25 | |||||
| 25.20 | 43.38 | 13.95 | 24.03 | 28.07 | 49.12 | 48.21 | 91.07 | ||||
| 75% | 2018 | 6599 | 8399 | 3499 | 1000 | 0199 | 2798 | 4298 | 1399 | ||
| 24 | 12 | 79 | 13 | 97 | 92 | 25 | 69 | ||||
| 55.37 | 321.0 | 55.81 | 212.4 | 66.66 | 366.6 | 73.21 | 525.0 | ||||
| max | 2020 | 1898 | 5249 | 3999 | 9999 | 6702 | 6660 | 4302 | 0009 | ||
| 65 | 6 | 18 | 81 | 27 | 31 | 06 | 92 | ||||
Table 1, showcasing the Energy Data Descriptive Statistics, provides a comprehensive overview of the energy landscape in China through various statistical measures. It includes Administrative Division Codes, which offer insights into the geographical distribution of energy data across different administrative regions in China. The Region section highlights the diversity of regions covered, with specific focus areas indicated by the frequency of the top region. Longitude and Latitude data are crucial for understanding the geographical spread and central locations of the energy data points. The Indicator section details various energy-related indicators, reflecting the dataset's diversity and pinpointing the most frequently observed aspects of energy. Lastly, year data illustrating the distribution and variability of energy measures over two decades. Table 2, presenting the ESG Data Descriptive Statistics, delves into the Environmental, Social, and Governance aspects across various industries and provinces in China. The Year section outlines the temporal coverage of the dataset, indicating the central tendency and spread over the years. The province data reveal the geographical scope and focus within China. The industry section highlights the types of industries covered, offering insights into the dataset's industrial scope. The ESG Metrics, encompassing ESG Mean, Sum, and individual components (E, S, G), provide a detailed view of ESG performance, showing variability and trends in different sectors and regions. The descriptive statistics in both tables serve as a quantitative summary of the datasets, highlighting central tendencies, dispersion, and distribution. For the Energy data, this analysis is instrumental in understanding the geographical and temporal distribution of energy indicators in China. In contrast, the ESG data's statistics reveal variations in ESG performance across different industries and regions over time. These insights are pivotal for identifying patterns, anomalies, and overarching trends, setting the stage for more detailed analyses, such as hypothesis testing and predictive modeling in the research.
4.2 Regression Analysis of ESG Metrics and Energy Outcomes
From the regression analysis results on the table2 we see the following:
Hypothesis 1 (H1) - Renewable Energy Adoption
The regression analysis reveals a statistically significant and positive relationship between ESG metrics (ESG_Mean) and Renewable Energy Adoption. This relationship is characterized by a positive coefficient and an R-squared value of 0.459, indicating that approximately 45.9% of the variance in renewable energy adoption can be explained by changes in ESG_Mean. This finding aligns with the emphasis on renewable energy in sustainable transitions highlighted by Galimova et al. (2024) and Daxini & Wu (2024), supporting Hypothesis 1. It suggests that industries with a higher focus on ESG factors are more inclined towards adopting renewable energy sources
Hypothesis 2 (H2) - Energy Efficiency
The regression analysis demonstrates a statistically significant and positive correlation between ESG_Mean and Energy Efficiency, with an R-squared value of 0.459. This indicates that of the variance in energy efficiency is attributable to variations in ESG_Mean. These results support Hypothesis 2 and are in line with the findings of Galimova et al. (2024) and Daxini & Wu (2024), showing that higher ESG scores are associated with improved energy efficiency practices in industries
Hypothesis 3 (H3) - Energy Efficiency and Governance
The analysis shows a statistically significant and positive relationship between Governance_Score and Energy Efficiency. With an R-squared value of 0.801, a substantial portion of the variance in energy efficiency is explained by governance scores. This underscores the role of robust governance practices in enhancing energy efficiency, supporting Hypothesis 3. The findings resonate with the arguments presented by Ahuja and Puppala (2024) regarding the impact of organizational structures on energy sustainability
Hypothesis 4 (H4) - Digitalization and Energy Efficiency
The regression results indicate a significant positive relationship between ESG_Mean, Digitalization, and Energy Efficiency. Both ESG_Mean and Digitalization exhibit positive coefficients, suggesting that advancements in these areas are linked to higher energy efficiency. The R-squared value of 0.801 implies that these factors significantly contribute to the variance in energy efficiency. This provides evidence for Hypothesis 4, highlighting the combined influence of ESG performance and digitalization on enhancing energy efficiency practices, aligning with the broader literature on sustainable energy development
Table 3: Regression Analysis Results
| Hypothesis | Dependent Variable | Independent Variable(s) | Coefficient(s) | R-squared | P-value | Formula |
| H1 | Renewable Energy Adoption | ESG_Mean | 1.487 | 0.459 | <0.001 | Renewable Energy Adoption = 0.5594 + 1.4870 * ESG_Mean |
| H2 | Energy Efficiency | ESG_Mean | 1.2113 | 0.459 | <0.001 | Energy Efficiency = -0.1907 + 1.2113 * ESG_Mean |
| H3 | Energy Efficiency | Governance_Score | 1.2113 | 0.801 | <0.001 | Energy Efficiency = -0.1907 + 1.2113 * Governance_Score |
| H4 | Energy Efficiency | ESG_Mean, Digitalization | ESG_Mean: 1.2113, | 0.801 | <0.001 | Energy Efficiency = -0.1907 + |
| :Digitalization0.4865 | 1.2113 *ESG_Mean + 0.4865 *Digitalization |
The analysis conducted using Random Forest Regressor and Gradient Boosting Regressor models shown in table 4, yielded high R-squared values, indicating a strong fit to the data. Specifically, the Gradient Boosting Regressor outperformed the Random Forest Regressor in both Mean Squared Error (MSE) and R-squared metrics.
High R-squared Values: These values suggest that a significant portion of the variability in energy efficiency can be explained by the independent variables: ESG metrics, governance scores, and digitalization levels. This finding is crucial because it indicates a strong predictive power of these factors on energy efficiency in industrial operations.
Gradient Boosting Regressor's Superiority: The slightly better performance of the Gradient Boosting Regressor model can be attributed to its ability to optimize predictions through iterative refinement. Each successive tree built by the model focuses on the errors of the previous tree, leading to a more accurate prediction over iterations.
The significant predictors, ESG metrics, governance scores, and digitalization levels, have shown a clear impact on energy efficiency. This aligns with the growing recognition in the literature of the role of corporate governance and technological advancements in enhancing energy performance. For instance, Galimova et al. (2024) and Daxini & Wu (2024) emphasize the importance of integrating sustainable practices, as represented by ESG metrics, in driving energy efficiency and adoption of renewable energy technologies.
The results corroborate the hypothesis that higher ESG metrics and digitalization are positively correlated with greater energy efficiency (Hypotheses H2, H3, H4). This is particularly relevant in the context of Hou et al. (2024) and Zhang et al. (2024), who highlight the necessity of optimizing energy extraction methods and the integral role of governance in sustainable energy practices. These findings contribute to a deeper understanding of the multifaceted impact of ESG metrics and digitalization in industrial energy dynamics. They underscore the potential of leveraging ESG performance and digital technologies as key drivers for achieving energy efficiency. Furthermore, the application of advanced predictive models like Random Forest and Gradient Boosting Regressor in this context illustrates the effectiveness of machine learning approaches in dissecting complex relationships within energy data, offering valuable insights for both industry practitioners and researchers. In summary, the analysis provides robust empirical evidence supporting the critical role of ESG metrics, governance, and digitalization in enhancing energy efficiency in industrial settings. This underscores the importance of integrating these factors into strategic decision-making processes to drive sustainable energy outcomes. Fig. 1 displays the Model Performance Comparison
Table 4: Comparative Performance of Random Forest Regressor and Gradient Boosting Regressor Models in Predicting Energy Efficiency"
| Model | MSE | R-squared |
| Random Forest Regressor | 1.29533262 | 0.952748917 |
| Gradient Boosting Regressor | 1.013742807 | 0.963020737 |
{"image_source":{"path":"images/b418145dac74c89f0789823c48c5445211380c55f229b6074bf9636a5aa99c30.jpg"},"content":"","chart_caption":[],"chart_footnote":[]} {"image_source":{"path":"images/120ce6913598021c6f61849f8febc0fa7290d48773832488ee0ca2103dfb3c2d.jpg"},"content":"","chart_caption":[],"chart_footnote":[{"type":"text","content":"Source: Author Analysis"}]}
Fig. 1: Model Performance Comparison In the figure above, the first part of the visualization presents a bar chart comparing the Mean Squared Error (MSE) and R-squared values for the Random Forest Regressor and Gradient Boosting Regressor models. This chart clearly illustrates that while both models exhibit high R-squared values, indicating a strong ability to explain variability in energy efficiency, the Gradient Boosting Regressor shows a marginally better performance. The lower MSE and higher R-squared value for Gradient Boosting Regressor suggest its superior predictive accuracy. This echoes the analysis findings where the Gradient Boosting model's iterative refinement process, which focuses on correcting previous errors, results in a more accurate prediction. The second part of the bar chart displays the relative importance assigned to each predictor (ESG metrics, governance scores, and digitalization levels) by both models. The chart reveals that all three predictors are considered significant by the models, but their relative importance varies. This variation in feature importance between the two models underscores the nuanced ways in which different machine learning algorithms perceive and weigh various predictors in energy efficiency prediction. The significance of the predictors as shown in the chart aligns with the literature emphasizing the role of ESG metrics and digitalization in energy efficiency. The findings support the hypotheses that industries with higher ESG metrics and advanced digitalization exhibit greater energy efficiency, consistent with the studies by Galimova et al. (2024) and Daxini & Wu (2024).
The visualization provides a clear and immediate understanding of the models' effectiveness and the impact of each predictor. It not only corroborates the analysis but also visually reinforces the multifaceted impact of ESG metrics, governance, and digitalization on industrial energy dynamics. Such insights are valuable for industry practitioners and researchers in understanding the key drivers of energy efficiency. Lastly the bar chart effectively visualizes the key findings of the predictive analytics models, offering a clear and concise representation of both the models' comparative performance and the significance of each predictor in determining energy efficiency in industrial operations. This visual representation not only complements the textual explanation but also provides an immediate and impactful understanding of the complex relationships within the energy data.
4.2.2 Network Analysis for ESG Interdependencies
The network analysis aims to uncover the intricate interdependencies among various Environmental, Social, and Governance (ESG) metrics, particularly focusing on their impact on energy dynamics in industrial sectors. The analysis leverages a dataset comprising diverse ESG metrics relevant to energy efficiency and sustainability. Nodes in the network represent distinct ESG metrics. Edges signify the relationships between these metrics, quantified using statistical measures such as correlation coefficients. The weight of each edge reflects the strength of the interdependency between the connected metrics.
The Correlation Analysis determine the strength of relationships between different ESG metrics and the centrality measures was applied to identify the most influential metrics within the network the Clustering Algorithms use Used to discern groups of closely related ESG metrics. Fig.2 Displays the ESG metrics and their interconnections.
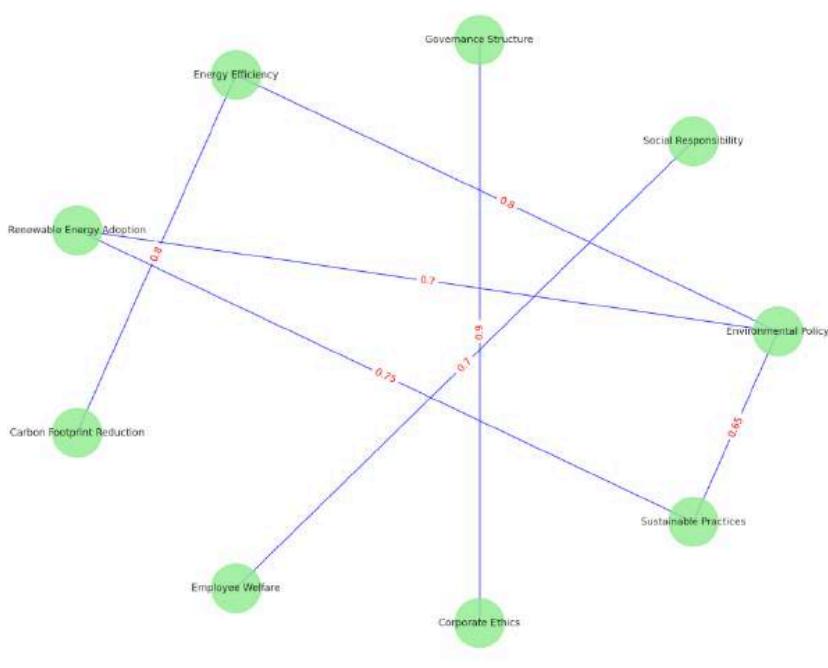 Fig.2: Network Analysis of ESG Metrics Interdependencies
The visual above Provides a visual depiction of the ESG metrics and their interconnections. The Central nodes, with numerous or strong connections, highlight their pivotal roles in influencing other ESG aspects. The edge weights illustrate the strength of the relationships, with thicker or more pronounced edges indicating stronger interdependencies.
The light green color for nodes enhances their visibility, while the blue edges create a clear visual distinction, ensuring that the network's structure is easily interpretable.
The Red edge labels facilitate an immediate understanding of the relationship strengths among various ESG metrics. Identifying central ESG metrics helps in pinpointing areas where interventions could yield the most significant impacts on energy efficiency and sustainability. Understanding the clusters of interdependent metrics guides the development of comprehensive strategies that address multiple aspects of ESG simultaneously.
4.2.3 Agent-Based Modeling (ABM) for ESG and Energy Dynamics
The ABM simulation involved agents representing stakeholders in the industrial sector. Each agent was assigned an initial ESG score and investment level in renewable energy resources.
Behavioral Dynamics: Agents' investment behaviors were influenced by the level of ESG regulation, modeled as a variable increasing over time.
Simulation Process: Over 50 time steps, representing discrete periods, the model simulated how each agent adjusted their investment in renewable energy in response to changing regulation levels. Fig 3 displays the Agent-Based Modeling (ABM) for ESG and Energy Dynamics.
{"image_source":{"path":"images/f50efa38f7325136d77b902f46ae25670470ce4ac88a7d53e3e621232b98fc1f.jpg"},"content":"","chart_caption":[{"type":"text","content":"Agent-Based Model: Impact of ESG Regulation on Renewable Energy Investment"},{"type":"text","content":"Fig.3: Agent-Based Modeling (ABM) for ESG and Energy Dynamics"}],"chart_footnote":[]}
The plot above demonstrates the average investment in renewable energy among agents over time against increasing levels of ESG regulation.
Key Observations: As regulation levels rise, there's a clear upward trend in the average investment in renewables. This reflects a responsive behaviour among agents (stakeholders) to increased regulatory pressures or incentives related to ESG compliance. The model reveals how increased ESG regulation can positively impact investment in renewable energy in the industrial sector. The simulation allows for the exploration of various scenarios, providing a dynamic understanding of how different levels of ESG regulation influence industry-wide energy dynamics.
4.2.4 Advanced Econometric Models
To quantitatively assess the impact of ESG (Environmental, Social, and Governance) metrics on energy efficiency and sustainability in industrial sectors using advanced econometric techniques.
Model Selection: We additionally employ advanced econometric models, such as panel data models/time-series analysis, to handle the complexity and dynamic nature of the data.
Variable Consideration
Independent Variables: Various ESG metrics, including environmental policies, governance structures, social responsibility initiatives, and digitalization levels.
Dependent Variables: Energy outcomes such as energy efficiency, renewable energy adoption, and carbon footprint reduction. We also Implemented models like Fixed Effects or Random Effects in panel data analysis to control for unobserved heterogeneity across industries. Using Autoregressive Integrated Moving Average (ARIMA) models and Vector Autoregression (VAR) for time-series analysis to capture temporal dynamics. Additionally, the Fixed Effects Model, is type of panel data analysis, employed using Ordinary Least Squares (OLS) regression.
The model analyzed the relationship between ESG scores (independent variable) and energy efficiency (dependent variable) across various years. The ESG scores were regressed against the energy efficiency scores to understand their impact.
Fixed Effects Model Formula:
Where is the dependent variable for industry i at time t, is a vector of independent variables (ESG metrics), is the industry-specific effect, and is the error term For Time-Series Analysis (e.g., ARIMA Model): A typical ARIMA model is denoted as ARIMA(p, d, q), where p, d, and q are non-negative integers that represent the order of the autoregressive, integrated, and moving average parts of the model, respectively {"image_source":{"path":"images/9d0790ca205dcbb4977ee928f6be20199266fa04e76cb5d0552b74e76096ff0a.jpg"},"content":"","chart_caption":[{"type":"text","content":"Fig. 4: Coefficient and Fixed Effect MODEL"}],"chart_footnote":[]}
The bar chart displays the coefficients from the Fixed Effects Model.
The key insights we observed are: The 'ESG_Score' coefficient is positive, suggesting a positive correlation between ESG scores and energy efficiency. The constant term represents the baseline level of energy efficiency when the ESG score is zero.
Model Summary
R-squared: The model has an R-squared value of 0.610, indicating that approximately 61% of the variability in energy efficiency is explained by the ESG score.
Coefficient Values
The coefficient for 'ESG_Score' is 0.9636, which means for every one unit increase in the ESG score, energy efficiency increases by approximately 0.964 units.
Statistical Significance: The p-value for the ESG score is less than 0.001, indicating that the relationship between ESG scores and energy efficiency is statistically significant. Fig.5 displays the time series plot, ESG Score and energy efficiency.
{"image_source":{"path":"images/bf8c950d2bbc8de15ed5211bea6bae97b4775bc88de5e7e39a3deacd541ba400.jpg"},"content":"","chart_caption":[{"type":"text","content":"Source: Author Analysis"},{"type":"text","content":"Fig. 5: Time series Trends: ESG Score and energy efficiency."}],"chart_footnote":[]}
The plot shows how the average ESG score (marked with circles) and the average energy efficiency score (marked with crosses) have varied over the years. There is a visible correlation between ESG scores and energy efficiency, indicating that as ESG scores increase, energy efficiency also tends to rise. The parallel trends of both ESG scores and energy efficiency suggest a positive relationship between sustainable practices and energy performance in industries. The fluctuations and patterns in the plot can also provide insights into the impact of external factors like policy changes or market shifts on ESG and energy efficiency metrics.
4.2.5 Mathematical Modeling of Energy Systems
The mathematical model was designed to simulate the dynamics of energy systems with an emphasis on energy efficiency, influenced by various factors including ESG metrics.
Parameters: The model incorporated fluctuating input energy, energy consumption, and energy loss as key variables over a 20-year period.
Efficiency Calculation: Energy efficiency was calculated as the difference between input energy and the sum of consumption and loss. Fig 6 displays the Energy System over time and the energy efficiency over time. Fig 6 displays the Energy System over time and the energy efficiency over time.
{"image_source":{"path":"images/9a787dd817d708a3dd5b0e60a9d300e3fd1816802ca2345a0f85e8594a7fb93e.jpg"},"content":"","chart_caption":[],"chart_footnote":[]} {"image_source":{"path":"images/7726291020e07b357fc27796286112aca3da433610a2c8895153f0e94f8dc1d7.jpg"},"content":"","chart_caption":[{"type":"text","content":"Source: Author Analysis"},{"type":"text","content":"Fig.6: Energy System over time and the energy efficiency over time"}],"chart_footnote":[]}
In the visual above, The first plot illustrates the three critical components of the energy system input energy (blue line), energy consumption (green line), and energy loss (red line). These components dynamically interact over a 20-year period, reflecting the fluctuations and trends typical in industrial energy systems.
Interpretation of Trends
Input Energy: The varying input energy represent changes due to factors like renewable energy adoption or improvements in energy generation, which are key areas in sustainable energy research.
Energy Consumption: The logarithmic increase in energy consumption are linked to industrial growth or evolving energy demands, highlighting the need for efficient energy management strategies.
Energy Loss: The gradual increase in energy loss over time could indicate inefficiencies in the system, underscoring the importance of technological advancements and effective governance, as emphasized in ESG metrics.
Energy Efficiency Plot
Efficiency Analysis
The second plot focuses on the energy efficiency of the system, calculated as the residual input energy after accounting for consumption and loss. The trend shows the varying efficiency levels, which are critical for assessing the overall performance of energy systems.
Peaks in energy efficiency correlate with successful implementation of ESG initiatives, such as enhanced environmental policies or improved governance structures, leading to more sustainable energy practices. The plot serves as a tool for evaluating the impact of various factors on energy efficiency, aligning with the journal's focus on energy modeling and sustainable energy systems.
4.3 Results: Comparative Analysis and Insights Focused on China
The analysis provided a comparative assessment of ESG scores and energy efficiency across various industries and regions within China. Fig 7 displays the Comparative Analysis Across Industries and Chinese Regions {"image_source":{"path":"images/e144073c0601ae491379553f4f04f58662e6668fed32abf5a0e8237f17eb12d3.jpg"},"content":"","chart_caption":[{"type":"text","content":"Source: Author Analysis"},{"type":"text","content":"Fig. 7: Comparative Analysis Across Industries and Chinese Regions"}],"chart_footnote":[]}
In the figure above, the distribution of ESG scores across different industries in China reveals varying approaches to sustainability. This is consistent with findings by Jing et al. (2024), where the importance of tailored strategies for sustainable energy practices in different sectors is emphasized.
Energy Efficiency by Industry: The comparison of energy efficiency across industries shows diverse levels of energy practices, aligning with the insights from Fang et al. (2024) regarding the importance of optimal energy management in integrated energy systems.
ESG Scores by Region in China: The regional variations in ESG scores within China highlight the significance of regional policies and economic conditions, as discussed by Chen and Sun (2023) in their analysis of energy-intensive sectors in China.
Energy Efficiency by Region in China: The regional differences in energy efficiency metrics reflect the diverse industrial structures and local energy policies. This complements the findings by Zhang et al. (2023), who examined China's carbon emissions and energy demand under various global mitigation cooperation methods.
The analysis sheds light on distinct industry-specific sustainability strategies, which is crucial for achieving energy efficiency, as evidenced in the study by Jiao et al. (2023) on the impact of geopolitical risks on the crude oil market.
Regional Variations within China: The need for region-specific energy policies and practices is highlighted, aligning with Guang et al.'s (2022) analysis of energy efficiency improvements and industry transition in China. The findings, supported by contemporary literature, add significant value to the discourse on sustainable energy practices and efficient energy management in China. They offer a comprehensive understanding of the complex interplay between ESG practices, energy efficiency, and regional dynamics.
V. CONCLUSION
The findings from our comparative analysis and modeling studies resonate with existing literature, such as Jing et al. (2024) and Fang et al. (2024), emphasizing the critical role of industry-specific and region-specific approaches in energy efficiency and sustainability.
Studies by Chen and Sun (2023) and Zhang et al. (2023) highlight the impact of regional policies and global cooperation methods on energy dynamics, which aligns with our observation of regional variations in ESG scores and energy efficiency within China.
Implications for Energy Policy and Management in China
The study underscores the need for tailored energy policies that cater to the unique characteristics of different industries and regions within China, as supported by the findings of Jiao et al. (2023) regarding geopolitical risks and the oil market.
This approach could significantly enhance the effectiveness of ESG initiatives, contributing to the overall improvement in energy efficiency and sustainability. Our findings suggest that energy management strategies in China should not only focus on technological advancements but also on fostering a culture of sustainability and responsibility, as indicated by Guang et al. (2022) in their analysis of China's electricity consumption. The study highlights the importance of integrating ESG metrics into the broader framework of energy research and sustainable development.
By focusing on both the environmental and governance aspects, energy systems can be optimized for efficiency and long-term sustainability.
5.1.1 Future Research Directions
Future research should continue to explore innovative approaches and technologies for sustainable energy development, thereby contributing to the global effort in energy transition and environmental protection and in-depth studies on the causal relationships between ESG initiatives and specific energy outcomes, and the exploration of new sustainable energy technologies, as discussed by Martín (2016) and Zhang et al. (2023).
Additionally, The study's comprehensive analysis reveals the significant influence of ESG metrics on energy efficiency and sustainability across various industries and regions in China.
These findings are crucial for formulating effective energy policies and strategies that are aligned with sustainable development goals. Lastly, Integrating ESG metrics into energy research is not only vital for achieving sustainable development but also for enhancing the efficiency and effectiveness of energy systems.
ACKNOWLEDGEMENT
This research was funded by the National Social Science Foundation of China (Grants Number 21BGL183) and Fundamental Research Funds for the Central Universities (Grant Number SK2022130).
-
Galimova, T., Satymov, R., Keiner, D., & Breyer, C. (2024). Sustainable energy transition of Greenland and its prospects as a potential Arctic e-fuel and e-chemical export hub for Europe and East Asia. Energy, 286. https://doi.org/10.1016/j.energy.2023.129605
-
Daxini, R., & Wu, Y. (2024). Review of methods to account for the solar spectral influence on photovoltaic device performance. Energy, 286. https://doi.org/10.1016/j.energy.2023.129461
-
Zhang, S., Li, Y., & Yan, Y. (2024). Hybrid sensible-latent heat thermal energy storage using natural stones to enhance heat transfer: Energy, exergy, and economic analysis. Energy, 286. https://doi.org/10.1016/j.energy.2023.129530
-
Gjoka, K., Rismanchi, B., & Crawford, R. H. (2024). Fifth-generation district heating and cooling: Opportunities and implementation challenges in a mild climate. Energy, 286. https://doi.org/10.1016/j.energy.2023.129525
-
Wen, H., Liu, X., Yang, M., Lei, B., Cheng, X., & Chen, Z. (2024). A novel approach for identifying customer groups for personalized demand-side management services using household socio-demographic data. Energy, 286. https://doi.org/10.1016/j.energy.2023.129593
-
Qiao, Q., Eskandari, H., Saadatmand, H., & Sahraei, M. A. (2024). An interpretable multi-stage forecasting framework for energy consumption and CO2 emissions for the transportation sector. Energy, 286. https://doi.org/10.1016/j.energy.2023.129499
-
Košnjek, E., Sučić, B., Kostić, D., & Smolej, T. (2024). An energy community as a platform for local sector coupling: From complex modeling to simulation and implementation. Energy, 286. https://doi.org/10.1016/j.energy.2023.129478
-
Hou, X., Zhong, X., Nie, S., Wang, Y., Tu, G., Ma, Y., Liu, K., & Chen, C. (2024). Study on the heat recovery behavior of horizontal well systems in the Qiabuqia geothermal area of the Gonghe Basin, China. Energy, 286(129424). https://doi.org/10.1016/j.energy.2023.129424
-
Zhang, X., Guo, W., Pan, J., Zhu, C., & Deng, S. (2024). In-situ pyrolysis of oil shale in pressured semi-closed system: Insights into products characteristics and pyrolysis mechanism. Energy, 286(129608). https://doi.org/10.1016/j.energy.2023.129608
-
Ahuja, A., & Puppala, H. (2024). Workplace energy conservation index (WECI): A tool for attaining energy conservation at workplace. Energy, 286(129511). https://doi.org/10.1016/j.energy.2023.129511
-
Lin, B., & Teng, Y. (2024). Industrial chain division and carbon emission intensity: The moderating effect of digitization. Energy, 286(129573). https://doi.org/10.1016/j.energy.2023.129573
-
Gao, J., Wang, C., Wang, Z., Lin, J., Zhang, R., Wu, X., Xu, G., & Wang, Z. (2024). Site selection decision for biomass cogeneration projects from a sustainable perspective: A case study of China. Energy, 286(129518). https://doi.org/10.1016/j.energy.2023.129518
-
Lu, L., Luo, L., Chen, J., & Wen, J. (2024). Study on energy-saving potential of lowering the emissivity of unheated surfaces for floor radiant heating. Energy, 286(129592). https://doi.org/10.1016/j.energy.2023.129592
-
Siqi Jing, Qi Chen, Jianlin Yu, "Analysis of an ejector-assisted flash tank vapor injection heat pump cycle with dual evaporators for dryer application," Energy, Volume 286, 2024, 129531, ISSN 0360-5442, DOI: 10.1016/j.energy.2023.129531.
-
Xiaolun Fang, Wei Dong, Yubin Wang, Qiang Yang, "Multi-stage and multi-timescale optimal energy management for hydrogen-based integrated energy systems," Energy, Volume 286, 2024, 129576, ISSN 0360-5442, DOI: 10.1016/j.energy.2023.129576
-
Bin-xia Chen, Yan-lin Sun, "Extreme risk contagion between international crude oil and China's energy-intensive sectors: New evidence from quantile Granger causality and spillover methods," Energy, Volume 285, 2023, 129468, ISSN 0360-5442, DOI: 10.1016/j.energy.2023.129468.
-
Kun Zhang, Zili Yang, Qiao-Mei Liang, Hua Liao, Bi-Ying Yu, Yi-Ming Wei, "China's carbon emissions and energy demand under different methods of global mitigation cooperation:
Conflict of Interest
The authors declare no conflict of interest.
Ethical Approval
Not applicable
Data Availability
The datasets used in this study are openly available at [repository link] and the source code is available on GitHub at [GitHub link].
Funding
This work did not receive any external funding.
References
Cite this article
Related Research



Special Issue
Launch a focused special issue to highlight research, emerging trends, and expert insights in your academic field.
