

IntelliPaper
Abstract
Brazil is one of the world's largest producers of guava. The estimated production is approximately 552,393 tons/year. Most guava production is processed to manufacture juices, nectars, pulps, and ice creams. During the processing of guava, about 40% of the waste from the processing of guava consists of seeds, whose disposal causes environmental problems. Within this context, this work aimed to develop encapsulating material from guava seed flour and to study the kinetics, equilibrium, and thermodynamics involved in the microencapsulation process. Initially, the characterization of the guava seeds (carbohydrates, proteins, fibers, and ashes) was carried out, then the seed yield was calculated. After the characterization, the seed yield was calculated, and these were used to prepare dry and defatted flour. This flour was characterized in terms of solubility, hygroscopicity, bed and compacted density, wettability, morphology, zero load point, and thermal analysis. The experimental parameters of the adsorption process were previously optimized. The adsorption capacity was evaluated in a batch system under a controlled temperature of 25 ± 2°C. From the results obtained, it is possible to infer that the dry and defatted seed flour presented the potential for the proposed purpose, with a high capacity to incorporate the methylene blue dye (~83%). The experimental results showed that the pseudo-second-order model better described the adsorption kinetics. Finally, thermodynamic results analysis revealed a spontaneous adsorption process (∆G°= -44.10 kJ mol-1), exothermic (∆H° = -22.47 kJ mol-1), and with ∆S° = -73 .62 J mol-1 K-1, which shows small changes in randomness at the solute-adsorbent interface during adsorption.
Explore Digital Article Text
σ C ∅ v Θ: Federal de Educação/ Ciência e Tecnologia do Espírito Santo – Campus de Alegre, BR 482, Rodovia Cachoeiro/Alegre, Km 47, Distrito de Rive - 29520-000 - Alegre-ES, Brasil.
I. INTRODUCTION
The Psidium guajava L. guava is a tropical fruit characterized by a low content of carbohydrates, fats, and proteins and a high content of vitamin C (more than 100 mg/100 g of fruit) and fiber content (2.8-5.5 g/100 g of fruit) [1]. In addition to its nutritional properties, this fruit is very appetizing due to its sensory properties (taste and color) [2-3-4]. Brazil is among the largest guava producers, and guava plantations are concentrated in the Northeast and Southeast regions. Production in the country reached 552,393 tons in 2021 [5], but the commercialization of the fruit is still national.
Although the fruit is consumed in nature, most guava production is processed to manufacture juices, nectars, pulps, ice creams, jellies and jams, ingredients for preparing yogurts, jellies, and recently, the bittersweet guatchup sauce .
During the processing stages, there is a large generation of tailings mainly composed of seeds. When improperly disposed of, these tailings can cause environmental damage and consequently become a problem of significant impact on the environment and agro-industries .
The waste resulting from the processing of guava is a food with great potential to compose diets for production animals and food for human consumption, as it has already been used in the formulation of guava seed flour for the elaboration of bread . These seeds are predominantly composed of cellulose, lignin, and lignan, which have favorable characteristics for the development of encapsulating materials, in addition to presenting biodegradability, biocompatibility, and low toxicity . When used as an adsorbent or encapsulating agent, guava seed flour may have promising characteristics. However, using the microencapsulation process can solve many problems, such as increasing the stability, bioavailability, and efficiency of the action of various natural products .
Most encapsulating materials are polymers of plant origin due to their biodegradability, biocompatibility, and low toxicity properties . These polymers can be prepared from abundant and cheap agro-industrial waste, such as seeds, peels, and fruit pomace . However, the literature lacks information on this agricultural waste, from the processing of guava to preparing wall material to be used in encapsulating systems, making it possible to carry out studies to identify the potential of dry flour and defatted guava seed.
Thereby the potential of developing an innovative and technological product from low-cost and abundant agricultural waste, the present study aims to prepare to encapsulate material from the dry and defatted flour of guava seeds from agro-industrial waste.
II. EXPERIMENTAL
2.1 Guava Material
The guava waste was acquired at the fruit pulp production unit (PapaFruta®), located in the municipality of Mimoso do Sul, in the southern region of Espírito Santo, and was immediately transported in a thermal box to the Ifes Applied Chemical Laboratory - Campus Alegre. The guava seeds were separated from the residue by mechanical friction via wet and subsequently dehydrated. Their yield and proximate characterization were determined (moisture, mineral content, carbohydrates, proteins, lipids, and fibers). The material was washed with running water and subjected to sun drying for 8 hours; then, they were separated from the rest of the residue and placed in a forced air circulation oven at for 48 hours.
2.2 Preparation of Dry and Degreased Guava Seed Flour (FSDSG)
The guava seeds were ground in a Willey Marconi® knife mill, MAO 48, with a sieve of 2.0 mm opening and subsequently subjected to granulometric selection in a stainless-steel sieve at 80 Mesh. The flour produced was subjected to lipid extraction in a Soxhlet system (DiogoLab) for 6 hours, using hexane as a solvent. FSDSG was suspended in aqueous HCl solution at a concentration of 0.1 mol L , using a 5:1 ratio, and kept under stirring at 1000 Rpm for 3 hours at 25 ± 1°C. Then the material was subjected to quantitative filtration for 24 hours and dried in an oven at 105°C for 1 hour.
2.3 Yield and Properties of FSDSG
FSDSG yield was determined by mass difference, and solubility was calculated according to the method described by Cano-Chauca et al. (2005). Wettability was determined according to the method described by Fuchs et al. (2006). Hygroscopicity was estimated according to the methodology of Cai and Corke (2000). Bed density was conducted following the methods proposed by Jinapong., Suphantharika., Jamnong (2008), and Goula and Adamopoulos (2012) with adaptations. Moisture, ash, protein, lipid, and fiber contents were determined by standard methodologies proposed by the ASSOCIATION OF OFFICIAL ANALYTICAL CHEMISTS (CUNNIFF-AOAC, 1995). The gravimetric method determined the moisture content by drying in an oven at C (QUIMIS®) until constant weight and mineral matter were obtained by incinerating the material in a muffle furnace at C (QUIMIS®) for five hours. Total nitrogen was determined by the Kjeldahl method and converted into crude protein by the factor 6.25 [15]. Total lipids were determined according to the Soxhlet method using petroleum ether as the solvent and crude fiber according to the Weende method [16]. The carbohydrate content was obtained by the difference . The caloric value of the seeds was estimated using the conversion factor of 4 kcal g for protein and carbohydrate and 9 kcal g for lipids [17]. All assays were performed in triplicate.
2.3.1 Scanning Electron Microscope (SEM)
Morphological analysis of the degreased guava seed was performed on an energy dispersive X-ray spectrometer (EDS) coupled to a scanning electron microscope (SEM) using a JEOL JSM 6010LA SEM. The material had to go through the metallization step, being coated with Au, as it is not a conductor. All images and EDS spectrum were acquired using an acceleration voltage of 20kV and 10 mm working distance. The EDS detector window was beryllium.
2.3.2 InfraRed
The spectra were obtained in the infrared region by Fourier transform coupled with the attenuated total reflectance technique (FTIR-ATR) for products derived from guava seed and were acquired in the spectral range from 400 to 4000 cm in the Varian 660-IR equipment.
2.3.3 Structural Property
As isotermas de adsorção/dessorção de nitrogênio foram medidas em um aparelho NOVA 1200 da Quantachrome, usando o degaseificador a vácuo a 80°C por 5h. A área superficial usando o método Brunauer-Emmett-Teller (BET) foi determinada a partir de Multi Point BET. A distribuição do tamanho de poro e do volume de poro foi obtida a partir da Teoria da Densidade Funcional (DFT), que é baseada na modelagem molecular e leva em consideração a interação direta do adsorbato com a superfície adsorvente.
2.3.4 Thermogravimetric Analysis
Nitrogen adsorption/desorption isotherms were measured on a NOVA 1200 instrument from Quantachrome, using a vacuum degasser at C for 5h. The surface area using the Brunauer-Emmett-Teller (BET) method was determined from MultiPoint BET. The pore size and pore volume distribution were obtained from the Density Functional Theory (DFT), which is based on molecular modeling and considers the direct interaction of the adsorbate with the adsorbent surface.
2.3.5 Ponto de Carga Zero
The measurement of pH at zero load point (pHPCZ) was performed based on the method proposed by Mall et al. (2006), which consisted of adding 100 mg of FSDSG in Erlenmeyer containing 50 mL of distilled water with the pH values adjusted between 2.0 and 11.0 through solutions of hydrochloric acid (HCl) and sodium hydroxide (NaOH). The suspensions were kept under constant agitation at 200 rpm for 24 hours at 25°C. The initial and final pH values were measured with a pH meter (MS TECNOPON, Mpa-210). The pHPCZ was measured through the first derivative ( pH/initial pH) of the pH behavior curve and assigned to the point where the sums of the charges tend to zero. This procedure was performed in triplicate.
2.4 Adsorption
Methylene blue cationic dye (B. Herzog, Germany) was used as the adsorbate. The previously optimized parameters were used: mass of FSDSG 0.1 g, stirring speed = 200 rpm, and pH = 7.0. Four-milliliter aliquots were taken at predefined time intervals (10, 30, 60, 90, 120, 240, 360, and 480 min) and placed in Falcon tubes, later centrifuged (HERMLE) at 6000 rpm for five minutes. The supernatant was transferred to a quartz cuvette for reading in a UV-Vis spectrophotometer (Agilent, Cary 60 UV/Vis) at 664 nm, and then the aliquot was returned to the system. All assays were performed in triplicate. The amount of methylene blue (MB) adsorbed on the FSDSG, qe (mg g ), was calculated by Equation 1 [18-19].
Where and Ce (mg L ) are the initial and equilibrium liquid-phase concentrations of MB, respectively, V (L) is the volume of the solution, and W(g) is the mass of FSDSG used. The same procedure was followed in batch adsorption and kinetic studies, but the aqueous samples were collected at predefined time intervals. MB concentrations were similarly measured. The amount of MB adsorbed at any time, qt (mg g ), was similarly calculated by Equation 2 (Eq. 2) [18-19].
Where and Ce (mg L ) are the initial and equilibrium liquid-phase concentrations of MB, respectively, V (L) is the volume of the solution, and W (g) is the mass of FSDSG used. The same procedure was followed in batch adsorption and kinetic studies, but the aqueous samples were collected at predefined time intervals. MB concentrations were similarly measured. The amount of MB adsorbed at any time, qt (mg g ), was similarly calculated by Equation 2 [18-19].
2.5 Adsorption Isotherm and Kinetic Models
The application of adsorption isotherms is very useful in describing the interaction between the adsorbate and the adsorbent of any system. The parameters obtained from the different models provide important information about the sorption mechanisms. For example, there are various equations for analyzing experimental adsorption equilibrium data. The Langmuir and Freundlich models are the most widely used and accepted surface adsorption models for single-solute systems. On the other hand, an interesting trend in isothermal modeling is the derivation in more than one approach, thus leading to the difference in physical interpretation. In this study, the Langmuir and Freundlich isotherms were applied; table 1 shows the equations and parameters of such isotherms. Kinetic models such as pseudo-first-order , pseudo-second-order , and intraparticle diffusion model . were used to understand the adsorption dynamics concerning time for the MB-AC-3 system. The equation and parameters of these models are shown in Table 1.
| Models | Names | Expression |
| Isotherms | Langmuir | |
| Freundlich | ||
| kinetics | Pseudofirst order | |
| Pseudo Second Order | ||
intraparticle diffusion
Source: BEDIN, et al., 2018., CAZETTA et al., 2011
Langmuir's constant Ka; kf = and nF = Freundlich constants; K1 and K2 = Pseudo-first-order and pseudo-second-order constants; ho = initial adsorption; kid= intraparticle diffusion; C = intercession
Both the adsorption isotherms and the pseudo-first and pseudo-second-order kinetic models were fitted using the nonlinear fitting method, using the Origin 8.5 software. The adequate theoretical models that describe the experimental data of the system were chosen from the correlation coefficient ( ). In addition, the experimental data were evaluated by the chi-square ( ) model (Eq. 3) and by the values of normalized standard deviation ( ) (Eq.4) [19-20].
Where is the experimental adsorption capacity, calculated is the adsorption capacity calculated from the kinetic model and n is the number of treatments.
2.5 Thermodynamics
The effect of temperature on the adsorption of MB dye by FSDSG particles was investigated at concentrations of 60; 75, and 90 mg L with pH = 7.0, containing 0.1 g of FSDSG, stirring speed = 200 rpm; T = 30, 50, and 70°C kept constant through the use of an incubator bath with magnetic agitation (MARCONI/MA o85/CT). The duration of each trial was eight hours. The thermodynamic parameters of Gibbs free energy change ( , kJ mol ), enthalpy change ( , J mol ), and entropy change ( , J mol K ) were calculated from equations 5 and 6 [24-25], Ke is the dimensionless constant obtained from the qe/Ce ratio defined through Equation 5 (Eq. 5), R is the universal gas constant (8.314 J mol K ), and T is the temperature in Kelvin.
R is the universal constant of ideal gases, whose value is , and T is the temperature in Kelvin.
The values of and can be determined experimentally. For example, the graph of ln Ke versus 1/T generates a line, and the slope is - , and the linear coefficient corresponds to . With the values of and calculated, it is possible to calculate the Gibbs free energy ( ) value for a given temperature through Equation 6 (Eq.6).
III. RESULTS AND DISCUSSION
3.1 General Characteristics and Properties of FSDSG
The encapsulating material developed is of vegetable origin and was obtained from the dried and degreased guava seed. Visually, the product appeared in the form of a fine, loose powder with light cappuccino brown colors. The results regarding the proximate composition, seed yield obtained based on the raw guava waste, properties of the dry and defatted flour of guava seeds, and the yield after standardization of granulometry at 80 mesh are presented Table 2.
| Centesimal Composition of Guava Seeds and Yield | |
| seed yield% (m m-1) | 48.11 ± 0.30 |
| Fiber% (m m-1) | 58.15 ± 1.32 |
| carbohydrates% (m m-1) | 18.7 ± 1.0 |
| lipids% (m m-1) | 10.82 ± 0.20 |
| proteins% (m m-1) | 8.71 ± 0.30 |
| energy content (kcal 100g-1) | 206.2 ± 5.4 |
| FSDSG Properties and Yield | |
| FSDSG Yield% (m m-1) | 34.42 ± 0.14 |
| Solubility% (m m-1) | 1.95 ± 0.54 |
| Wetability (min)* | 10.13 ± 0.02 |
| hygroscopicity (g água 100g-1) | 7.33 ± 1.10 |
| bed density (g cm-3) | 0.29 ± 0.05 |
| compacted density (g cm-3) | 0.46 ± 0.04 |
3.2 Characterization of the Encapsulating Material
3.2.1 Morphology by Analysis of Energy Dispersive X-ray Spectroscopy Coupled to SEM.
Energy dispersive X-ray spectroscopy provides information on the chemical composition of the
Buoyancy and submersion time in minutes
elements in the sample. Figure 1 and Table 3 show the relative spectrum and atomic composition of the encapsulating material, respectively, obtained from guava seed, while Figure 2 shows images representing the material's morphology at different scales.
{"image_source":{"path":"images/ac97e427a1de5943690a4e431668a78bf8650b1a9f090b17bf4fac20d806683b.jpg"},"content":"","chart_caption":[{"type":"text","content":"Fig. 1: EDS Spectrum of the Encapsulating Material"}],"chart_footnote":[]}
| Elements detected | Mass(%) | atom |
| C | 60,79 | 67,37 |
| O | 39,21 | 32,63 |
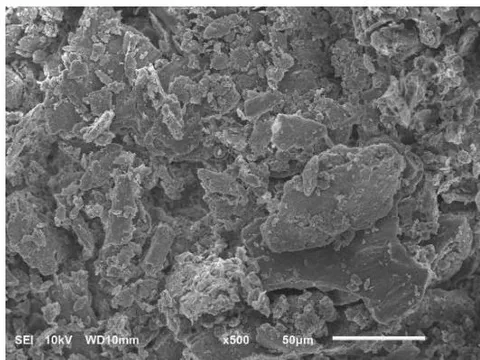
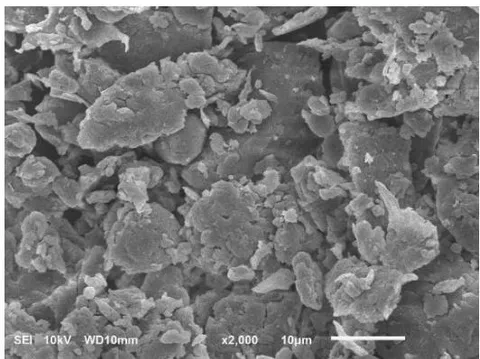
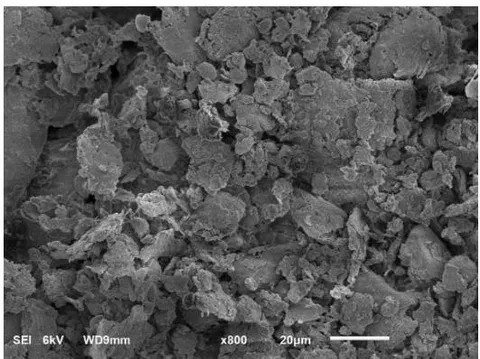
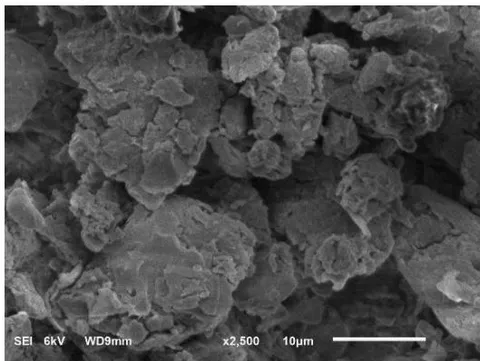
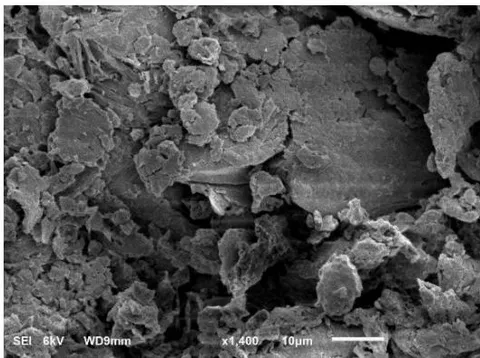
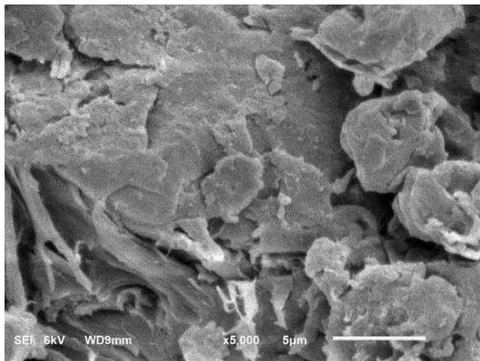
The SEM images at different scales show that the particles of the encapsulating material developed from degreased guava seeds have geometrically irregular surfaces. This characteristic may favor the process of microencapsulation of other materials in their structure.
3.4 Spectroscopy in the Infrared Region
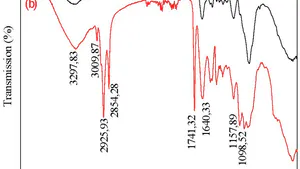
Analyzing the presence of functional groups in the raw material before and after going through the lipid extraction process indicates whether there was complete removal of the lipid fraction present in the encapsulating material developed (FSDSG), whose spectra were obtained in the infrared region and are represented in Figure 3.
{"image_source":{"path":"images/b8360d880b0cdfe3480dc27ba7df785058c7c17878a3a802f33698f82c629a0a.jpg"},"content":"","chart_caption":[{"type":"text","content":"Fig. 3: Spectroscopy in the Infrared Region: (a) Dry and Defatted Guava Seed Flour (encapsulating material), (b) Dry Guava Seed Flour"}],"chart_footnote":[]}
It is possible to observe in Figure 3(a) that the spectrum of the encapsulating material obtained after the process of removing lipid compounds, has a spectral profile different from that of spectrum 3(b), which represents the guava seed just dry, still with lipid content gift. The spectra have bands in common, highlighting the band present at due to the stretching of the -OH bond. At , a band appears that can be attributed to the stretching of the N-H bond associated with amide and is consistent with the band present at , characteristic of the amide carbonyl group, which is also common in encapsulating material developed, but it is present to a lesser extent. When analyzing spectrum 3(b), there are two bands at 2925.93 and , which are attributed to stretching of C-H bonds with hybridization due to symmetrical and asymmetrical vibrations of the C-H bond. The intense and narrow band present at is typical of carbonyl stretching (C=O) as described by Pavia et al.
(2010), which was consistent with the presence of fatty acid ester present in guava seed, observed in the spectrum (b), this is the most important in the analysis performed, as it is absent in the encapsulating material, which had the acid content removed, indicating that the material had the lipid fraction successfully removed. The bands in 1157.89 and 1098.52 cm can be attributed to the stretching of C-O bonds.
3.5 Propriedade Estrutural
Determining the textural properties of encapsulating material is of great value for the knowledge of its characteristics, as it provides essential information about the material, such as surface area, volume, and pore size, data displayed in Table 4 for the material developed. The adsorption/desorption isotherms are represented in Figure 4.
{"image_source":{"path":"images/5b2787c8c270c25ea7da96ded216d58f1c329b1a635d44dcd69d214469355f59.jpg"},"content":"","chart_caption":[{"type":"text","content":"Fig. 4: Isotermas de adsorção/dessorção de "},{"type":"equation_inline","content":"N_{2}"},{"type":"text","content":" da amostra FSDSG"}],"chart_footnote":[]}
| FSDSG | Surface area (multiPoint ) ( ) | pore volume ( )* | pore size (nm)* |
| 5.401 | 5.438 |
Depending on the pore size of a material, it can be classified as macro, meso, or microporous. If the pore diameter exceeds 50 nm, it characterizes a macroporous solid, if the pore size is between 2 and 50 nm, it is characteristic of a mesoporous solid, and if the size is less than 2 nm, it is considered a microporous solid, which subdivided into solid ultra-micropores (pore diameter <0.7 nm), medium-sized micropores (0.7 nm < pore diameter <0.9 nm) and supermicropores (pore diameter >0.9 nm) [25-26]. After analyzing the results obtained in the texture analysis, it was possible to infer that the encapsulating material (FSDSG) is a mesoporous solid due to its pore size of 5.438 nm. The pore size of the material is interesting, as materials with a minimal pore size can make it difficult to encapsulate other materials in their available sites since the material to be encapsulated must be able to access the pore that the encapsulating material does. Following the classification described by the IUPAC, the adsorption/desorption isotherms have six distinct classifications. Thommes et al. (2015) describe that each isotherm characterizes a solid as a function of the pore size of the adsorption phenomenon. Type I isotherms are typical of microporous solids; types II and IV are characteristics of non-porous solids and macroporous solids, respectively. Types III and V isotherms are typical of systems where the adsorbate molecules interact more with each other than with the solid; finally, type VI isotherms occur with the adsorption of a gas by a non-porous solid with a uniform surface, which is a rarer phenomenon. The FSDSG adsorption/desorption isotherms obtained for the material developed here are shown in Figure 4.
Due to the shape of the isotherm obtained for FSDAG, it can be inferred that the isotherm has a type IV isotherm characteristic, as Figure 4 shows a small hysteresis, which characterizes a mesoporous solid, information that corroborates the data obtained in the associated texture analysis and pore size.
3.5 Thermogravimetric Analysis
The thermogravimetric analysis was performed based on pre-defined atmospheric and temperature conditions and allowed the assessment of the material's thermal stability. This technique makes it possible to know the changes that heating can cause in the mass of substances, allowing us to establish the temperature range in which they acquire a fixed, defined, and constant chemical composition, the temperature at which they begin to decompose, and to monitor the progress of dehydration reactions (moisture loss), oxidation, combustion, and decomposition . The result of the thermal analysis of the encapsulating material (FSDSG) obtained from defatted guava seeds is represented in Figure 5, where the mass loss curves (TG) and the mass loss curve derivative (DTG) are exposed.
{"image_source":{"path":"images/9f018a2f0293a054714b261090bb87f1ada7f089a8190c944d1fadd924c43f64.jpg"},"content":"","chart_caption":[{"type":"text","content":"Fig. 5: Mass Loss Curve (TG) and the Derivative of Mass Loss Curve (DTG)"}],"chart_footnote":[]}
Looking at Figure 5, the mass loss curve of FSDSG showed a mass loss of approximately 8% during the temperature variation from C to C, resulting from the loss of residual water from the sample. However, the significant mass loss occurred between C and C. Through the DTG curve, it was possible to determine the temperature at which the maximum mass change rate (decomposition) is around C, indicating that the material is thermally stable up to a temperature of .
It is essential to know the thermal stability of material under development, as it makes it possible to predict its applications in several areas. For example, when referring to HTST (High-Temperature Short Time), heat treatment processes combine heat, humidity, and mechanical work, profoundly modify the raw materials and provide new formats and structures with different functional and nutritional characteristics . Among these materials industrialization processes, we can highlight the extrusion process, which has been widely used in the last decades in the food industries due to its numerous advantages such as versatility, continuous production on a large scale, and per unit area low cost. With investment, labor, and energy, the quality of products with better functional, sensory, and nutritional characteristics is a process that does not generate effluents .
Aiming at the possible use of FSDSG as an encapsulating material, it is possible to carry out microencapsulation tests up to a temperature close to C, above this value. The material begins the process of degradation of its chemical composition.
3.6 Point of Zero Charge
The point of zero charges (pHpcz) is one of the essential characteristics of the surface of adsorbent material, as it corresponds to the pH value of the liquid surrounding the material when the sum of the positive charges is equivalent to the sum of the negative charges on the surface. The value characterizes the acidity of the material's surface [30-31]. Thus, in an aqueous medium, the particles have a positive surface charge if the pH of the solution is lower than the and a negative surface charge if the pH of the solution is higher than the [32]. The results referring to the determination of the of the FSDSG are shown in Figure 6.
{"image_source":{"path":"images/de5e09fefaeca80def47ccb310ea1c2ba776e61c19f61841e3da402c8d76e66b.jpg"},"content":"","chart_caption":[{"type":"text","content":"Fig. 6: Determination of pH at Zero Load point of Dry and Defatted Guava Seed Flour at 80 Mesh"}],"chart_footnote":[]} To understands the adsorption mechanism, is necessary to determine the pHPCZ. The adsorption of cationic dyes is favored at pH higher than pHPCZ, while the adsorption of anionic dyes is favored at pH lower than pHPCZ [33]. Thus, according to Figure 6, the pHPCZ FSDSG is equivalent to 2.0 and 11.0. In the pH range below 2.0 and above 11.00, the surface charges of the material are predominantly negative. Adsorption, for example, essential (nonpolar) oils, may be preferable at these pH values. Above 2.0 and below 11.00, its surface predominates positive charge, favoring polar molecules' adsorption.
The Langmuir isotherm was obtained through the correlation between Ce/qe as a function of Ce. The values of kL and qm were determined, respectively, from the linear and angular coefficients of the equation obtained by the linear regression of the line, allowed assessing whether the adsorption process is favorable (Table 5).
| Parameter | Value |
| (mg g ) | 57,95 |
| (L mg ) | 8,9645 |
| 0,0037 – 0,0012 | |
| adjusted | 0,9613 |
Analyzing the Langmuir isotherm data, it is evident that the adsorption process fits this model well since the adjusted value is 0.9613, and the RL values, whose range is between zero and one, indicate that adsorption is favorable [34]. The value of the maximum adsorption capacity, qmax (mg g ), is essential to identify the adsorbent with the highest adsorption capacity [35]. The value of qmax depends on several factors, such as the adsorbent's characteristics and mass and the adsorbate's volume and concentration. The
FSDSG microparticles used in this study showed a promising MB incorporation capacity, showing that they are suitable for incorporating active principles.
The Freundlich isotherm was obtained by correlating ln qe as a function of ln Ce. The kf 1/n values were determined by the linear and angular coefficients of the equation obtained by the linear regression of the line. These parameters and the adjusted value are represented in Table 6.
| Parameter | Value |
| (L mg ) | 1,0155 |
| 0,5679 | |
| 1,7609 | |
| R adjusted | 1,0000 |
Analyzing the data found for this model, it is evident that it has an adjusted value above 0.9999. Thus, the experimental data fit well to this model, which considers the adsorbent constituted of multiple layers and is applicable for reversible adsorption on heterogeneous surfaces, with available sites with different adsorption energies [36].
The value of 1/n less than 1.0 indicates that the adsorption applies to the range of MB concentrations evaluated in this study and reveals that the adsorption occurs by heterogeneous means, with the high-energy sites being occupied first. Then adsorption occurs at lower-energy sites . The value of n greater than 1.0 shows that the process of adsorption of MB by the FSDSG microparticles was favorable.
3.8 Adsorption Studies
The results for the pseudo-first-order kinetic model were obtained through the linearized Lagergren equation, through the construction of a graph of as a function of time for each value of the initial concentration of MB. The values corresponding to qe for the linearized Lagergren equation were those obtained experimentally (qe exp). The parameters calculated qe (qe calc) and k1 were determined from the linear and angular coefficients of the equations formed by the regression of as a function of time. These parameters and the values of the correlation coefficient ( ) adjusted normalized standard deviation ( ), and the chi-square model ( ) are presented in Table 7.
| Initial Concentrations (mg L ) | |||||
| 30 | 45 | 60 | 75 | 90 | |
| (mg g ) | 13.84 | 19.80 | 26.02 | 32.12 | 37.48 |
| (mg g ) | 0.65 | 16.75 | 15.7 | 21.97 | 32.49 |
| K (min ) | -0.0001 | -0.0039 | -0.0019 | -0.0024 | -0.0042 |
| R adjusted | 0.0006 | 0.5006 | 0.1203 | 0.2506 | 0.4590 |
| Δqe | 47.6567 | 7.6908 | 20.0860 | 15.8002 | 6.6594 |
| X | 268.1992 | 0.5536 | 7.0180 | 4.6900 | 0.7670 |
After analyzing the values, it is evident that the adsorption process does not present a good fit for the pseudo-first-order kinetic model. Further more, there is a discrepancy between the experimental and calculated qe values. These data suggest that the process of MB adsorption by FSDSG microparticles does not follow this kinetic model.
The parameter plays a time scaling factor. The higher the value of , the shorter the time taken for the adsorption system to reach equilibrium. Relatively high values of k1 indicate shorter times for the system to reach equilibrium. However, some studies report that the value of k1 may be linked to the dependence or independence of operating conditions [35].
A low correlation coefficient was found with the application of this model. This parameter cannot be used in this work to evaluate the speed with which the system reaches equilibrium. Pseudo-first order kinetics is controlled by diffusion through the boundary layer around the adsorbent solid . Therefore, it is possible to state that diffusion is not the determining step of the process in question since this model did not present a good fit for the experimental data.
In the pseudo-second-order kinetic model for the adsorption of MB by the FSDSG microparticles, the values of exp, calc, and were obtained using the linearized equation and building a graph t/qt as a function of time for each value of the initial concentration of MB, these parameters and the adjusted values are shown in Table 8.
| Initial Concentrations (mg L ) | |||||
| 30 | 45 | 60 | 75 | 90 | |
| (mg g ) | 13.84 | 19.80 | 26.02 | 32.12 | 37.48 |
| (mg g ) | 14.30 | 19.72 | 25.75 | 31.76 | 37.21 |
| (min ) | 0.0750 | 0.0505 | 0.0382 | 0.0309 | 0.0266 |
| R adjusted | 0.9982 | 0.9999 | 0.9999 | 0.9999 | 0.9999 |
| 2.3866 | 0.0606 | 0.2567 | 0.2875 | 0.1807 | |
| X | 0.1080 | 0.0001 | 0.0028 | 0.0043 | 0.0020 |
Through Table 8, was possible to observe the data obtained through the adjustment performed by the kinetic model of pseudo-second-order adsorption. This model's correlation coefficient ( ) was more significant than 0.99 at different concentrations. The applicability of the pseudo-second-order kinetics model was confirmed by the low values of normalized standard deviation ( ). Was also possible to observe that the calculated qe values obtained through the adjustment are very close to the experimental .
It is evidenced that values decrease with increasing concentration. These low values show that the adsorption process is slow, and equilibrium was not reached quickly. The oscillations of these values are linked to the operational conditions and the initial concentration of solute [35].
Kinetic studies are essential tools for understanding the interaction dynamics between the adsorbent and the adsorbate. These provide information that can help model and design adsorption processes. For example, the adsorption kinetics data for MB dye were analyzed using the pseudo-second-order kinetic model shown in Figure 7.
{"image_source":{"path":"images/3ec1304219282605f9cbc282670d4bc35870466c0155a3677b7662be78300ca4.jpg"},"content":"","chart_caption":[],"chart_footnote":[]} {"image_source":{"path":"images/2228d0e991e16da09f9b09ff513417e0ceba0bbd41224dada69cd181d4f4770a.jpg"},"content":"","chart_caption":[],"chart_footnote":[]}
{"image_source":{"path":"images/8fffd32b1a0a4b3e431a69de1da3d3f208820d2c5c7ab473fe11e5e32d205f54.jpg"},"content":"","chart_caption":[],"chart_footnote":[]} {"image_source":{"path":"images/5705e6b44ad6a59714433fc9ed6df071f54b4d8305dc7a57d61625b9fb348a55.jpg"},"content":"","chart_caption":[],"chart_footnote":[]}
{"image_source":{"path":"images/0244e0412ff69fb726c408fc2f120bbe7ff5b94f3c9c212987d050d327713935.jpg"},"content":"","chart_caption":[{"type":"text","content":"Fig. 7: Non-linear fit of the pseudo-second order kinetic study for different MB concentrations. MB concentrations of 30 (a), 45 (b), 60 (c), 75 (d) and 90 (e) mg L "},{"type":"equation_inline","content":"^{-1}"}],"chart_footnote":[]}
According to Figure 7, the MB dye adsorption system by the FSDSG microparticles reached equilibrium during the first 60 min of the test, demonstrating that the interactions were favorable between the adsorbent and the adsorbate.
The model based on the theory described by Weber and Morris (1963) was applied to the adsorption system to identify the intraparticle diffusion mechanism. The value found through the slope of the line corresponds to the intraparticle diffusion constant ( ). In contrast, the approximate value of the boundary layer thickness ( ) is obtained at the intercept of the line. The intraparticle diffusion model can generally occur through the following steps: external diffusion, surface diffusion, and pore diffusion [39].
Table 9 shows the values of kdi, , and correlation coefficient ( ) obtained for the different concentrations. The ( ) values are smaller than predicted by the pseudo-second-order model, so the experimental value does not agree well with the intraparticle diffusion model.
| intraparticle Diffusion | |||
| (mg L ) | (mg g min ) | (mg g ) | R |
| 30 | 0.0404 | 12.57 | 0.1191 |
| 45 | 0.0997 | 17.90 | 0.7930 |
| 60 | 0.1637 | 23.10 | 0.7506 |
| 75 | 0.2167 | 28.33 | 0.6929 |
| 90 | 0.2715 | 32.33 | 0.8301 |
The values related to the five different initial concentrations showed two stages of linearity. The first stage was completed in the first 60 min, known as instantaneous adsorption. The second region is the gradual adsorption stage, where intraparticle diffusion is the rate-limiting. The linear behavior did not pass through the origin or close to saturation, which indicates that intraparticle diffusion is not the step that determines the rate of adsorption, so other interaction mechanisms must act simultaneously to control the adsorption process .
3.9 Thermodynamic
The thermodynamic study is based on the determination of quantities, enthalpy variation ( ), entropy variation ( ), and variation of
Gibbs free energy ( ). By estimating these thermodynamic parameters, it is possible to determine whether the process is spontaneous, exothermic, or endothermic and whether the adsorbent material has an affinity for the adsorbate. In addition, these parameters can provide information regarding the heterogeneity of the adsorbent surface and whether the process involves physical or chemical adsorption [44].
Table 10 shows the values of the Gibbs free energy variation ( ), kc, and adjusted correlation coefficient ( ), obtained for the adsorption of MB dye by FSDSG microparticles at 60, 75, and 90 mg . From the thermodynamic data, was possible to verify that varies from -28.80 to -64.86 kJ , having significant oscillations during the adsorption process.
| Concentration (mg L-1) | kc | ΔG° (kJ mol-1) | R2 |
| 60 | 3.52 | -44.10 | 0.9999 |
| 75 | 2.10 | -64.86 | 0.8619 |
| 90 | 1.62 | -28.80 | 0.9295 |
With the initial concentration of MB of 60 mg L , obtaining the highest correlation coefficient (R ) adjusted for the adsorption was possible. Therefore, this condition was selected to monitor the adsorption process and to determine the values of , and . Table 11 shows the values of the Gibbs free energy change for the adsorption of MB by the FSDSG microparticles at an initial concentration of 60 mg L .
| T (K) | ||||
| 303.15 | 3.5 | -22.34 | ||
| 323.15 | 2.4 | -46.26 | -22.47 | -73.62 |
| 343.15 | 1.8 | -47.73 |
The results concerning the thermodynamics of the adsorption process revealed that it is spontaneous ( kJ mol ) and exothermic ( kJ mol ). The negative value of (-73.62 J mol K ) suggests that the dye molecules are stable on the surface of the adsorbent and that there is a decrease in randomness at the solid-solute interface during adsorption. In addition, the value confirms the affinity of the adsorbent material for the dye.
With increasing temperature, a reduction in adsorption at equilibrium occurs, causing a decrease in kc values and an increase in , indicating a reduction in spontaneity. The increase in the value of being proportional to the increase in temperature indicates that the lower the temperature, the easier the adsorption [45]. This decrease in adsorption capacity can be explained by the increase in temperature, which possibly causes an increase in MB solubility, which makes its adsorption difficult since the dye will have more affinity with the solvent than with the adsorbent.
Ahmad and Kumar (2010b) reported that the enthalpy change due to chemisorption has values between 84 - 420 KJ mol . Thus, enthalpy values below 84 KJ mol indicate that the nature of adsorption is physical, involving weak attractive forces [46]. Entropy is entirely linked to disorganization at the adsorbent/adsorbate interface. Positive values of are interpreted as an increase in disorganization at the adsorbent material interface [40].
IV. CONCLUSION
This work made it possible to prepare good quality encapsulating material with guava seeds, as demonstrated by the characterization tests. In addition, a good yield of flour mass was obtained through cheap and abundant agro-industrial waste. The results showed that the material has promising physical and chemical characteristics as an encapsulating material for the methylene blue dye.
The adsorption of methylene blue by microparticles of dry and defatted guava seed flour is best explained by the pseudo-second-order model, indicating that the adsorption is controlled by sharing or transferring electrons between the adsorbent and adsorbate molecules. Regarding the adsorption equilibrium, the experimental results adjusted all tested isothermal models.
The results referring to the thermodynamics of the adsorption process revealed that it was spontaneous and exothermic. The negative value of suggests that the dye molecules are stable on the surface of the adsorbent and that there is a decrease in randomness at the solid-solute interface during adsorption. In addition, the value confirms the affinity of the adsorbent material for the dye.
Estudo termodinâmico da adsorção de zinco em argila bentonita bofe calcinada. Scientia plena, v. 5, n. 12, 2009. Disponível em: https://www.scientiaplena.org.br/sp/article/view/680.
Research Highlights
Encapsulating material from guava seed.
High capacity to incorporate the methylene blue dye.
Pseudo-second-order model better described the adsorption kinetics.
Conflict of Interest
The authors declare no conflict of interest.
Ethical Approval
Not applicable
Data Availability
The datasets used in this study are openly available at [repository link] and the source code is available on GitHub at [GitHub link].
Funding
This work did not receive any external funding.
References
Cite this article
Related Research

Special Issue
Launch a focused special issue to highlight research, emerging trends, and expert insights in your academic field.