


IntelliPaper
Abstract
Relation between the epidemic size of COVID-19 and the population size was examined for 184 countries in different regions in the world. The plot of the number of the patients or that of the deaths against the population size revealed that the number of the patients or the deaths and the population size were correlated with correlation coefficient 0.5~0.9 within regions but not necessarily across regions; In African region, the correlation emerged only when the region was further divided into sub-regions used by UN Statistics Division. The case-fatality rate was ~0.01 for all the regions or sub-regions. In American and European regions where alpha-1 antitrypsin (AAT) deficiency is prevalent, the number of patients or deaths per population was ~10-fold higher than in the other regions. Analysis indicated that clustering of population with AAT deficiency was necessary for large outbreak to occur.
Explore Digital Article Text
I. INTRODUCTION
Alpha-1 antitrypsin (AAT) deficiency is an autosomal genetic condition that mainly affects Caucasians of European heritage (1-2). As AAT inhibits SARS-CoV-2-priming protease TMPRSS2 that mediates SARS-CoV-2's cell entry (3-5), it is possible that populations with AAT deficiency enhanced SARS-CoV-2 epidemic. In fact, the epidemic size of SARS-CoV-2 was correlated with the prevalence of AAT deficiency in Italy (6) and among countries in the world (7-8).1 As regional factor(s) could be involved in the geographical distribution of SARS-CoV-2 epidemic, I examined relation between the epidemic size of SARS-CoV-2 and the population size region by region.
II. MATERIALS AND METHODS
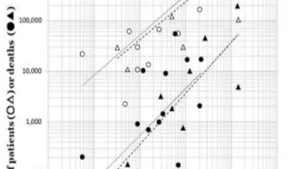
SARS-CoV-2 epidemic data accumulated by WHO till 25 April 2021 for 184 countries in the world, 53 in Europe, 44 in America, 42 in Africa, 22 in Eastern Mediterranean, 13 in Western Pacific, and 10 in South-East Asia, was derived from https://covid19.who.int/table, population size of countries from https://www.Worldometers.info/world-population/population-by-country/; and population with AAT deficiency from Blanco et al.'s publication (2). For analysis, the number of the patients or that of the deaths due to SARS-CoV-2 infection was plotted in the vertical axis against the population size of countries in the horizontal axis both in the logarithmic scale (Figs. 1 and 2). Numeric data obtained from the analysis are summarized in Table 1.
2.1 Correlation between the epidemic size and population size
Correlation coefficient (CC) between the population size and the number of the patients or the deaths was 0.9017 or 0.8496 for Europe, 0.9540 or 0.9953 for America, 0.9931 or 0.9908 for South-East Asia, and 0.4583 or 0.4129 for East Mediterranean (see columns "CC: P vs. Pop" or "CC: D vs. Pop" in Table 1). Correlation was absent for Africa and for Western Pacific regions (CC<0.3) (boxes shaded in Table 1).
For Africa, however, once the region was divided into sub-regions used by UN Statistics Division, correlation emerged with CC>0.46 except D vs. Pop for Eastern Africa (box shaded). For Western Pacific, if China that outperformed other countries (large circles on the right end of Fig. 1B) was removed, the CC became>0.73 both for the patients and the deaths.
It was thus found that basically the size of SARS-CoV-2 epidemic was correlated with population size within regions but not across regions. It was probably because people, including asymptomatically infected people occupying 30% of the infections and being 75% as infectious as those with symptoms (9), moved within regions.
2.2 Plot of the number of the patients or the death in the vertical axis against population size in the horizontal axis For Europe, America (triangles and circles, respectively, in Fig. 1A) and South-East Asia (triangles in Fig. 1B), the slope of the plot was indicating that the chance of infection was the same irrespective of the population size. CC between the number of the patients or the deaths and the population size was 0.84~0.99 (Table 1). For Western Pacific (circles in Fig. 1B), East Mediterranean (squares in Fig. 1B) and African regions (Fig. 2A), the slope of the plots was milder indicating that the chance of infection decreased as population size increased. CC between the number of the patients or the deaths and the population size was 0.41~0.76 (Table 1).
Thus, the number of the patients and that of the deaths were proportional to the population size within regions, i.e., outbreak of SARS-CoV-2 was basically regional, and stochastic despite of different measures taken in different countries (10).
2.3 Case-fatality and number of the patients or the deaths per population
Case-fatality rate is represented by the vertical distance between the plots of the number of the patients and the number of the deaths (Figs. 1A, 1B and 2A). It was 0.01~0.02 for all the regions with possible exception of Algeria/Egypt/Sudan (0.0492) (Table 1, column case-fatality (D/P)).
The number of the patients or the deaths per population is represented by the vertical distance of the plots from the horizontal axis. As summarized in Table 1, the number of patients per population (Patients/Pop) was 0.0548~0.0606 for Europe and America, but it was 0.01 or less for the other regions. The number of the deaths per population (Death/Pop) was 0.00115~0.00148 for Europe and America but was 0.0001~0.0004 for the other regions.
Thus, the outbreak size was 5~10-fold larger for American and European regions than for the other regions, which was expected from the high prevalence of AAT deficiency in European and American regions.
[Note: It should be reminded that the number of the patients or the deaths per population increases as epidemic progresses. In that sense, the value is expected to be higher in countries where the epidemic started earlier. In the present case, however, the epidemic started first in China, Japan, Republic of Korea and Thailand (WHO situation report–1https://covid19.who.int/table), and countries with the higher number of the patients or the deaths per population are those in European and American regions.]
2.4 Influence of AAT deficient population on SARS-CoV-2 epidemic in non-American non-European regions
AAT deficiency is found in regions other than American and European regions (2). Non-American non-European countries in Blanco et al.'s list (2) were grouped into those with AAT deficiency and those with AAT deficiency . The number of the patients or the deaths due to SARS-CoV-2 was plotted in the vertical against the population size in the horizontal axis (Fig. 2B). The plot for countries with AAT deficiency and that for countries with AAT deficiency overlapped and the plot level was that of non-European non-American regions. It appeared that AAT deficiency was unrelated to the epidemic size of SARS-CoV-2. It was not necessarily the case, however.
Countries with AAT deficiency >1‰ in non-European non-American region are: Cameroon, Cape Verde, Morocco, Nigeria, Somalia, Tunisia, Mozambique, Republic of Congo, South Africa, Iran, Malaysia, Papua New Guinea, Philippines, Singapore, Thailand, Pakistan, New Zealand and Australia, which are interspersed by countries with frequency of AAT deficiency <1‰: Democratic Republic of Congo, China, Indonesia, Japan, Mongolia, South Korea, Nepal, India and probably others. In Europe and America, all the countries are with AAT deficiency and such countries are packed together. Prevalence of AAT deficiency was 18.7 ‰ (4-63‰) in countries with AAT deficiency in non-European non-American regions, which was about two-fold lower than 36.5 ‰ (6-114 ‰) in European American regions. It is possible that there is a threshold in terms of prevalence of AAT deficiency, above which SARS-CoV-2 epidemic explodes.
Footnotes
Conflict of Interest
The authors declare no conflict of interest.
Ethical Approval
Not applicable
Data Availability
The datasets used in this study are openly available at [repository link] and the source code is available on GitHub at [GitHub link].
Funding
This work did not receive any external funding.
References
Cite this article
Related Research

Special Issue
Launch a focused special issue to highlight research, emerging trends, and expert insights in your academic field.