

IntelliPaper
Abstract
The exploration and production of petroleum resources create both opportunities and environmental challenges for sustainable development. In Kenya, the Government, along with private investors, has pursued oil and gas activities in the Anza, Mandera, Lamu, and Tertiary Rift Basins. Sixty-three petroleum exploration blocks were created through Gazette Notice No. 3344 on May 13, 2016, and later reduced to fifty through Gazette Notice No. 4832 on April 16, 2025. This study evaluated the impact of petroleum operations on soil quality at the Twiga 1 waste consolidation site in Turkana County (Block T7, previously 13T, Tertiary Rift Basin). It focused on concentrations of lead (Pb) and cadmium (Cd). A descriptive cross-sectional and experimental design was used. Soil samples were collected using the grid sampling method. A soil auger was used for soil sampling, and samples were transported to the laboratory in well-labeled aluminum containers. The samples were analyzed for heavy metals using an Atomic Absorption Spectrometer (AAS-7000, Shimadzu). The study objectives were to i) assess the levels of lead and cadmium in the soil at the Twiga 1 waste consolidation site, ii) determine the levels during the wet and dry season, and iii) compare the levels with established environmental standards. Heavy metal concentrations were found to be very low at all sites and in both seasons, remaining well below WHO and US EPA limits. In the wet season, mean concentrations (mg/kg) were: Pb (0.003–0.035) and Cd (0.000–0.003). During the dry season, slightly higher values were recorded than in the wet season: Pb (0.000–0.044) and Cd (0.000–0.004). Although the differences were small, they showed seasonal variation, with higher dry-season concentrations linked, limited leaching, moisture loss from evaporation, and dust deposition from the atmosphere. All concentrations were well below World health organization set limits (WHO) (Pb: 100 mg/kg; Cd: 1–3 mg/kg) and US EPA (Pb: 400 mg/kg; Cd: 70 mg/kg). The soils are therefore uncontaminated and safe for farming, living, and ecological purposes. Comparing p-values of heavy metal concentrations between wet and dry seasons (α = 0.05) supports the hypothesis that levels are higher in the dry season at the Twiga 1 waste consolidation site. Lead (0.001–0.055) shows significant differences, while cadmium (0.000–0.046) provides strong evidence for higher levels in the dry season. Heavy metal concentrations were significantly higher in the dry season compared to the wet season but remained below world health organization set limits (WHO) and US EPA limits. The increase in metal concentrations during the dry season highlights the impact of climate variability on soil chemistry. Although the soils at the Twiga 1 waste consolidation site are safe, ongoing monitoring is recommended to protect long-term soil health and environmental integrity around petroleum operations.
Explore Digital Article Text
I. INTRODUCTION
1.1: Background Information
Heavy metals are introduced into the environment during upstream petroleum production through various interconnected pathways related to drilling activities, extraction, and waste management activities. During drilling and production, additives and chemicals in drilling fluids such as barite may contain trace heavy metals, including cadmium and lead, which can be released into surrounding soils and water (Smith et al., 2018). Furthermore, produced water generated during oil and gas extraction can contain naturally occurring heavy metals that are mobilized from reservoir rocks, notably lead and cadmium (Brown et al., 2017). The corrosion of drilling and production equipment further contributes to environmental contamination by releasing metals such as cadmium and lead (Jones et al., 2019). Areas with naturally high background concentrations of these metals, particularly in the Middle East and parts of Africa, are especially susceptible to contamination, as improper disposal of produced water, drilling cuttings, and other oilfield wastes can markedly exacerbate environmental heavy metal levels (Johnson et al., 2020). Oil spills and leakages occurring during exploration and production can release persistent heavy metals into the environment, leading to their accumulation in soils and sediments and causing long-term ecological impacts (Pandiyan et al., 2021). The buildup of lead and cadmium in soils and aquatic systems contributes to extensive environmental degradation, posing severe risks to communities reliant on agriculture and fisheries. These metals bioaccumulate in plants and animals, disrupting food webs, decreasing biodiversity, and inflicting potentially irreversible ecological damage (Phaenark et al., 2024). Heavy metal contamination can impair plant growth and photosynthetic activity, leading to reduced vegetation cover and a decline in the carbon sequestration capacity of ecosystems (Pandiyan et al., 2021). The consequent loss of natural carbon sinks may further exacerbate climate change by limiting atmospheric removal. Additionally, degraded ecosystems may release_stored carbon through the decomposition of vegetation and soil organisms, creating a feedback loop that further increases atmospheric concentrations. Exposure to cadmium and lead also poses significant human health risks. Lead exposure is linked to neurological damage, particularly in children, while cadmium is a recognized carcinogen associated with renal dysfunction and skeletal disorders (Rozirwan et al., 2024). Beyond these direct health effects, such impacts can indirectly contribute to climate change by increasing healthcare demands and energy consumption, thereby elevating carbon emissions. In Kenya, the government, in partnership with oil and gas investors, has conducted extensive petroleum exploration across multiple sedimentary basins, including Anza, Mandera, Lamu, and the Tertiary Rift Basin, with fifty exploration blocks officially gazetted. The study focuses on Twiga 1, a waste consolidation site within Block T7 (formerly Block 13T) in the Tertiary Rift Basin. Since the onset of petroleum operations, communities in Turkana County have reported heightened livestock mortality, particularly among goats. Oilfield wastes are known to contain toxic heavy metals such as lead, chromium, cadmium and nickel, which are harmful to grazing animals and can accumulate in contaminated soils (Stimmel et al., 1989; Wyszkowski & Kordala, 2024). Consequently, a detailed soil Analysis of the Twiga 1 waste consolidation site is necessary to determine whether heavy metals have accumulated to levels that pose a risk to livestock, human health and the surrounding environment in Block T7 of the Tertiary Rift Basin.
II. METHODOLOGY
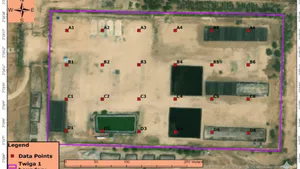
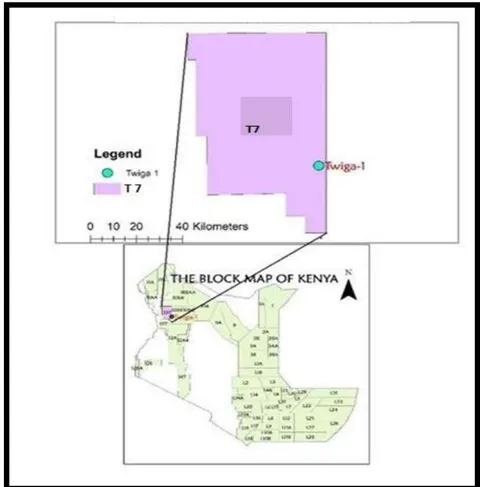
2.1: The study was conducted at the Twiga 1 waste consolidation site in Turkana County, Kenya, as shown in Figure 2.2. Twiga 1 is a well pad located in Block T7 (formerly Block 13T) within the Tertiary Basin, licensed by the National Environment Management Authority (NEMA), No. PR/10351. The well was drilled in 2012 and it was one of the few sites in the basin where commercially viable crude oil deposits were discovered. Since 2014, Tullow Kenya B.V. has been using the Twiga 1 site, Longitude:
35° 42' 57.43" E, Latitude: 2° 24' 10.88" N) as a temporary storage area for drill cuttings from other wells in the basin, even though the site was not licensed as a waste holding facility. Located in a semi-arid zone, the region experiences rainfall concentrated in two distinct periods: the long rains between April and June and the short rains from October to December. With an annual average rainfall often falling below 500 mm, the area faces challenges in maintaining adequate soil moisture, which, coupled with sparse vegetation cover, increases susceptibility to soil erosion. These climatic conditions have significant implications for agricultural productivity and natural resource management, highlighting the need for sustainable land-use strategies tailored to such rainfall variability. Humidity levels in Turkana are generally low, averaging between 30% and 50% which can exacerbate the impacts of drought and influence soil properties. The area experiences moderate to strong winds, particularly during dry seasons and wind patterns which contribute to soil erosion and affect the dispersal of pollutant.
2.2 Sampling of soil samples
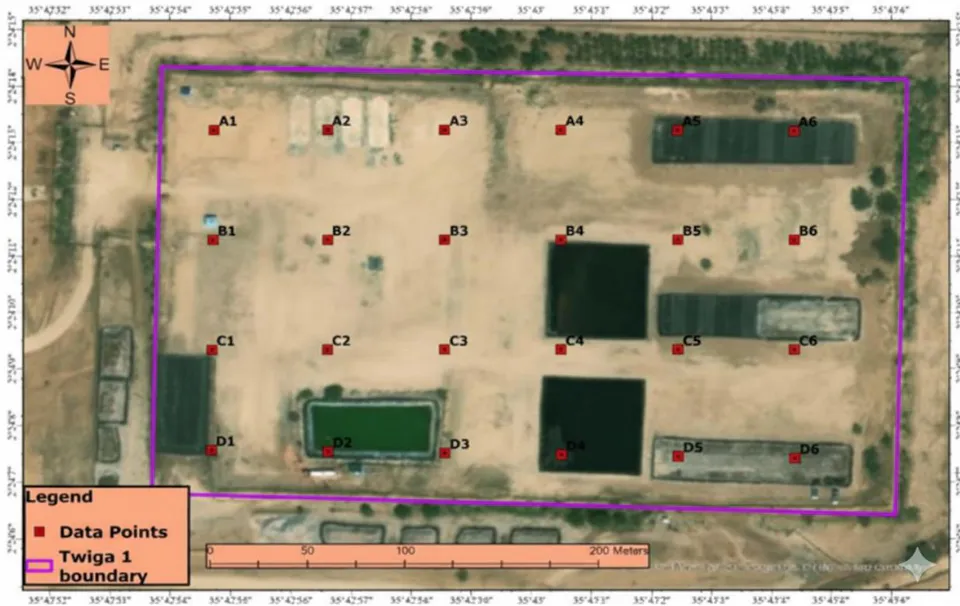
Sampling was conducted once a month for four months, between April and August 2025, across four grids (Fig. 2.2). The sampling points were referenced using GPS coordinates. (Table 2.1). Soil samples (300 g from each sampling point) were collected from 24 sampling sites using a soil auger at a depth of 0–6 cm and transferred into clean, labeled aluminum containers. The containers were labeled to indicate the sampling date and sampling points. The samples were then transported to the laboratory for Analysis. In the laboratory, the samples were dried in an oven at a temperature of 800 degree centigrade. The dried soil samples were pulverized to a particle size of 150 microns using a pulverizer to increase their surface area.
| Identity | Coordinates | ||
| Latitude N | Longitude E | Elevation | |
| A1 | 35° 42′ 54.73′′ | 2°24′13.23′′ | 705m |
| A2 | 35° 42′ 56.69′′ | 2° 24′ 13.26′′ | 705mm |
| A3 | 35.716265, | 2° 24′ 13.26′′ | 703m |
| A4 | 35° 43′ 0.49′′ | 2° 24′ 13.24′′ | 703m |
| A5 | 35° 43′ 2.47′′ | 2° 24′ 13.24′′ | 696m |
| A6 | 35° 43′ 4.45′′ | 2° 24′ 13.22′′ | 697m |
| B1 | 35° 42′ 54.75′′ | 2° 24′ 11.24′′ | 704m |
| B2 | 35° 42′ 56.57′′ | 2° 24′ 11.28′′ | 705m |
| B3 | 35° 42′ 58.50′′ | 2° 24′ 11.28′′ | 705m |
| B4 | 35° 43′ 0.46′′ | 2° 24′ 11.25′′ | 700m |
| B5 | 35° 43′ 2.54′′ | 2° 24′ 11.32′′ | 702m |
| B6 | 35° 43′ 4.32′′ | 2° 24′ 11.52′′ | 697m |
| C1 | 35° 42′ 54.64′′ | 2° 24′ 9.36′′ | 701m |
| C2 | 35° 42′ 56.56′′ | 2° 24′ 9.31′′ | 710m |
| C3 | 35° 42′ 58.58′′ | 2° 24′ 9.35′′ | 706m |
| C4 | 35° 43′ 0.53′′ | 2° 24′ 9.29′′ | 700m |
| C5 | 35° 43′ 2.43′′ | 2° 24′ 9.36′′ | 699m |
| C6 | 35° 43′ 4.40′′ | 2° 24′ 9.35′′ | 696m |
| D1 | 35° 42′ 54.69′′ | 2° 24′ 7.61′′ | 700m |
| D2 | 35° 42′ 56.62′′ | 2° 24′ 7.54′′ | 699m |
| D3 | 35° 42′ 58.56′′ | 2° 24′ 7.49′′ | 703m |
| D4 | 35° 43′ 0.50′′ | 2° 24′ 7.50′′ | 699m |
| D5 | 35° 43′ 2.45′′ | 2° 24′ 7.43′′ | 699m |
| D6 | 35° 43′ 4.42′′ | 2° 24′ 7.40′′ | 695m |
2.3: Preparation and digestion for metal analysis using AAS
Each sample was dried in an oven at , followed by pulverization to 150 microns. A 2.5000 g portion of the pulverized soil sample was weighed using a four-decimal analytical balance and transferred into a 150 ml glass beaker. Twenty milliliters of distilled water were added to form a slurry, followed by 5 ml of nitric acid. The mixture was then placed on a sand bath. The samples were left to digest until no more brown fumes were produced and the contents became clear. The contents were left to cool and then filtered through Whatman No. 42 filter paper into a 100 ml volumetric flask, followed by several washings. Finally, the volume was made up to the mark with deionized water and labeled accordingly. A blank sample was prepared in the same manner as the soil sample.
2.4: Preparation of working standards from a 100ppm stock solution
Working standard solutions in the range of 0 ppm to 30 ppm were prepared from a 100-ppm analytical grade stock solution of lead and cadmium using the Dilution formula
Original stock solution concentration
Volume of stock solution to be taken
C2 = Expected new concentration of working standards
V2 = Expected volume of working standards
2.5: Sample Analysis using AAS
The working standards were analysed using an Atomic Absorption Spectrometer (AAS-7000, Shimadzu) and calibration curves were plotted based on the absorbance and concentration readings in ppm. The samples containing the analytes of interest were then analysed and their concentrations were determined using the calibration curves of the standards.
2.6: Statistical methods used to analyze the data
2.6.1 Calibration curves
Calibration curves were used to establish the relationship between concentration and absorbance. Linear regression analysis was employed to examine trends in the data. A t-test was used to compare standard reference values with sample results, and summary tables were generated to present heavy metal concentrations across the various sampling sites. The measured values were then compared with permissible limits for lead and cadmium, to evaluate soil safety. This was to determine whether the concentrations exceed acceptable limits, thereby posing potential risks to human health. In such cases, awareness was raised among the nearby community, relevant government agencies and policymakers to facilitate appropriate environmental interventions and ensure public safety. In this study, the recommended instrument parameters for lead were used as outlined below. An electrodeless discharge lamp (EDL) served as the light source, with acetylene as the fuel and air as the support gas under oxidising flame conditions. For precise and sensitive lead determination, the wavelength was set at 217 nm with a spectral bandpass of 1.0 nm. Cadmium analysis was carried out using an electrodeless discharge lamp (EDL) operated at 3.5 mA, with acetylene as the fuel and air as the support gas under oxidizing flame conditions. The wavelength was set at 228 nm with a 0.5 nm spectral bandpass to achieve optimal detection accuracy.
{"image_source":{"path":"images/a91d86a351757a4e5e43cf6ad93f6b039f08523114ef23879c65c0db9874344f.jpg"},"content":"","chart_caption":[{"type":"text","content":"Figure 2.3: Calibration curve for Pb for 5 standards"}],"chart_footnote":[]} In this study, the recommended instrument parameters for lead were used as outlined below. An electrodeless discharge lamp (EDL) was employed as the light source. Acetylene was used as the fuel, with air serving as the support gas under oxidizing flame conditions. The wavelength was set at 217 nm with a spectral band pass of 1.0 nm to achieve optimal precision and sensitivity in lead determination
{"image_source":{"path":"images/6dd8db5ab948b82cc8798277189112c4702949518f85c5491ae679df9e110bf8.jpg"},"content":"","chart_caption":[{"type":"text","content":"Figure 2.4: Calibration curve for Cd for 5 standards"}],"chart_footnote":[]} In this study, cadmium analysis was conducted using an electrodeless discharge lamp at 3.5 mA, with acetylene as the fuel and air as the support gas under oxidizing flame conditions. The wavelength was set at 228 nm with a 0.5 nm spectral band pass for optimal detection accuracy.
III. RESULTS, DISCUSSION
3.1: Lead (Pb)
| Lead concentration in the soil samples during wet season | ||||||||||||
| Method | A1 | A2 | A3 | A4 | A5 | A6 | B1 | B2 | B3 | B4 | B5 | B6 |
| 0.041 | 0.030 | 0.012 | 0.040 | 0.022 | 0.031 | 0.031 | 0.043 | 0.032 | 0.012 | 0.04 | 0.00 | |
| 0.022 | 0.042 | 0.023 | 0.031 | 0.021 | 0.032 | 0.023 | 0.032 | 0.023 | 0.023 | 0.032 | 0.010 | |
| 0.034 | 0.031 | 0.021 | 0.032 | 0.040 | 0.023 | 0.023 | 0.031 | 0.034 | 0.021 | 0.024 | 0.000 | |
| Mean | 0.032 | 0.034 | 0.019 | 0.034 | 0.028 | 0.029 | 0.026 | 0.035 | 0.030 | 0.019 | 0.032 | 0.003 |
| SD | 0.008 | 0.005 | 0.005 | 0.004 | 0.008 | 0.004 | 0.004 | 0.0054 | 0.006 | 0.0058 | 0.0065 | 0.047 |
| P-value | 0.01 | 0.010 | 0.01 | 0.0 | 0.01 | 0.01 | 0.01 | 0.0 | 0.01 | 0.031 | 0.01 | 0.01 |
| C1 | C2 | C3 | C4 | C5 | C6 | D1 | D2 | D3 | D4 | D5 | D6 | |
| 0 | 0 | 0 | 0.032 | 0.013 | 0.042 | 0 | 0.032 | 0.00 | 0.047. | 0.032 | 0.024 | |
| 0 | 0 | 0 | 0.023 | 0.023 | 0.023 | 0 | 0.024 | 0.000 | 0.032 | 0.024 | 0.033 | |
| 0 | 0 | 0 | 0.031 | 0.021 | 0.032 | 0 | 0.013 | 0.000 | 0.032 | 0.035 | 0.035 | |
| Mean | 0 | 0 | 0 | 0.029 | 0.019 | 0.032 | 0 | 0.023 | 0.000 | 0.037 | 0.030 | 0.030 |
| SD | 0 | 0 | 0 | 0.005 | 0.005 | 0.010 | 0 | 0.009 | 0.0 | 0.009 | 0.006 | 0.006 |
| P-Value | 0 | 0 | 0 | 0.010 | 0.025 | 0.010 | 0 | 0.053 | 0.000 | 0.018 | 0.00 | 0.01 |
| Lead concentration in the samples during dry season | ||||||||||||
| A1 | A2 | A3 | A4 | A5 | A6 | B1 | B2 | B3 | B4 | B5 | B6 | |
| 0.034 | 0.042 | 0.024 | 0.032 | 0.034 | 0.035 | 0.023 | 0.036 | 0.032 | 0.031 | 0.032 | 0.025 | |
| 0.043 | 0.044 | 0.033 | 0.045 | 0.024 | 0.024 | 0.024 | 0.040 | 0.024 | 0.044 | 0.021 | 0.013 | |
| 0.035 | 0.032 | 0.035 | 0.035 | 0.035 | 0.033 | 0.035 | 0.024 | 0.035 | 0.035 | 0.043 | 0.014 | |
| Mean | 0.037 | 0.039 | 0.031 | 0.037 | 0.031 | 0.031 | 0.027 | 0.033 | 0.030 | 0.037 | 0.032 | 0.017 |
| SD | 0.045 | 0.045 | 0.045 | 0.045 | 0.045 | 0.045 | 0.045 | 0.045 | 0.045 | 0.045 | 0.045 | 0.045 |
| P-Value | 0.001 | 0.01 | 0.00 | 0.55 | 0.009 | 0.01 | 0.018 | 0.00 | 0.006 | 0.005 | 0.035 | 0.045 |
| C1 | C2 | C3 | C4 | C5 | C6 | D1 | D2 | D3 | D4 | D5 | D6 | |
| 0 | 0 | 0 | 0.043 | 0.023 | 0.045 | 0 | 0.040 | 0 | 0.041 | 0.044 | 0.035 | |
| 0 | 0 | 0 | 0.031 | 0.035 | 0.031 | 0 | 0.031 | 0 | 0.042 | 0.031 | 0.042 | |
| 0 | 0 | 0 | 0.042 | 0.036 | 0.040 | 0 | 0.035 | 0 | 0.045 | 0.040 | 0.054 | |
| Mean | 0 | 0 | 0 | 0.039 | 0.031 | 0.039 | 0 | 0.035 | 0 | 0.043 | 0.038 | 0.044 |
| SD | 0 | 0 | 0 | 0.006 | 0.007 | 0.0071 | 0 | 0.005 | 0 | 0.0021 | 0.00665 | 0.0096 |
| P-value | 0 | 0 | 0 | 0.004 | 0.01 | 0.01 | 0 | 0.005 | 0 | 0.000 | 0.01 | |
| WHO | 100 mg/kg | |||||||||||
| US EPA | 400 mg/kg | |||||||||||
{"image_source":{"path":"images/26e6cab90a02016bf45782841538f9dd7fd317598837355fbce17faa5b80d6c2.jpg"},"content":"","chart_caption":[{"type":"text","content":"Figure 2.5: Summary of the statistical analysis of lead concentration in the soil samples during wet season"}],"chart_footnote":[]} {"image_source":{"path":"images/db07c96e390700886ccb30de0dbb99bb1c194251b67e9d4b3c2897d3bc1670b4.jpg"},"content":"","chart_caption":[{"type":"text","content":"Sample number"},{"type":"text","content":"Sample number"}],"chart_footnote":[]}
{"image_source":{"path":"images/feeecec2d0c082362cdf47eeb7396b6b7bce971cb72b33bcb71b6c0da715bc05.jpg"},"content":"","chart_caption":[{"type":"text","content":"Figure 2.6: Summary of the statistical analysis of lead concentration in the soil samples during wet season"},{"type":"text","content":"Figure 2.7: Summary of the statistical analysis of lead concentration in the soil samples during dry season"}],"chart_footnote":[]} {"image_source":{"path":"images/5c85a657095f183245300d62ba09613eeba57a53c6d9249820a584c6d57356f5.jpg"},"content":"","chart_caption":[{"type":"text","content":"Sample number"},{"type":"text","content":"Figure 2.8: Summary of the statistical analysis of lead concentration in the soil samples during the dry season."}],"chart_footnote":[]}
The results of the research showed 0.003–0.043 mg·kg lead with several undetected, the results are remarkably low compared to petroleum operation facilities globally, which contain soils and drilling cuttings with excessive levels of heavy metals. Mugendi et al. (2019) reported lead (Pb) concentrations ranging from tens to hundreds of mg·kg in soils and mud cuttings from the Twiga-1 well in Kenya's South Lokichar Basin, while Brown et al. (2020) documented concentrations of 25–180 mg·kg in reserve pits surrounding drilling sites in Nigeria. Abuzaid et al. (2022) reported Pb concentrations of 40–220 mg·kg in soils from petroleum plants in Saudi Arabia, while Smith et al. (2020) recorded levels of 15–95 mg·kg in soils contaminated with drilling wastes in Texas, USA., In the Daqing oilfield in China, lead levels of 20–160 mg·kg were observed around oil production terminals (Liang et al., 2020).
Comparatively, the results are orders of magnitude lower, providing significant evidence for background unadulterated soils at a petroleum-influenced site. This offers new baseline measurements that assist in separating natural conditions from petroleum-induced contamination. It established a seasonal baseline of petroleum-associated land soils with minimal contamination. It demonstrated that not all sites where petroleum activities are performed are contaminated, refuting flawed assumptions in literature. International comparative findings highlighted that, the site substantially differs from very contaminated petroleum sites in Africa, Asia and North America. In general, the findings corroborate the need for site-specific monitoring, emphasizing that contamination is not uniform in petroleum terminals.
3.2: Cadmium (Cd)
Cadmium concentrations in the research during both wet and dry seasons were extremely low, ranging from 0.001 to 0.005 mg·kg , with many undetected values as shown in Table 2 and figure 2.5, 2.6, 2.7 and 2.8. They are several orders of magnitude lower than concentrations measured at petroleum operation sites worldwide, where drilling fluids, cuttings, and produced water contribute to elevated cadmium levels. For instance, Brown et al., (2020) recorded concentrations of 1.5 to 6.8 mg·kg of cadmium in soils near oil drilling pits in the Niger Delta.
Nigeria, they recorded 2–12 mg·kg in the neighbourhood of petroleum facilities in Saudi Arabia by Abuzaid et al. (2022). In the Daqing oilfield of China, Liang et al. (2020) reported 3–15 mg·kg cadmium in the soils of the oil production terminals and Smith et al., 2020) reported 1–4 mg·kg in petroleum-impacted soils of Texas, USA. Similar ranges have also been reported in the petroleum fields of Egypt's Gulf of Suez, where cadmium was found to be up to 5–10 mg·kg (El-Sorogy et., 2018). Compared with these values, the present findings indicate that cadmium concentrations in the study area are well below international guidelines limits (EU: 1–3 mg·kg ; US EPA: 70 mg·kg ) and therefore the soils remain uncontaminated and are suitable for agricultural and ecological use. The results represent a significant contribution by providing a baseline reference for uncontaminated petroleum-adjacent soils, showing that not all oilfield-related sites are affected by cadmium pollution. The research established a seasonal baseline characterised by largely non-detectable to trace cadmium concentrations, which contrasted sharply with petroleum contamination hotspots reported worldwide. It illustrated the absence of petroleum-based cadmium pollution despite the location's proximity to petroleum activities. Evidence from global comparisons indicates that, whereas oilfields in other regions exhibit cadmium concentrations ranging from 1–15 mg·kg , the site in question displays quasi-zero levels. These findings emphasise that cadmium hazards are more site-specific rather than widespread across petroleum regions. While cadmium in petroleum sites around the world is typically in the 1–15 mg·kg range, my results (0.001–0.005 mg·kg ) are more or less negligible. During the dry season, dilution and leaching of lead and cadmium in the soil are minimised due to low rainfall amounts. Additionally, high temperatures and evaporation rates reduce soil moisture content, resulting in higher trace metal concentrations on a dry-weight basis. On the other hand, the dry season is also characterised by the deposition of wind-borne dust, which adds trace metals to the surface soil. On the contrary, the wet season is marked by high rainfall, which enhances the dilution and leaching of trace metals in the soil. As a result, the soil trace metal concentration is relatively low. However, in the context of climate change, rising temperatures and increased likelihood of drought enhance the buildup of trace metals in the soil. In the long run, high temperatures, low soil moisture, sparse biota, and the soil's chemical composition affect the mobility of trace metals in the soil.
| Cadmium concentration in the soil samples during wet season in (mg/kg) | ||||||||||||
| Method | A1 | A2 | A3 | A4 | A5 | A6 | B1 | B2 | B3 | B4 | B5 | B6 |
| AAS | 0 | 0 | 0 | 0 | 0.002 | 0.003 | 0.001 | 0 | 0 | 0.001 | 0.001 | 0 |
| 0 | 0 | 0 | 0 | 0.001 | 0.002 | 0.002 | 0 | 0 | 0.001 | 0.001 | 0 | |
| 0 | 0 | 0 | 0 | 0.002 | 0.003 | 0.001 | 0 | 0 | 0.001 | 0.001 | 0 | |
| Mean | 0 | 0 | 0 | 0 | 0.002 | 0.003 | 0.001 | 0 | 0 | 0.001 | 0.001 | 0 |
| SD | 0 | 0 | 0 | 0 | 0.00058 | 0.00058 | 0.00058 | 0 | 0 | 0.000 | 0.000 | 0 |
| P-value | 0 | 0 | 0 | 0 | 0.036 | 0.01 | 0.06 | 0 | 0 | 0.000 | 0.000 | 0 |
| C1 | C2 | C3 | C4 | C5 | C6 | D1 | D2 | D3 | D4 | D5 | D6 | |
| 0 | 0 | 0 | 0.002 | 0.002 | 0.002 | 0 | 0.003 | 0 | 0.000 | 0.000 | 0.001 | |
| 0 | 0 | 0 | 0.001 | 0.002 | 0.001 | 0 | 0.001 | 0 | 0.000 | 0.001 | 0.001 | |
| 0 | 0 | 0 | 0.002 | 0.001 | 0.001 | 0 | 0.002 | 0 | 0.001 | 0.001 | 0.002 | |
| Mean | 0 | 0 | 0 | 0.002 | 0.002 | 0.001 | 0 | 0.002 | 0 | 0.000333 | 0.000333 | 0.001333 |
| SD | 0 | 0 | 0 | 0.000577 | 0.035 | 0.000577 | 0 | 0.001 | 0 | 0.000577 | 0.000577 | 0.000577 |
| P-Value | 0 | 0 | 0 | 0.04 | 0.035 | 0.056 | 0 | 0.074 | 0 | 0.423 | 0.423 | 0.056 |
| Cadmium concentration in the soil samples during dry season in (mg/kg) | ||||||||||||
| A | A2 | A3 | A4 | A5 | A6 | B1 | B2 | B3 | B4 | B5 | B6 | |
| 0 | 0 | 0 | 0 | 0.004 | 0.005 | 0.003 | 0 | 0 | 0.001 | 0.002 | 0 | |
| 0 | 0 | 0 | 0 | 0.004 | 0.004 | 0.004 | 0 | 0 | 0.002 | 0.001 | 0 | |
| 0 | 0 | 0 | 0 | 0.005 | 0.003 | 0.005 | 0 | 0 | 0.001 | 0.003 | 0 | |
| Mean | 0 | 0 | 0 | 0 | 0.004 | 0.004 | 0.004 | 0 | 0 | 0.001 | 0.002 | 0 |
| SD | 0 | 0 | 0 | 0 | 0.00058 | 0.001 | 0.001 | 0 | 0 | 0.00058 | 0.001 | 0 |
| P-Value | 0 | 0 | 0 | 0 | 0.006 | 0.020 | 0.460 | 0 | 0 | 0.650 | 0.460 | 0 |
| C1 | C2 | C3 | C4 | C5 | C6 | D1 | D2 | D3 | D4 | D5 | D6 | |
| 0 | 0 | 0 | 0.003 | 0.003 | 0.003 | 0 | 0.003 | 0 | 0.001 | 0.000 | 0.003 | |
| 0 | 0 | 0 | 0.001 | 0.004 | 0.001 | 0 | 0.001 | 0 | 0.002 | 0.001 | 0.002 | |
| 0 | 0 | 0 | 0.003 | 0.002 | 0.004 | 0 | 0.002 | 0 | 0.001 | 0.002 | 0.002 | |
| Mean | 0 | 0 | 0 | 0.002 | 0.003 | 0.003 | 0 | 0.002 | 0 | 0.001 | 0.001 | 0.002 |
| SD | 0 | 0 | 0 | 0.0011547 | 0.001 | 0.0015275 | 0 | 0.001 | 0 | 0.000577 | 0.001 | 0.000577 |
| P-Value | 0 | 0 | 0 | 0.650 | 0.460 | 0.510 | 0 | 0.460 | 0 | 0.650 | 0.460 | 0.420 |
| EU | 1 mg/kg to 3 mg/kg | |||||||||||
| US EPA | 70 mg/kg | |||||||||||
{"image_source":{"path":"images/6e87850b96478846145ef5efecd2c141a4b8454c0f250baf958cb89920463e6e.jpg"},"content":"","chart_caption":[],"chart_footnote":[]} {"image_source":{"path":"images/3201a246edcd15dd28e934b8c292cf5387a5c08128a0a64e1bf06905852de793.jpg"},"content":"","chart_caption":[{"type":"text","content":"Figure 2.9: Summary of the statistical analysis of Cadmium concentration in the soil samples during wet season."},{"type":"text","content":"Sample number"},{"type":"text","content":"Figure 2.10: Summary of the statistical analysis of Cadmium concentration in the soil samples during wet season"}],"chart_footnote":[]}
{"image_source":{"path":"images/5fc7843283a037174a83528233063206bc7da4c272c36ff39b8e80811bc0501b.jpg"},"content":"","chart_caption":[{"type":"text","content":"Sample number"}],"chart_footnote":[]} {"image_source":{"path":"images/62a3bb5c759ea6cc1b3766537726e4b7aa56d4e8bc43bc1052d95ff514256573.jpg"},"content":"","chart_caption":[{"type":"text","content":"Figure 2.11: Summary of the statistical analysis of Cadmium concentration in the soil samples during dry season"},{"type":"text","content":"Figure 2.12: Summary of the statistical analysis of Cadmium concentration in the soil samples during dry season"}],"chart_footnote":[]}
IV. CONCLUSION AND RECOMMEDATIONS
4.1: conclusion
The order of mean concentrations during both seasons was Pb > Cd. In the wet season, mean concentrations (mg/kg) ranged from 0.003 to 0.035 for Pb and from 0.000 to 0.003 for Cd. During the dry season, slightly higher concentrations were observed, with Pb ranging from 0.000 to 0.044 mg/kg and Cd from 0.000 to 0.004 mg/kg. Although the differences between seasons were small, they indicate seasonal variation, with higher dry-season concentrations attributed to reduced dilution during the rainy season, moisture loss through evaporation, and atmospheric dust deposition. All measured concentrations were well below the WHO guideline limits (Pb: 100 mg/kg; Cd: 1–3 mg/kg) and US EPA limits (Pb: 400 mg/kg; Cd: 70 mg/kg). The soils are therefore uncontaminated with respect to lead (Pb) and cadmium (Cd) and are considered safe for farming, residential use, and ecological purposes.
4.2 Recommendations
Routine monitoring of lead and cadmium levels in soils around petroleum exploration sites and waste disposal facilities should be conducted regularly, with special attention during the dry season when metal concentrations tend to increase. Early detection through continuous soil testing will enable timely intervention to prevent contamination and protect soil fertility.
Soil management at petroleum and waste facilities should incorporate climate adaptation measures such as mulching, organic amendments, and controlled irrigation to maintain soil moisture and reduce seasonal spikes in metal concentrations.
Environmental legislation should be strengthened to establish allowable seasonal limits for lead and cadmium in soils near petroleum facilities, waste disposal sites, and adjacent agricultural or residential areas. Mandatory soil testing before, during, and after petroleum operations should be enforced, with designated institutions responsible for compliance and oversight.
Awareness and training programs should be implemented for petroleum workers, waste management personnel, farmers, and surrounding communities on the risks of lead and cadmium contamination, safe handling practices, proper waste disposal, and spill prevention.
4.3: Acknowledgments
Conflict of Interest
The authors declare no conflict of interest.
Ethical Approval
Not applicable
Data Availability
The datasets used in this study are openly available at [repository link] and the source code is available on GitHub at [GitHub link].
Funding
This work did not receive any external funding.
References
Cite this article
Related Research


Special Issue
Launch a focused special issue to highlight research, emerging trends, and expert insights in your academic field.