


IntelliPaper
Abstract
The study examining effects of farming practices (Natural farming, Organic farming and Inorganic farming) on species richness and diversity of soil arthropods in major plantation crops (Arecanut, Coconut and Coffee) was conducted under different zones Hilly, Central Dry and Transition zone of Chikkamagaluru district, Karnataka from August 2023 to May 2024. Soil arthropods belonging to 12 different orders were collected under 5 classes viz., Entognatha, Arachnida, Insecta, Symphlan and Chilopoda. The highest numbers of individuals was observed in natural farming practice (1256) followed by organic farming (825) and least in inorganic farming (397). The highest number of soil arthropods was recorded in natural farming practice (31.90 individuals per 400g of soil) within the coconut ecosystem followed by organic farming practice 12.39 and lowest in inorganic farming practices with 5.39 individuals per 400g of soil in arecanut and coffee ecosystem, respectively. Shannon Weiner index showed highest diversity in natural farming system 2.13. Whereas, the lowest diversity was recorded in inorganic farming practices (Shannon-Wiener: 0.69). The abundance and diversity showed a significant difference between different farming practices i.e. natural, organic and inorganic farming practices in different zones. Natural farming practices followed by organic farming supported higher diversity indices and abundance of soil fauna compared to inorganic farming practices.
Explore Digital Article Text
I. INTRODUCTION
Soil arthropods, encompassing classes such as Crustacea, Arachnida, Myriapoda, and Insecta, are crucial components of soil ecosystems. These organisms are characterized by chitinous exoskeletons, segmentation and jointed appendages, enabling them to perform vital ecological functions. They contribute significantly to organic matter translocation, decomposition, nutrient cycling, and soil structure formation, all of which are essential for maintaining soil quality and health (Chethan et al., 2019, Nisa et al., 2017, Patil et al., 2013). Diverse arthropod communities are linked to enhance ecosystem stability and resilience to disturbances, making their assessment important for effective habitat management and conservation strategies (Menta et al., 2020, Nahmani et al., 2005). As integral members of soil food webs, these arthropods serve as valuable indicators of soil biological activity, influencing factors such as hydrology, aeration and nutrient dynamics.
However, intensive agricultural practices pose significant threats to soil arthropod diversity and overall soil health. The conversion of natural habitats to agricultural land leads to drastic changes in soil biological and chemical properties of soil, often resulting in biodiversity loss (Rossi et al., 2006, Shah, 2006, Shashidhara, 2016). These changes can negatively impact soil fauna abundance and activity due to altered temperature, moisture levels and organic matter availability (Edwards, 2004). Conventional farming methods, which heavily rely on chemical fertilizers and pesticides, disrupt natural ecosystem processes, further degrading soil quality. The widespread application of pesticides, while beneficial for crop production, has detrimental side effects, killing not only pests but also beneficial insects and other soil invertebrates, leading to environmental imbalances.
In contrast, organic and natural farming systems prioritize the enhancement of soil health and biodiversity by focusing on the management of soil organic matter and utilizing natural nutrient sources. These practices emphasize reduced soil disturbance, avoidance of synthetic chemicals, and the promotion of biodiversity through diverse planting and natural pest management strategies. Research has shown that conservation farming systems support greater arthropod abundance compared to conventional methods (Hole et al., 2005). Monitoring soil arthropod diversity is critical for assessing soil stability and ensuring sustainable agricultural practices. In this context the present study was conducted to assess the on abundance and diversity of various soil arthropods under different farming practices in major plantation crops.
II. MATERIALS AND METHODS
2.1 Study Area
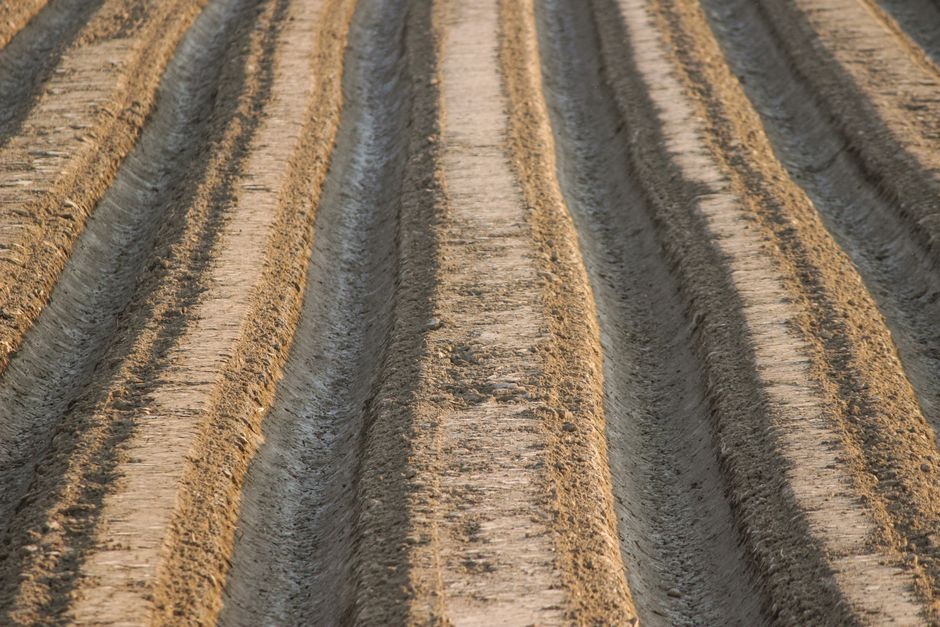
The study was conducted in three major plantation crop ecosystems: coconut, arecanut, and coffee across three different zones viz., hill zone (13.13°N, 75.64°E), Transition Zone (13.71°N, 75.81°E) and central dry zone (13.54°N, 76.00°E) taluks of Chikkamagaluru district. Soil samples were collected from farmers' plantation fields that had been practicing natural farming, organic farming and inorganic farming for over five years. The soil samples were randomly drawn from coconut, arecanut and coffee farming systems from August 2023 to May 2024.
2.2 Sampling Site
Natural farming: This research area had a good composition of weed mulch with grasses and herbs. The practice involved the application of Jeevamritha 200 litre per acre at monthly intervals.
Organic farming: This site practiced the addition of farm yard manure/ organic manure to the soil at 2 tonnes per acre. The plantations were free from weed mulches.
Inorganic farming: The plantations were applied with inorganic fertilizers at 2 splits per year and fertilizers used were urea, DAP, potash and complex form. The plots were free from weeds and no mulching practices followed.
2.3 Sampling Procedure
The samples were drawn near the root zone within the radius of from the plant. The surface litter and weeds were removed carefully from the sampling spot before sampling. Soil was collected by using circular core sampler measuring diameter and height. The core sampler was placed on the soil surface and pressed downward to a depth of in the sampling spot. Soil sample weighing 400 g was collected in three spots randomly from each plot and were immediately transferred to aluminum cans and closed with lid. Labeling was done on each can and brought to the laboratory for further analysis.
2.4 Extraction Technique of Soil Arthropods and Processing
The soil fauna was separated from soil sample using Tullgren funnel which consisted of a funnel with mesh screen, a glass vials and a light source. The glass vials was filled with of 75 per cent ethyl alcohol. The vials were periodically checked to keep the alcohol at desired levels. The collected soil samples were placed over the mesh fixed across wide end of each funnel. The electric bulbs were fixed at the top of the funnel setup that served as the source of light and heat energy. Light source of Tullgren funnel was switched-on for 48 hours to generate heat that led the micro-arthropods to move down passing through sieve of the funnel and get collected in glass vials. The arthropods collected were sorted using a stereo binocular microscope (35x magnification) and were identified up to order level following taxonomic keys.
2.5 Data Analysis
The recorded data on the total number of individuals arthropods species observed, in each samples were subjected to analysis of variance with square root transformation . The abundance of arthropods was compared among farming practices across different zones seasons using DMRT.
Shannon-Wiener Diversity index was computed using PAST program (Hammer et al., 2001).
The abundance and diversity of insect community were computed using Shannon's diversity index (H) which accounts for both abundance and evenness of the species.
Where, H represents the index of species diversity in a given locality
p_i is the proportion of species in the total sample and = Natural logarithm
Relative abundance was determined using the following equation
Where = species relative abundance
total number of individuals of a species in a given area total population of all species in the area
III. RESULTS AND DISCUSSION
3.1 Abundance of Soil Arthropods across Various Farming Practices
During the study period natural farming practices exhibited the highest abundance (1256 individuals) followed by organic farming practices (825 individuals) and lowest in inorganic farming (397 individuals). Highest individuals were recorded in class Entognatha followed by Arachnida, Insects, Symphyla and least was recorded in class Chilopoda. The majority of soil arthropods in these classes belong to orders: Diplura, Coleoptera, Hemiptera, Blattodea, Dermaptera, Diptera, Hymenoptera, Entomobryomorpha, and Scutigeromorpha and sub orders: Mesostigmata, Cryptostigmata (Table 1). These findings are similar to that of Deepika et al. (2020) who recorded a higher population of soil arthropods (1987 individuals) in an agricultural ecosystem with most individuals from Class Entognatha, Order Acarina, and Order Entomobryomorpha. Ojija (2016) also reported 1,719 arthropods across 63 species in grassland and woodland ecosystems. Compared to their findings, our study exhibited more abundance in natural farming followed by organic farming, which might be due to the availability of rich organic carbon, mulching practices and arthropods friendly soil and climatic conditions.
3.2 Relative Abundance of Soil Arthropods
A significant variation in the number of soil arthropods was observed among different farming practices Entognatha, Acarina, Insecta, Symphyla and Chilopoda which were most abundant in Natural farming (55.18%, 56.18%, 49.28%, 18.84% and 11.24% respectively), followed by Organic farming (33.11%, 34.98%, 32.13%, 31.88% and 40.45% respectively) and the least relative abundance observed in Inorganic farming (19.38%, 15.77%, 11.50%, 18.84% and 11.24% respectively) (Table 2). These findings align with Pahari et al. (2007) who reported that Acari constituted 47.04%, followed by Collembola (38.68%), while the other groups showed significantly lower dominance.
3.3 Abundance and Diversity of Soil Arthropods across Various Zones
Soil arthropod abundance varied significantly across different farming practices in various zones. In hill zone, natural farming plantation of arecanut and coffee showed the highest arthropod populations, averaging 26.70 and 20.00 per of soil, respectively. Organic farming practices recorded 17.23 and 15.09 individuals, while inorganic farming had the lowest numbers (8.15, 11.00, and 6.76 for arecanut, coconut and coffee respectively). Similar trend was observed among farming practices in transition zone and dry zone.
Overall, natural farming consistently supported the highest mean values of soil arthropods across all crops, while inorganic practices resulted in the lowest abundance and diversity, highlighting the significant differences in arthropod populations linked to farming methods across zones (Table 3). In contrast to our findings Hoole et al. (2005) found that most groups exhibited greater abundance or biomass under conservation systems than under conventional-tillage systems because the former causes fewer disturbances to their habitats, maintaining the structures that serve as shelter. Organic farming practices performed better than inorganic practices, indicating that they support higher soil arthropod populations than conventional chemical inputs. Inorganic farming practices were associated with the lowest soil arthropod counts, reflecting the negative impact of chemical inputs on soil health.
In plantation crops the species diversity of soil arthropods recorded significant differences across farming practices and zones. The highest diversity was noticed in the Natural farming practices in the Hill Zone in coffee followed by arecanut . While organic farming practices also recorded maximum diversity in the Hill Zone in arecanut. Least diversity was found in inorganic farming practices in transition zone (Table 3). These results support the findings of Gkisakis et al. (2014) who observed soil arthropods, in conventional, organic and integrated olive orchards where Hilly orchards showed significantly higher seasonal arthropod diversity and evenness. Selected habitats in this study were relatively undisturbed compared to organic and inorganic farming
IV. CONCLUSION
The abundance and diversity of soil dwelling arthropods in natural farming practices showed higher diversity indices and abundance, followed by organic farming practices and least were recorded in inorganic farming practices. The present study is the first time effort to investigate the abundance and diversity of soil arthropods in natural farming practice. This study will serve as a baseline for understanding soil dwelling arthropods groups. The practices with natural and organic farming showed greater abundance and diversity, which is due to addition of large amounts of organic residue inputs, which in turn increases the biological activity of soil arthropods due to the mulching practices followed. It also provided a more balanced and nutrient-rich environment compared to inorganic approaches potentially leading to better crop performance and soil health.
Table 1: Abundance of Soil arthropods across different farming practices
| Class | Order | Number of individuals | ||
| Natural farming | Organic farming | Inorganic farming | ||
| Entognatha | Collembola | |||
| Entomobryomorpha | 201 | 145 | 64 | |
| Poduromorpha | 30 | 12 | 9 | |
| Diplura | 122 | 89 | 71 | |
| Arachnida | Mesostigmata | 158 | 135 | 58 |
| Cryptostigmata | 170 | 98 | 47 | |
| Insecta | Coleopteran | 48 | 37 | 14 |
| Hemiptera | 32 | 18 | 6 | |
| Blattodea | 22 | 15 | 6 | |
| Dermaptera | 39 | 21 | 15 | |
| Diptera | 80 | 39 | 11 | |
| Hymenoptera | 137 | 74 | 21 | |
| Symphyla | Symphylan | 170 | 110 | 65 |
| Chilopoda | Scutigeromorpha | 47 | 32 | 10 |
| Total | 1256 | 825 | 397 | |
| Class | Natural farming (RA %) | Organic farming (RA %) | Inorganic farming (RA %) |
| Entognatha | 55.18 | 33.11 | 19.38 |
| Arachnida | 49.25 | 34.98 | 15.77 |
| Insecta | 56.38 | 32.13 | 11.50 |
| Symphyla | 49.28 | 31.88 | 18.84 |
| Chilopoda | 52.81 | 40.45 | 11.24 |
| Crops | Farming practices | Hill zone | Transition zone | Central Dry zone | Mean abundance | |||
| Abundance | Ho | Abundance | Ho | Abundance | Ho | |||
| Arecanut | Natural | 26.70 (5.21a) | 1.81 | 21.15 (4.65a) | 2.02 | 17.84 (4.28a) | 1.69 | 21.9 (4.73b) |
| Organic | 17.23 (4.21b) | 1.97 | 12.0 (3.53b) | 1.72 | 7.96 (2.90b) | 1.61 | 12.39 (3.59c) | |
| Inorganic | 8.15 (2.94d) | 0.69 | 5.85 (2.51d) | 0.81 | 3.50 (2.00d) | 0.90 | 5.83 (2.52d) | |
| *Coconut | Natural | - | - | 22.44 (4.78a) | 1.91 | 18.93 (4.40a) | 1.77 | 31.90 (5.69a) |
| Organic | - | - | 9.0 (3.08c) | 1.71 | 6.67 (2.67bc) | 1.68 | 7.8 (2.89d) | |
| Inorganic | 11.0 | 0.78 | 6.29 | 0.85 | 4.58 | 0.81 | 7.2 | |
| (3.39cd) | (2.60c) | (2.25cd) | (2.79d) | |||||
| **Coffee** | Natural | 20.0 (4.52b) | 2.13 | 16.00 (4.06a) | 1.86 | - | - | 18.00 (4.30b) |
| Organic | 15.0 (3.9c) | 1.79 | 12.63 (3.62b) | 1.75 | 7.18 (2.77bc) | 1.58 | 11.63 (3.48c) | |
| Inorganic | 6.76 (2.69e) | 0.85 | 5.4 (2.42cd) | 0.91 | 4.03 (2.12bc) | 0.72 | 5.3 (2.43d) | |
| S.Em± | 0.12 | 0.10 | 0.1 | 0.10 | ||||
| CD at 5% | 0.38 | 0.31 | 0.30 | 0.33 | ||||
Note: Figures in parentheses are transformed values. Means followed by the same letter do not differ significantly by DMRT ( )
Shannon - weiner diversity index
*Coconut plantation observed only in inorganic plantation. In hill zone non-availability of plantation with organic and natural farming practice.
Coffee plantation observed only in organic and inorganic plantation. In central dry zone Non availability of plantation with natural farming practice
Conflict of Interest
The authors declare no conflict of interest.
Ethical Approval
Not applicable
Data Availability
The datasets used in this study are openly available at [repository link] and the source code is available on GitHub at [GitHub link].
Funding
This work did not receive any external funding.
Cite this article
Related Research

Special Issue
Launch a focused special issue to highlight research, emerging trends, and expert insights in your academic field.
