




IntelliPaper
Abstract
Using finite element analysis, the eigenmodes of the optical waveguide whose refractive index vary in the radial direction was obtained. To perform efficient calculations, the cross section of the waveguide was divided into a mesh structure of triangular element. The eigenmatrix equations that describe the characteristics of eigenmode were composed of the edges and nodes of triangular elements. The eigenmodes were established with transverse electric field, and electric potential. These were represented schematically as 2-Dim electric field, 3-Dim electric potential and 2-Dim electric equipotential contour. These representations were arranged sequentially from the lower order eigenmodes. And the unusual ones were randomly organized regardless of ordering index to reveal their characteristics more clearly. From these results, it was found that the refractive index distribution adopted in this study sufficiently performed the function of focusing electromagnetic waves in the central region.
Explore Digital Article Text
I. INTRODUCTION
Previously, we have studied eigenmodes established in the optical waveguides of various types using FEM (Finite Element Method) [1][2]. We also discussed the eigenmodes generated in multiple photonic crystal waveguides [3][4]. In the studies, air or dielectric holes were arranged symmetrically according to the geometry of the photonic crystal waveguide. It would be well known that photonic crystals can confine electromagnetic waves to a specific region and being able to control eigenmodes according to the spatial arrangement of dielectric holes. The refractive indices of these studies mainly were distributed step like. In general, the established eigenmode in the waveguide and the photonic crystal fiber reflect spatial distribution of the refraction index. From these studies, we had identified that they showed unique characteristics of eigenmode in an orderly and consistent manner. Optical fibers with stepped refraction are suitable only for data link of short range. Because the propagation power loss is not negligently slightly. The power loss is due to slightly difference of path shift between the neighbor electromagnetic waves which cause interference and distortion of the information.
The waveguide with multimode graded index is designed to overcome these shortcomings and propagate electromagnetic signals through long distances. This waveguide utilizes the Snell principle, which states that the more considerable refractive index, the smaller the angle of refraction. The refraction value is high at the centre, and decreased as going to clad gradually. Therefore, the destructive interference of electromagnetic waves is weakened and they can be concentrated at one point on the central axis and propagate long distances. This concept was attended from the long time ago and is already being applied in the varied areas . However, only a few analytical solutions for the eigenmodes generated in this waveguide have been presented. As the refractive index changed in the waveguide, solving the Helmholtz equation becomes to be more complicated. To obtain a solution by applying this equation to a realistic physical system, constrained conditions must be imposed on the problem and satisfied only with an approximate result. At present, to know the properties of the eigenmode of a graded refractive waveguide, its characteristics must be understood through numerical analysis such as FEM etc.
In this study, FEM is carried out to investigate the eigen properties of the multimode coaxial optical waveguide with graded refractive index. To facilitate for calculation of FEM, the cross-section of waveguide is decomposed into a mesh of triangle elements. The Helmholtz equation, which describes the eigenmodes of the waveguide, consists of the edges and nodes of these triangle elements. The solution to this equation is expressed as an edge vector describing the electric field at the center of the triangle, and the value of each node representing the electric potential at any element's position. The eigen equations are proportional to the number of triangle elements of the mesh. To increase the eigenmode resolution, the density of triangle elements must be increased. Then, the size of the eigen equation become more increased and a computer with more significant calculating capacity is needed.
However, because the capacity of personal computers is limited, it isn't easy to handle the inverse matrix of the large-size eigen equation. To overcome this contradiction, FEM uses the Arnoldi algorithm to compress the matrix equation into the smaller one, as mentioned in the previous manuscript. Afterwards, the Krylov-Schur iteration method is used to find several prominent eigenmodes with the highest reliability [6][7]. This method is used in this study to find the desired several eigenmodes.
Eigenmodes consist of electric fields and potential pairs. These constitute the column matrix of the similarity transformation matrix used in the iterative method. The mathematical derivation process for FEM has been mentioned in a previous manuscript . Therefore, this process is not mentioned again in this manuscript. In other words, the theory of FEM is omitted in this manuscript. The description format of this manuscript deviates from the existing order and is described as follows. This manuscript describes the structure of waveguide, the result and discussion, and conclusion in order.
II. THE STRUCTURE OF THE WAVEGUIDE AND THE SIMILARITY TRANSFORM MATRIX
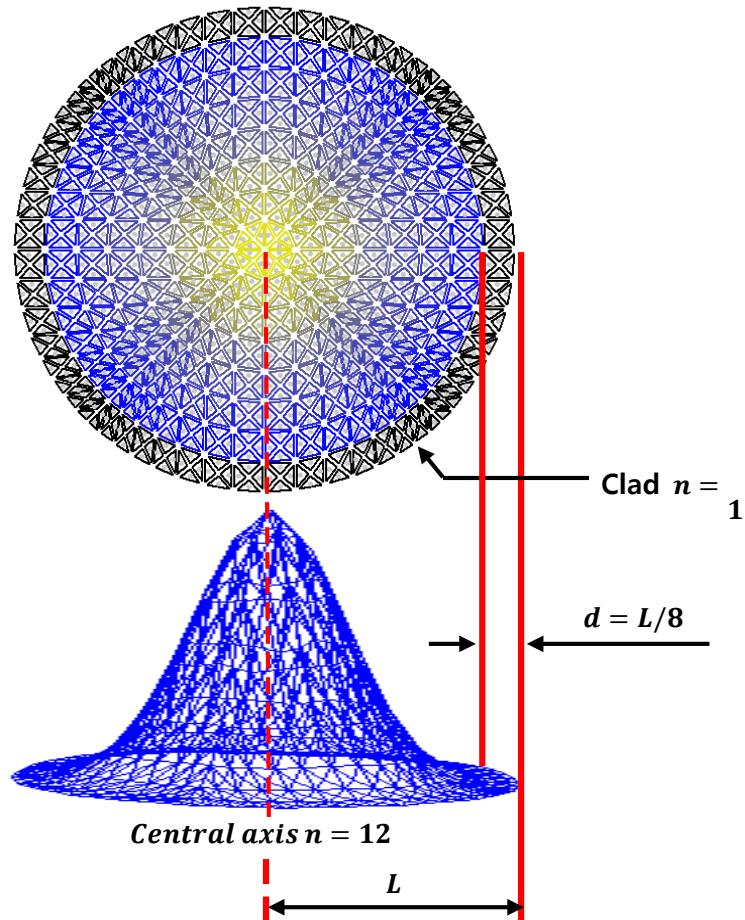 Study of the Eigenmodes of an Optical Waveguide with a Refractive Index that Varies in the Radial Direction from the Central Axis As mentioned in the introduction, a factor that made a significant influenced on the eigenmode establishment in a waveguide is the refractive index in the direction perpendicular to that of electromagnetic wave propagation. The coaxial waveguide used in this study has a structure that gradually changes the refractive index of the core inside the clad through which electromagnetic waves propagate. As shown in Figure 1, the refractive index has a value of 1.0 at the clad and gradually increases up to 12.0 as it approaches the central axis. As the refractive index of the medium increases, the speed of electromagnetic waves is lower than in a vacuum, so the path it travels here is relatively small. Conversely, in places where the refractive index is smaller, the speed of light propagation is relatively faster so that more length it travels at the same amount of time. If the refractive index is increased gradually as approaching to the center, the destructive interference of monochromatic light which incident on the cross-section of the waveguide becomes smaller. Therefore, it is easier to focusing electromagnetic waves on the central axis.
In this study, the refractive index is designed to achieve a spatial distribution of cylindrical symmetry by reflecting the geometric characteristics of the waveguide as much as possible. Therefore, it is expected to act as a positive factor in forming the eigenmode of the multimode-graded refractive index waveguide and improve the resolution of the spectrum. The cross-section of the waveguide is divided as a mesh structure composed of triangle elements, as shown in Figure 1. The refractive indices corresponding to the triangle elements are shown in yellow for the cylindrical central part, blue for the outer part of the core, and black for the inside of the cladding, indicating sequentially the relative magnitudes of the refractive indices.
The edges and nodes of a triangle are essential elements of the eigenmatrix equation. The Helmholtz matrix equation, which describes the eigenmodes formed in the waveguide, consists of a vector component of the edge that represents the electric field and a nodal scalar element that defines the electric potential. The eigenmode is obtained by diagonalizing the matrix equation through similarity transformation. The diagonal components of the resulting Schur matrix represent eigenvalues. However, in this study, to obtain the most ideal shape of the eigenmode, the geometric size of the waveguide was changed and the refractive index was adjusted accordingly.
Therefore, as eigenvalues are not always the same in each calculation, these values are excluded from the results and discussion. The column component of the similarity transformation matrix consists of vector edges and scalar nodes related to electric field and electric potential values, respectively. The electric field is expressed at the barycentric point by combining the edge components of the triangle element, which are vector components. The equipotential contour is obtained by combining the nodal components of the triangle elements. The values at the nodes are combined to find at the point on each edge, and connecting them with to depict the equipotential line. In this study, the eigenmodes are represented as schematically of 2-dim electric field, 3-dim electric potential and 2-dim electric equipotential contours results.
The eigenmode is calculated by dividing the matrix equation into TM (Transverse Magnetic) and TE (Transverse Electric) modes. In FEM calculations, TM and TE modes are distinguished by boundary conditions set on the surface of the waveguide. In this study, it is assumed that the surface of waveguide is a PEC (Perfect Electric Conducting) boundary. In this case, the electric field calculation of TM mode is performed by applying Dirichlet boundary conditions to the. In other words, when obtaining the electric field of TM mode, the calculation is performed by canceling the components of edges and nodes on the surface of the waveguide from the eigenequation. As mentioned in the previous study, the eigenmodes are expressed only as an electric field of TM mode. Because in FEM calculations the magnetic field is obtained through the same process as in the electric field. Then, the eigenequations are reduced by their number, allowing only the tangential component of the electric field and excluding the perpendicular component. The resulting electric fields and potentials for each mode are subdivided and shown with the schematic representations.
III. RESULT AND DISCUSSION
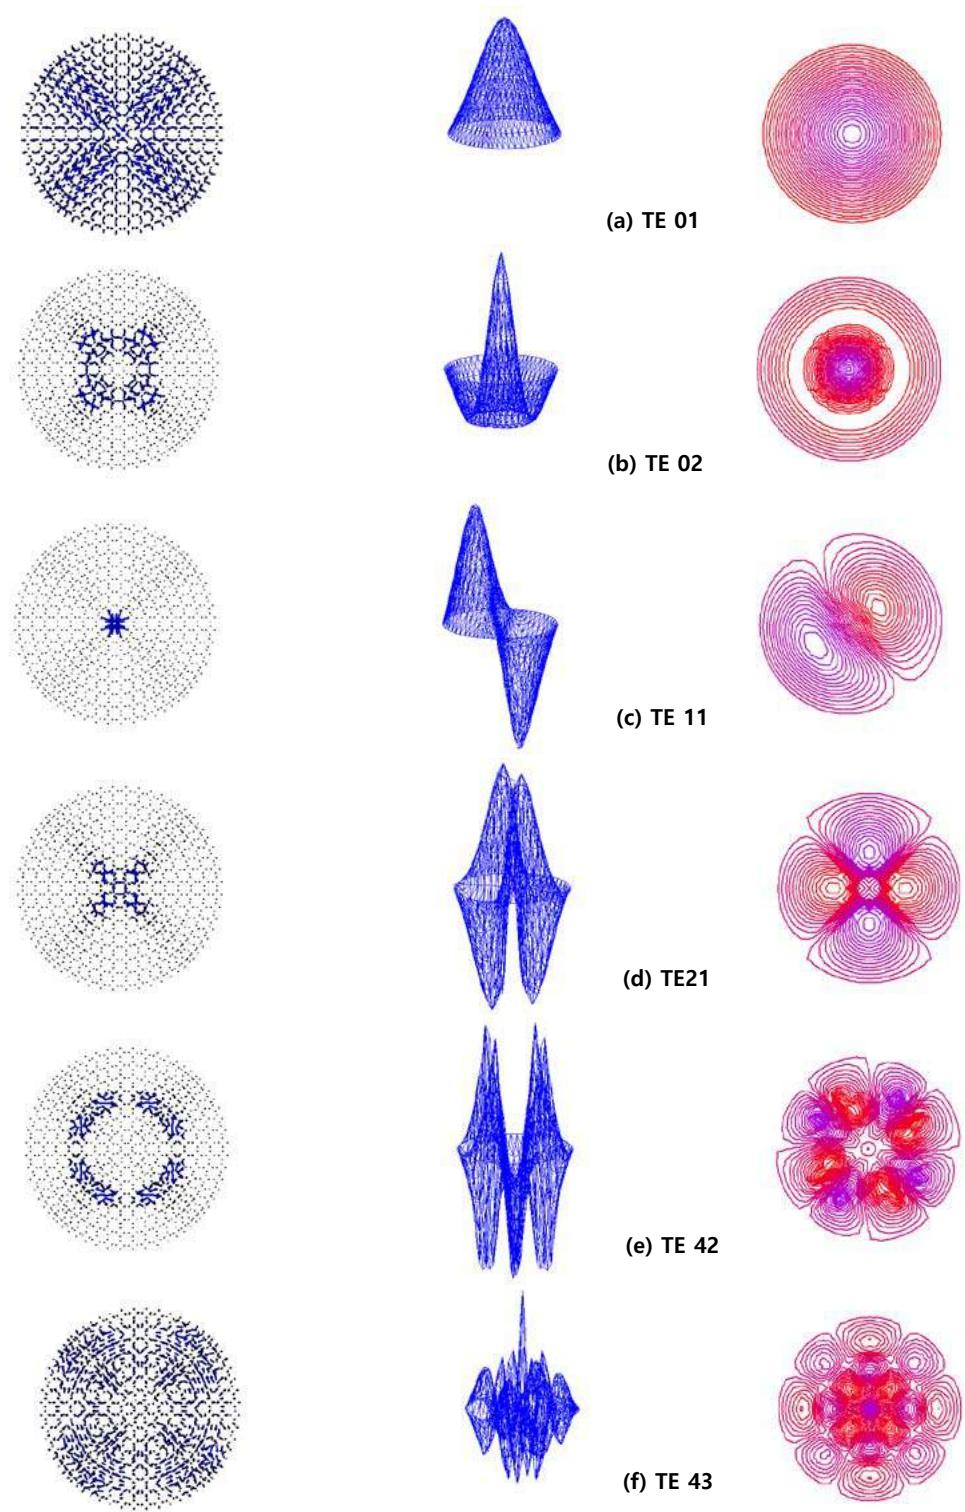 Figure 2: The Schematic Representation of TE Eigenmodes
Figure 2 shows a schematic representation of the TE eigenmodes. These were selected as the eigenmodes of the highest resolution possible.
They were sequentially arranged from the lowest to the highest order eigenmodes. Physical analysis of eigenmodes achieved through electric fields or potentials. As can be seen above, the representation of electric potential is generally more explicit than that of the electric field, and its characteristics can be manifestly discussed. TE and TM modes are distinguished by whether or not the surface of the waveguide is considered PEC during the process of FEM calculation. If the calculation is performed with excluding the surface component, the result with its tangential component of electric field removed is obtained. The electric field component is obtained by taking the spatial gradient of the electric potential.
Figure 2 is the eigenmodes generated in the waveguide expressed as 2-dim electric field, 3-dim electric potential, and 2-dim electric equipotential contours. The 2-dim equipotential contours shown in Figure 2 all take the form parallel to the surface of the waveguide. Their spatial gradient relative to the equipotential contour represents the electric field perpendicular to the surface and describes a typical TE mode. In describing the eigen properties of a waveguide, the electric potential and equipotential contours have a precise shape, but the electric field does not. Therefore, the physical understanding of eigenmodes is achieved through the above two representation, and the electric field is only auxiliary.
Figure 2(a) shows that, according to the spatial distribution of the refractive index, the eigenmode spreads out symmetrically around the circular waveguide. The 3-dim expression for electric potential shows the most incredible intensity at the centre, and the value decreases toward the outskirts, forming a bell shape. This form is presented the most stable eigenmode. And is expected to be able to propagate long range with the reliable and robust property. In the field of optical communications, this eigenmode is used to transmit and receive high energy signal. Unless there is a particular purpose, this eigenmode will be the most preferred waveform in this field. For this spectrum, the eigenmode of TE 01 is imposed in this study. When real-world optical waveguide is made, the surface is not made of PEC. Hence, the tangential electric field is not zero, and energy can dissipate out the waveguide surface. It has been well known that TE 01 mode of a circular waveguide is the lowest of power loss due to symmetry.
 Figure 3: The Schematic Representation of TM Eigenmodes
As the ordering of the mode is increased, the shape of the eigenmodes is more complexed. But some degree of systematicity can be found among them. Figure 2(b) shows eigenmodes represented by two discontinuous concentric circles while maintaining circular symmetry. The 3-dim eigenmode for electric potential shows the most incredible intensity at the centre, like TE 01 mode. And although the potential value decreases toward the outskirts, the wave disappears at a specific location between the centre and the clad and then increases again. Since there is no discontinuity in the azimuth direction and circular symmetry is maintained, the eigenmode of this spectrum can be named TE 02. Eigenmode TE 02 can also perform an excellent function in transporting information or power. However, in practical applications, mode filters enhance the TE 01 eigenmode and impede the guidance of other modes [8][9]. As the ordering of the mode increases, the azimuth components appear, and the eigenmodes become more complex. Among these, the simplest and most likely eigenmode is TE 11. They appear symmetrically ordered around the waveguide axis. Nevertheless, in reality, they are not used. In this study, these spectra were investigated to identify the diversity of eigenmodes depending on refractive indices.
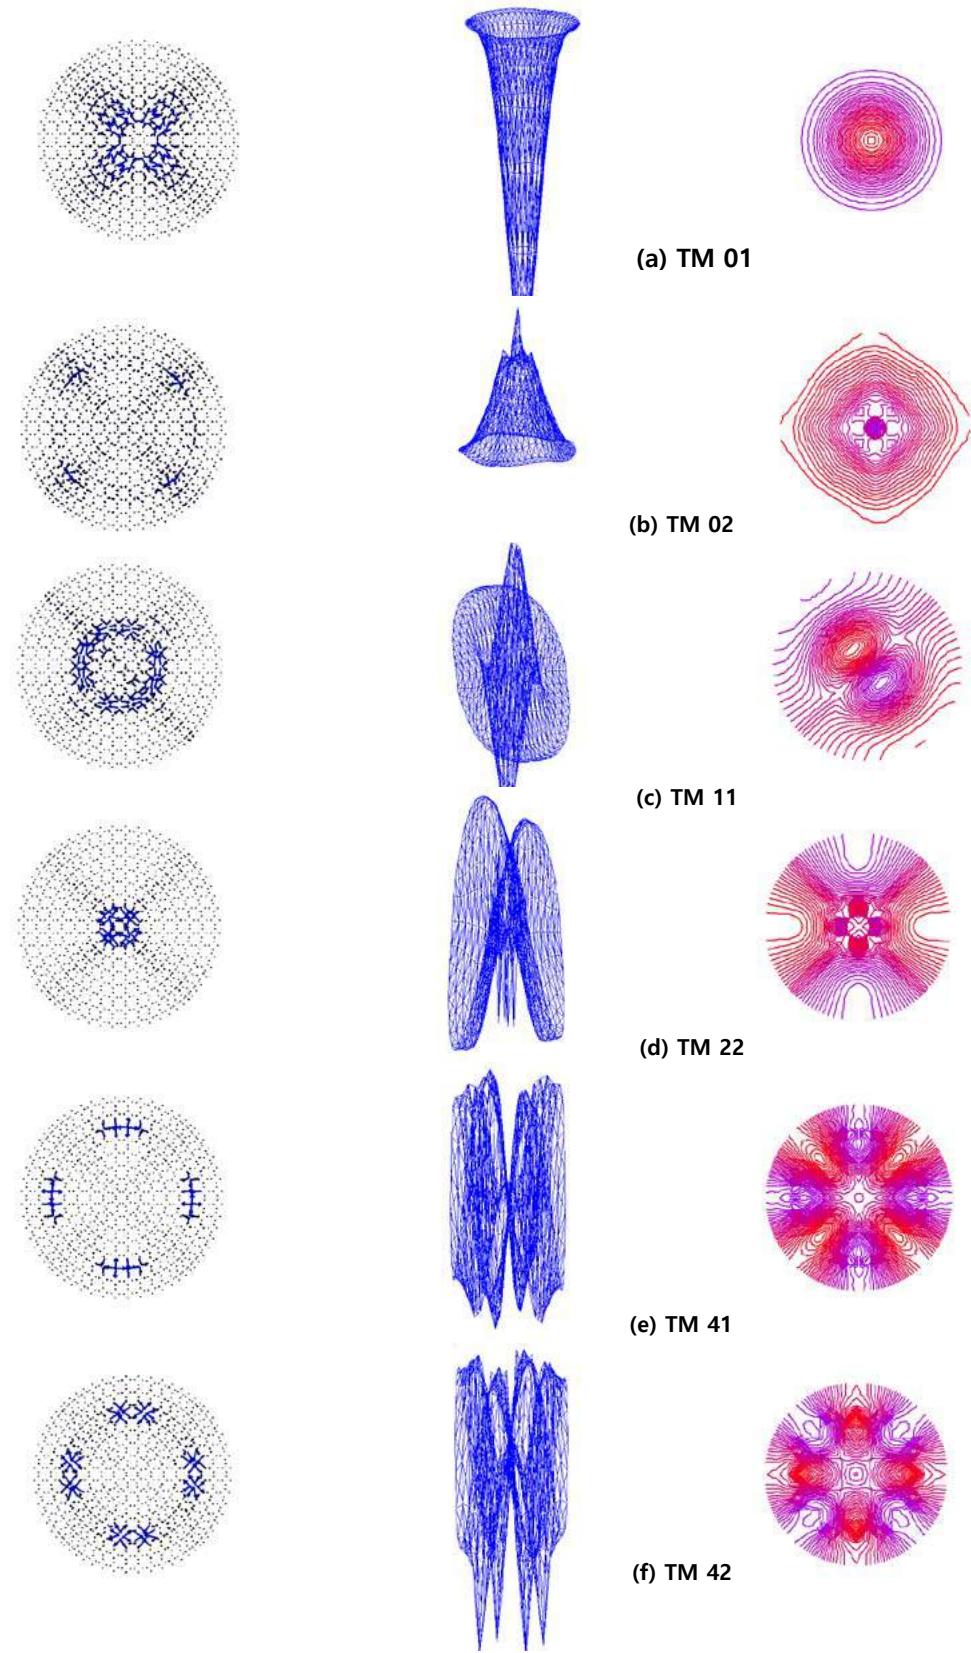
Figure 3 is a schematic representation of the eigenmodes of TM modes. As like shown in Figure 2, the resolution of electric potential for the eigenmode is more than that of electric field. Therefore, analysis and understanding of eigenmodes are based on the 3-dim electric potential and 2-dim equipotential contours. The electric field only plays an auxiliary role as like TE mode. The electric field describing the TM mode, unlike the TE mode, forms only a tangential component parallel to the surface of the waveguide. As can be seen in the figure, since the electric potential represents only the component perpendicular to the surface, the spatial gradient for it represents the tangential component of the electric field.
Figure 3(a) is a schematic representation of the eigenmode TM 01. Compared to the shape in Figure 3(a), the difference is clearly identified in the 3-dim electric potential image. First of all, the intensity of the TM 01 eigenmode is much greater than that of TE 01. The TM 01 component of the electric potential formed on the surface of the optical waveguide reflects the refractive index well compared to the TE 01. This eigenmode, like that of TE 01, can easily transmit signals or power with little energy loss. The surface of the optical waveguide is assumed to be coated with PEC. The edges and nodes on the surface are omitted in the calculation of FEM for TE mode. In the case of TE mode, a tangential electric field does not appear on the surface, and only a tangential component of the electric potential is exhibited. However, in the case of TM mode, the tangential component of the electric field appears on the surface, and the perpendicular component of the electric potential is exhibited. Near the extended rim, including the surface of the optical waveguide, components of the eigenmode electric field and potential appear.
When comparing the 3-dim electrical potentials, the surface components in Figures 2 and 3 clearly distinguish the characteristics of TE and TM. As the ordering of modes is increased, like does the TE mode, azimuth components appeared and the eigenmodes become more complexed. In Figure 3(b), the eigenmode is named TM 02, and the electric potential at the surface is transformed from a circularly symmetrical structure, and the vertical component appears to it weakly. The electric field that appears along with this is so complex that the eigenmode cannot be determined by itself. This type of phenomenon occurs when the refractive index of the waveguide is not uniform and changes in the space [10]. The refractive index plays a role in concentrating electromagnetic waves in a particular area, but at the same time, it also takes on the complexity of the eigenmode. The following spectrum includes both azimuth and radial components in the core region of waveguide. From its shape, the eigenmode can be determined as TM 11. Compared to TE 11, the vertical component of the potential at the surface is evident, allowing the action of PEC to be confirmed. Changes in refractive index and the presence of PEC add complexity to eigenmode generation in optical waveguides. As for the remaining eigenmodes, the azimuth and radial components increase as in TM 21, promoting spectrum diversity. They exhibit the characteristics of a multi-graded refractive optical waveguide, but if they coexist with the TM 01 mode, they must be quenched through a mode filter. Otherwise, it will act as noise that infringes on the primary signal, such as TM 01.
VI. CONCLUSION
The eigenmodes for the graded refractive optical waveguide were investigated by FEM. The eigenmodes were divided into TE and TM modes and shown in a schematic representation. The eigenmodes TE and TM were identified based on the 2-dim electric equipotential contour, which is determined through the eigen characteristics to the surface of the optical waveguide. The electric equipotential contours were dominated by the tangential component to the surface for the TE mode and the perpendicular one for the TM mode. Among those spectra, the propagation characteristics of the electromagnetic wave in the optical waveguide were discussed through TE 01 and TM 01 eigenmodes.
Conflict of Interest
The authors declare no conflict of interest.
Ethical Approval
Not applicable
Data Availability
The datasets used in this study are openly available at [repository link] and the source code is available on GitHub at [GitHub link].
Funding
This work did not receive any external funding.
References
Cite this article
Related Research



Special Issue
Launch a focused special issue to highlight research, emerging trends, and expert insights in your academic field.
