

IntelliPaper
Abstract
Scanty information is available about importance of feeding of Tinospora cordifolia on the health and production of livestock. An investigation was conducted to study the effect of different levels of Tinospora cordifolia in HDK – 75 pigs. Twenty Four (24) number of pigs were randomly divided into four groups i.e. Control, T1, T2, and T3 groups containing six (6) animals in each group. The T1, T2, and T3 groups were the treatment groups where the stem of Tinospora cordifolia (Giloy) were dried and in powdered form were given @ the rate of 0.5 %, 1.0 % , 1.5 % respectively mixed with rations. . The experimental rations were prepared according to BIS 1994 during 180 days experimental period. Compared to control and T1 group, by supplementation of Tinospora cordifolia the average daily body weight gain was seen highest T3 group (P 0.05 ) has been seen between the treatment and control groups. Histopathological study and blood parameters shows that supplementation of Tinospora cordifolia does not have any negative effect on liver and kidney. But supplementation of Tinospora cordifolia shows positive changes in T3 group compared to control group.
Explore Digital Article Text
I. INTRODUCTION
As we all know that there are many therapeutic herbs in India. Assam is the regions with abundant biodiversity that are still perhaps undiscovered. Indigenous people's traditional knowledge regarding cultivated and wild veterinary medicinal herbs has not well documented in the state. Overuse of antibiotics and antibiotic resistance issue has diverted its attention to the use of herbal plants, medicinal plants in feed of livestock. Also it has been reported that the use of different herbal extracts in livestock feeding due to its property of improving feed digestibility, feed intake and maintenance of intestinal microbiome which results in improvement of immune system (Lei et al.; 2018, Namkung et al.; 2004). One such plant that is found in different parts of Assam is Tinospora cordifolia also known as Giloy which is known for its multipurpose effect such as like anti-diabetic, anti-periodic, anti-spasmodic, anti-inflammatory, anti-arthritic, anti-oxidant, anti-allergic, anti-stress, anti-leprotic, anti-malarial, hepatoprotective, immunomodulatory and anti-neoplastic activities. Alkaloids, steroids, diterpenoid lactones, aliphatic and glycosides are just a few of the active ingredients that have been extracted from the plant's various parts, including the root, stem and entire plant (Upadhyay et al.; 2010). In Assam, it is locally known as Saguni Lota which means plants with more than 100 numbers of properties. There are few reports on the use of feeding of Tinospora cordifolia (Giloy) in pig diet.
Tinospora cordifolia (Giloy) is a plant whose all the different parts i.e. leaves, stem, roots are beneficial. In Ayurveda it is known as "AMRITA" which means immortal. In livestock farming, feed is one of the most expensive component which covers the maximum share of the total cost of production. The highest pig population is situated in North East and maximum human population is pork eater. Considering all the above factors regarding the various pharamacological activities of Tinospora cordifolia (Giloy), the present study was conducted with an aim of studying the effect of Tinospora codifolia stem on growth performance of HDK-75 pigs. The Tinospora codifolia supplementation will pave the road as therapeutic supplementation for metabolic alterations in animal body system.
II. MATERIALS AND METHODS
This experiment was conducted in All India Co-ordinated Research Project Khanapara, Guwahati – 22. The study was conducted after approval from the Institutional Animal Ethics Committee (IAEC), AAU, Khanapara, vide approval No. 770/GO/Re/S/03/ CPCSEA/ FVSc/AAU/IAEC/22-23/1025 dated 23.03.2023.
2.1 Animal Distribution, Housing and Management
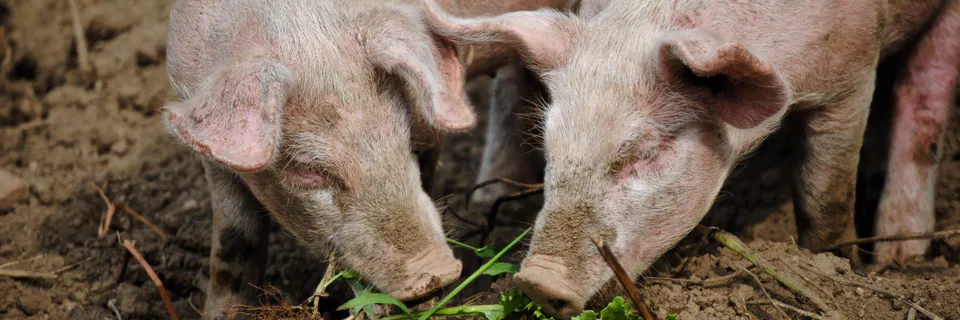
Thirty (30) number of HDK - 75 (Hampshire desi Khanapara) pigs (Fig 1) with an average body weight kg were selected (Fig 2) after weaning from AICRP on pig, Khanapara, Ghy-22 which were bred, born and raised at the AICRP pig farm. The pigs were divided into four experimental groups viz., C, T , T and T consisting of 6 pigs in each group, considering each pig as a replicate with individual feeding system on body weight basis following Randomized Block Design. The feeding experiment was conducted for 6 months (180 days). The pigs were kept in well ventilated pen.
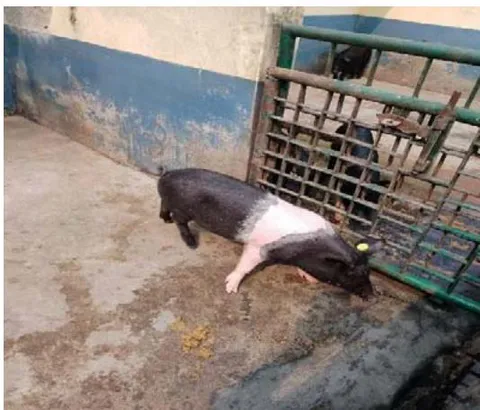
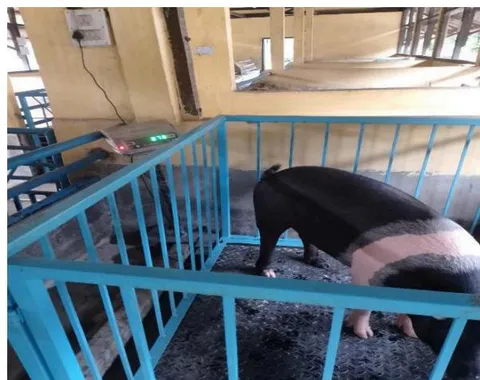
The experimental rations were prepared according to BIS (2001) and presented in Table 1. The four rations comprising of four levels of Tinospora cordifolia powder 0%, 0.5%, 1.0% and 1.5% (Table 2).
| Ingredients | Quantity (kg) | |
| Grower | Finisher | |
| Maize | 50 | 42 |
| Wheat Bran | 20 | 35 |
| De - oiled GNC | 20 | 12 |
| Soyabean Meal | 8.5 | 9 |
| Mineral Mixture | 1.0 | 1.5 |
| Salt | 0.5 | 0.5 |
| Total | 100 | 100 |
| Groups | Experimental Diets |
| Control (C) | Basal diet |
| Basal diet + 0.5% Giloy Powder | |
| Basal diet + 1.0% Giloy Powder | |
| Basal diet + 1.5% Giloy Powder |
The weighed quantity of diets according to the requirement were offered twice daily at 9 AM and 3.30 PM. The feed residue were collected and weighed the next morning daily and weekly interval it was composited to determine the dry matter. Body weight was taken at zero (o), mid and end of the experiment. Ad libitum water was given to all animals of each group.
2.3 Collection of Tinospora Cordifolia Stem
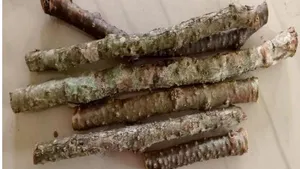
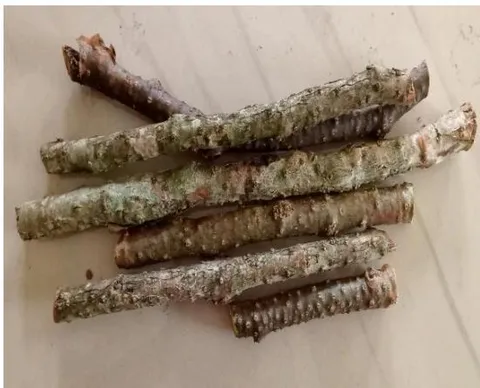
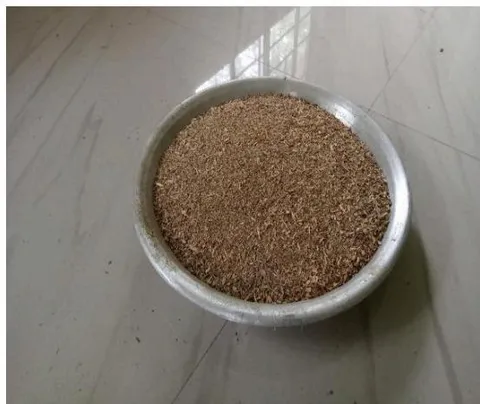
The Tinospora cordifolia stem (Fig 3) was collected from the area. The stem was dried and make in powder form (Fig 4) and kept in Air tight container. The sample were analyzed for various proximate principles viz., dry matter, organic matter, crude protein, ether extract, crude fibre, total ash and acid insoluble ash (AOAC, 2012). The samples were analyzed for calcium as per method described by Talpatra et al. (1940) and inorganic phosphorus as per method of Fiske and Subbarao (1925). The NDF and ADF was analyzed according to Van Soest (1963).
2.4 Proximate Analysis of Experimental Diet
The chemical composition of the four experimental rations was analyzed as per AOAC, 2000. The fibre fractions i.e. neutral detergent fibre (NDF) and acid detergent fibre (ADF) were done according to Van Soest 1994.
2.5 Period of the Experiment
The experiment was conducted for the period of 180 days. By the end of the experiment digestibility trial was conducted in all animals for the period of seven (7) days.
2.6 Statistical Analyses
The Experimental design that analysed either by one way or two-way ANOVA followed by multiple comparison using Duncan Multiple Range Test (Duncan, 1955) at 5% level of significance. All the analysis was carried out using the statistical software R (version 4.1.3).
2.7 Parameters to be Studied in Animals
During the experiment fortnightly change in body weight (kg), daily feed intake (kg) of all individuals animals, nutrient utilization were observed. The feed, residue and faeces were collected during the digestibility trial for the proximate analyses and faeces were also collected for microbial count
2.7.1 Blood Biochemicals
Blood was collected at the beginning, mid and at the end of the experiment from all the animals of each group to estimate serum total protein, glucose, Lipid profile (HDL.LDL), Total antioxidant activity and enzyme profile (Serum GGT, BUN, Creatinine). The protein, glucose, BUN was estimated using Aspen Kit, Lipid profile, GGT, Creatinine was estimated by using Accurex Kit, SOD was analyzed using Sigma Aldrich kits All the analyses was done as per the methods recommended by manufacturer.
2.7.2 Antioxidant Activity
Antioxidant activity was determined by SOD (Sodium Oxide Desmutase) estimation. At first, blood was collected in tube containing anticoagulant. They were centrifuge at 2000xg for 15 minutes and plasma was removed. Then 1 ml chilled normal saline solution (0.45 g NaCl in 50 ml distilled water) was added and centrifuged at 2000xg for 5 minutes. The supernatant was discarded and step no 4 to 6 were repeated for two times. Then normal saline solution was discarded. 100 microliter of RBC pellet was taken out in a glass test tube containing 9.9 ml of distilled water thus making 1% hemolysate. They were then incubated in ice for 30 minutes and the hemolysate was stored in C till further use. Then protein content of hemolysate is determined using the kit Sigma Aldrich and the SOD is expressed as mg/gm of hemolysate protein.
2.8 Histopathology
At the end of the trial five (5) animals from each group were slaughtered for histological and ultrastructural studies. After sacrifice, lymphoid organs viz., spleen, thymus, duodenum, liver and kidney were collected for the histological and ultrastructural studies. After collection, the tissue samples were fixed in 10% neutral buffered formalin. The weight of all the organs were recorded with the help of electronic pan balance. The different biometrical parameters viz, the length, breadth and thickness were recorded by Vernier callipers (Mc Cance, 1974). For histological and micrometrical study tissue samples were collected from spleen, thymus, duodenum, liver and kidney from both control and each Tinospora cordifolia treatment groups of pigs.. Those samples were processed to prepare paraffin blocks as per the standard method of Luna (1968). The paraffin blocks were sectioned in Shandon Finesse microtome in 5μm thickness and the sections were stained by Mayer's Haematoxylin and Eosin stain as per the procedure of Luna (1968). After staining, histological features of spleen, thymus, duodenum, liver and kidney were observed. Different micrometrical measurement of organs of both the species were recorded on Haematoxylin and eosin-stained section by means of standard method of micrometry using Nikon E 200 camera mounted microscope and Image Pro Express Ver-2.0 Software. For ultra-structural studies, the spleen, thymus and duodenum of Control and T3 group of pigs were utilized. The tissue samples were processed as per techniques of Parsons et al. (1991) and slightly modified by IASST
2.9 Animal Ethics Statement
The study was conducted after approval from the Institutional Animal Ethics Committee (IAEC), AAU, Khanapara, vide approval No. 770/GO/Re/S/03/ CPCSEA/ FVSc/AAU/IAEC/22-23/1025 dated 23.03.2023.
III. RESULTS & DISCUSSION
3.1 Proximate Composition of Feeds
The Chemical compositions of the grower and finisher ration fed to the experimental pigs have been presented in Table 3.
| NUTRIENT (%) | GROWER RATION | FINISHER RATION | ||||||
| Control | Control | |||||||
| Dry Matter | 90.65 | 90.62 | 90.68 | 90.66 | 90.84 | 80.82 | 90.80 | 90.81 |
| Crude Protein | 19.98 | 19.95 | 19.96 | 19.97 | 18.11 | 18.15 | 18.17 | 18.14 |
| Crude Fiber | 4.23 | 4.25 | 4.21 | 4.24 | 6.12 | 6.10 | 6.11 | 6.13 |
| Ether Extract | 3.12 | 3.11 | 3.11 | 3.13 | 3.89 | 3.85 | 3.87 | 3.88 |
| Nitrogen Free Extract | 64.99 | 65.05 | 65.07 | 64.99 | 63.98 | 64.00 | 63.65 | 63.75 |
| Total Ash | 7.68 | 7.64 | 7.65 | 7.67 | 8.10 | 7.90 | 8.20 | 8.10 |
| Organic Matter | 92.32 | 92.36 | 92.35 | 92.33 | 91.90 | 92.10 | 91.80 | 91.90 |
| Calcium | 2.01 | 1.99 | 2.03 | 2.05 | 1.85 | 1.87 | 1.88 | 1.84 |
| Phosphorous | 0.68 | 0.69 | 0.67 | 0.67 | 0.73 | 0.71 | 0.72 | 0.74 |
| ME (Kcal/kg)* | 3750 | 3750 | 3769 | 3753 | 3692 | 3692 | 3690 | 3693 |
3.2. Chemical Composition of Tinospora Cordifolia (Giloy) Stem Samples
The chemical composition (DM, CP, CF, EE, TA, calcium and phosphorous) of Tinospora cordifolia have been presented in Table: 4. The Tinospora cordifolia stem powder contained 25.33 ± 0.09% dry matter, 8.53 ± 0.03% crude protein, 16.85 ± 0.00% crude fiber, 2.49 ± 0.01% ether extract, 66.85 ± 0.09% nitrogen free extract, 5.35 ± 0.00% total ash, 0.68 ± 0.00% calcium, 0.12 ± 0.00% phosphorous, 31.20 ± 0.00% NDF and 20.11 ± 0.01% ADF on the basis of dry matter content.
| Attributes | Composition |
| DM (%) | 25.33 ± 0.09 |
| CP (%) | 8.53 ± 0.03 |
| EE (%) | 2.49 ±0.01 |
| CF (%) | 16.85 ± 0.00 |
| TA (%) | 5.35 ± 0.00 |
| AIA (%) | 1.22 ± 0.00 |
| OM (%) | 94.65 ± 0.00 |
| NFE (%) | 66.85 ±0.09 |
| NDF (%) | 31.20 ± 0.00 |
| ADF (%) | 20.11 ± 0.01 |
| CALCIUM (%) | 0.68 ± 0.00 |
| PHOSPHOROUS (%) | 0.12 ± 0.00 |
3.3 Body Weight of the Pigs and Feed Intake
The average initial body weight of pigs of C, , and were kg, kg, kg and kg respectively and average final body weight of pigs of C, , and group were kg, kg, kg and kg respectively (Table 5). In terms of fortnightly body weight gain revealed that highest body weight gain was found in group and was significant difference was found between between and Control group. The total gain in body weight in C, , , were Kg, Kg, Kg and kg respectively (Table 5). There was significant difference between , , and Control group but no significant difference was found between and Control group. Rate of daily gain was found highest in group ( gm) followed by group ( gm), ( gm) and Control group ( gm).
| Attributes | Groups | Significance | |||
| C | |||||
| Initial Body Weight (Kg) | P>0.05 | ||||
| Final Body Weight (Kg) | P<0.001 | ||||
| Total gain in body weight (Kg) | P<0.001 | ||||
| Rate of daily gain (kg/day) | P<0.001 | ||||
| Average Total Feed Intake (Kg) | P<0.001 | ||||
| Average Feed Conversion Ratio (kg) | |||||
| Attributes | C | Significance | |||
| Dry Matter Digestibility (%) | P<0.001*** | ||||
| Organic Matter Digestibility (%) | P<0.001*** | ||||
| Crude Protein Digestibility (%) | P<0.001*** | ||||
| Ether Extract Digestibility (%) | P<0.001*** | ||||
| Crude Fibre Digestibility (%) | P<0.001*** | ||||
| Nitrogen Free Extract Digestibility (%) | P<0.01** |
3.3. Blood Biochemicals
The blood biochemical profile comprising of serum total protein, glucose, Lipid profile (HDL.LDL), Total antioxidant activity and enzyme profile (Serum GGT, BUN, Creatinine) were estimated at the 0, mid and end of the experiment and means have been presented in Table 7.
| Group | Time Interval | P Value | ||
| 0 | Mid | End | ||
| Serum Protein (G/L) | ||||
| C | P<0.001 | |||
| Serum Glucose (mg/dl) | ||||
| C | P<0.001 | |||
| Serum HDL (mg/dl) | ||||
| C | P<0.001 | |||
| Serum LDL (mg/dl) | ||||
| C | P<0.001 | |||
| Serum BUN (mg/dl) | ||||
| C | P>0.05 | |||
| Serum Creatinine (mg/dl) | ||||
| C | P>0.05 | |||
| Serum GGT (U/L) | ||||
| C | 18.34±0.93 | 18.53±1.31 | 17.24±1.16 | P>0.05 |
| 17.97±0.93 | 16.32±1.22 | 16.69±1.04 | ||
| 18.53±0.66 | 18.16±0.93 | 17.42±0.96 | ||
| 17.79±0.87 | 17.24±0.79 | 16.32±0.72 | ||
| Serum SOD (unit/mg haemolysate protein) | ||||
| C | 0.18±0 | 0.19±0 | 0.18±0 | P>0.05 |
| 0.18±0 | 0.18±0 | 0.18±0 | ||
| 0.18±0 | 0.18±0 | 0.18±0 | ||
| 0.19±0 | 0.18±0 | 0.18±0 | ||
Mean with different superscript within the row differ significantly
Statistically non-significant effect (P>0.05) was observed between C and in respect of serum total protein during the mid of the experiment but significant effect was observed between and (P<0.001). By the end of the experiment statistically no effect has been seen in group C and but significant effect has been observed in and . Highest serum protein was found in group (1.5% Tinospora cordifolia powder). By the end of the experiment effect of Tinospora cordifolia has been seen maximum in group in respect of low glucose level. Incase of HDL (High Densisty Lipoprotein) significant effect (P<0.001) was observed between , and , C group by the end of the experiment and low value of LDL was found in group followed by group. But between Control and group no effect has been seen. In case of serum GGT, serum creatinine and serum blood urea nitrogen (BUN) from Table 7 no effect has been seen between the groups and thus it can be concluded that the liver and kidney does not have any negative effect by feeding of Tinospora cordifolia. The result of Serum SOD by the end of the experiment reveals that statistically no significant difference has been seen between the treatment and control groups.
In case of serum protein the result of the present experiment is in agreement with Jain et al., (2020) reported higher values of total protein in geloi at the graded levels and ascorbic acid either alone or in combinations may be due to the antioxidant property of geloi and ascorbic acid which stimuli protein synthesis by bird's enzymatic system. The result of the present experiment is in agreement with Bora et al., (2013) reported that higher level of serum protein when curry leaves was fed at the level of 0.5% and 1% to growing pigs. The increased serum level might be the effect of antioxidant property of Tinospora cordifolia that prevents oxidative stress and boost the immune system and that helps in better protein digestion that leads to high digestibility. In case of serum glucose he result of the present experiment is in agreement with Njoku et al., (2021) reported reduction in serum glucose of pig when fed with herbal mixture. Lin et al.; (2020) also reported that the Serum glucose level concentrations after feeding of Chinese herb feed additive. The anti diabetic property of Tinospora cordifolia is due to the presence of phytoconstituent Tinosporaside and Berberine which itself possess anti diabetic property (Upadhyay et al., 2023). The reduction of glucose due to feeding of Tinospora cordifolia might be due to hypoglycemic property of Tinospora cordifolia. The increase in HDL level due to feeding of Tinospora cordifolia might be due to presence of phenolic compounds that stimulate lipid metabolism. The result is in agreement with Yang et al. (2019) reported that by feeding black pepper in the diet of fattening pigs significantly increased the HDL and vitamin C levels in the blood serum, enhancing the antioxidant defenses of pigs. The result is in agreement with Elghalid et al. (2020) reported that feeding of herbs including carvacol, thymol, mentol, and propylene to rabbit result in increase in HDL level. The result of increase in HDL was due to presence of bioactive and phenolic compound in the herbs that stimulated lipid metabolism in rabbit tissue by increasing the anti oxidative enzymes and preventing the production of specific reactive oxygen species. The positive effect of lowering of LDL by feeding of Tinospora cordifolia might be due to the presence of alkaloid known as Berberine. The primary cholesterol-lowering mechanism of BBR is the inhibition of intestinal absorption by interfering with the cholesterol micellization in the gut and reducing cholesterol absorption and secretion by enterocytes (Li et al., 2011). The low level of LDL might also be due to presence of tannins, terpenoids, and flavonoids content. Terpenoid acts as an intermediate in cholesterol synthesis. It regulates the degradation of HMGCoA reductase activity, which is the main enzyme in cholesterol synthesis. The result is in agreement with Elghalid et al., (2020) where different herbs herbs including carvacol, thymol, mentol, and propylene were fed to rabbits and there was a decrease in total cholesterol, triglycerides and LDL. Mechanism explains that LDL cholesterol was reduced via the stimulation of cellular cholesterol biosynthesis and a decrease in the intestinal absorption of cholesterol. The mechanism of low LDL was the ability of the polyphenolics and flavonoids in each herb to inhibit hepatic 3-hydroxy-3-methylglutaryl coenzyme A reductase activity, which is a key regulatory enzyme in the cycle. Later, the receptor responsible for LDL cholesterol enhanced the removal, of LDL from blood circulation by decreasing the serum plasma concentration. The SOD value reveals that Tinospora cordifolia due to its anti oxidant property has the ability to scavenge free radicals generated during stress condition in the treatment group and thus there is no significant difference between control and treatment groups. The antioxidant property of Tinospora cordifolia is due to the presence of flavonoids and alkaloids such as a choline, tinosporin, isocolumbin, palmatine, tetrahydropalmatine, and magnoflorine present.
3.4. Histology of Different Organs
| GROUP | Control | p Value | |||
| Length of the Liver (mm) | 27.88 ±0.11 | 28.03 ± 0.09 | 28.83 ± 0.60 | 28.65 ± 0.28 | NS |
| Breadth of the Liver (mm) | 17.64 ± 0.02 | 17.60 ± 0.01 | 17.67 ± 0.03 | 17.63 ± 0.03 | NS |
| Thickness of the Liver(mm) | 8.67 ± 0.05 | 8.61 ± 0.01 | 8.71 ± 0.05 | 8.71 ± 0.03 | NS |
| Weight of the Liver (kg) | 1.03 ± 0.01 | 1.03 ± 0.02 | 1.01 ± 0.01 | 1.03 ± 0.01 | NS |
| Length of the Kidney (mm) | 9.73 ± 0.32 | 9.5 ± 0.29 | 10.1 ± 0.31 | 10.97 ± 0.82 | NS |
| Breadth of the Kidney (mm) | 3.16 ± 0.06 | 3.18 ± 0.11 | 3.24 ± 0.12 | 3.14 ± 0.15 | NS |
| Thickness of the Kidney (mm) | 21.10 ± 0.30 | 21.4 ± 0.20 | 21.15 ± 0.37 | 21.38 ± 0.18 | NS |
| Weight of the Kidney (kg) | 0.16 ± 0.00 | 0.15 ± 0.01 | 0.16 ± 0.00 | 0.15 ± 0.00 | NS |
| Length of Spleen (mm) | 21.87c± 0.07 | 22.17c± 0.03 | 22.91b± 0.02 | 23.33a± 0.24 | 0.23 |
| Breadth of Spleen (mm) | 5.37a± 0.03 | 22.91b± 0.02 | 5.14bc± 0.05 | 5.07c± 0.03 | P<0.01 |
| Thickness of Spleen (mm) | 6.04b± 0.06 | 6.00b± 0.06 | 6.29a± 0.04 | 6.41a± 0.05 | P<0.01 |
| Weight of Spleen (g) | 1.06c±0.07 | 1.13c±0.003 | 1.29b±0.00 | 1.41a± 0.00 | P<0.001 |
| Length of Thymus (mm) | P<0.001 | ||||
| Breadth of Thymus (mm) | P<0.001 | ||||
| Thickness of Thymus (mm) | P<0.01 | ||||
| Weight of Thymus (g) | P<0.001 |
Table 8 reveals that there was no significant (P>0.05) difference for per cent weights of liver and kidney among different treatment groups. The mean per cent weights of liver under different groups were found as , , , kg for C, T1, T2 and T3 groups, respectively. The mean per cent weights of kidney under different groups were found as
Table 8 reveals that there was no significant (P>0.05) difference for per cent weights of liver and kidney among different treatment groups. The mean per cent weights of liver under different groups were found as , , , kg for C, T1, T2 and T3 groups, respectively. The mean per cent weights of kidney under different groups were found as , , and kg for C, T1, T2 and T3 groups, respectively.
In present investigation, it was found that the lobes of liver divided into left lateral, left medial, right lateral, right medial, quadrate and caudate lobe. The caudate lobe had caudate process. The gall bladder was attached with the quadrate lobe. The diaphragmatic surface of the liver was strongly convex whereas visceral surface of the liver was deeply concave. These findings were in accordance with the findings of Nickel et al., (1979) in Pig. The average length of the liver of C, , and groups of pig were , , , cm, respectively. The average breadth of the liver of C, , and groups of pig were , , and cm, respectively. The average thickness of the liver of C, , and groups of pig were , , and mm, respectively. In current investigation, it was observed that the kidney of pig was smooth externally and they were bean-shaped. They were flattened dorsoventrally with slightly pointed poles and may occasionally had shallow grooves (lobulation) on the surface. The hilus of the kidney is located in the middle of the medial border and colour of the kidney is greyish brown, Similar findings were noticed by Nickel et al., (1979) in Pig. The mean (± SE) length, breadth, thickness and weight of kidney of pig of all the groups are presented in Table 8. The average length of the kidney of C, T1, T2 and T3 groups of pig were 9.73 ± 0.32, 9.5 ± 0.29, 210.1 ± 0.31, 10.97 ± 0.82 cm, respectively. The average breadth of the kidney of C, T1, T2 and T3 groups of pig were 3.16 ± 0.06, 3.18 ± 0.11, 3.24 ± 0.12 and 3.14 ± 0.15 cm, respectively. The average thickness of the kidney of C, T1, T2 and T3 groups of pig were 21.10 ± 0.30, 21.4 ± 0.20, 21.15 ± 0.37 and 21.38 ± 0.18 mm respectively.
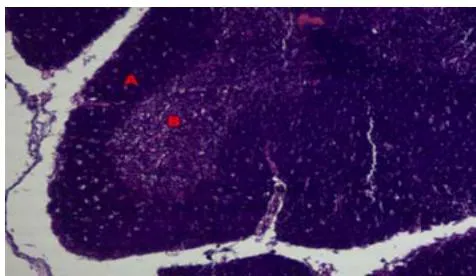
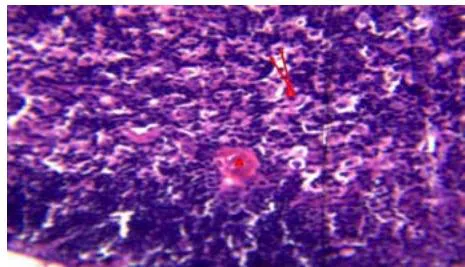
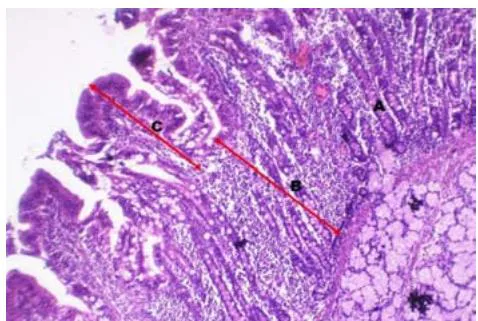
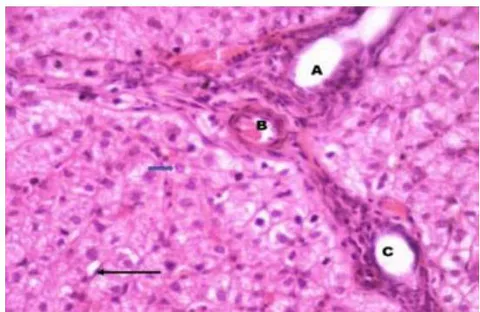
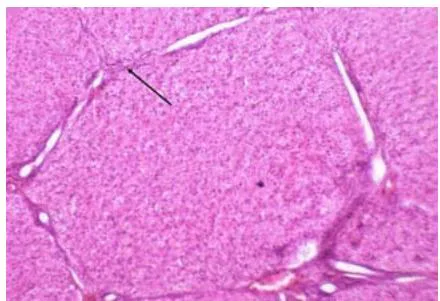
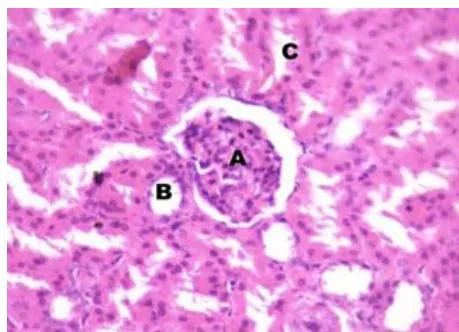
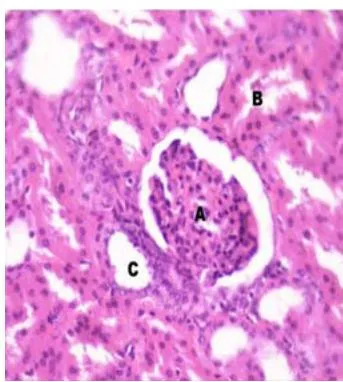
Histologically, the spleen in the present study was found to be encapsulated by a thick connective tissue capsule in all groups of pig. Peri-arterial lymphatic sheath and Splenic nodules were abundant in group (Fig 1) compared to the C (Fig 2), , groups of Pig. Splenic nodules were composed of aggregation of the lymphatic tissue along the course of small pulp artery. The germinal center of the splenic nodule was light stained, where the lymphocytes were loosely arranged. Ellipsoids (pericapillary macrophage sheath) were especially large as well as abundant in the marginal zone, the region between the red and white pulp in (Fig 3) groups compared to the C, , groups of Pig. The red pulp filled the spaces between the white pulp and trabeculae. The red pulp consisted of pulp arterioles, sheathed capillaries, terminal capillaries, splenic sinusoids as well as splenic cords. The splenic sinusoids were less abundant and poorly developed. Numerous splenic cords were observed between the sinusoids. Similar observations were reported by Shringi et al., (2018) in large white Yorkshire Pig. The thymus of each group of pig found in the current study was encapsulated by thin connective tissue capsule. Medulla contained degenerating thymic epithelium forming the concentric central hyalinization with trapped macrophages known as Hassall's Corpuscles (Cystic & Non-Cystic Type). Few adipocytes were observed within the parenchyma which has been clearly stained with H & E. Densely packed lymphocytes were distinguishable in cortex unlike that of medulla in all groups of Pig. These finding were total agreement with the finding of Yugesh et al. (2014) in Pig. Numerous lymphocytes aggregation was found in both cortex and medulla of thymus of (Fig 5) group as compared to the C (Fig 4), and group of Pig. In present study, the liver was enveloped by the capsule called Glisson's capsule in all groups of pig. The hepatic cells are polyhedral shaped and vacuolated in all groups of pig. Similar findings were observed by Metwally et al. (2015) in albino rats. The shaped of the nucleus was larger rounded and stains basophilic, and it was located in the center of the cell. Usually only one central vein is noticed in each lobule. It was found that the hepatic cord, hepatic vein and artery were more prominent in group of pig compared to the other groups of pig (Fig 7 & 8). In present investigation, the wall of the Duodenum of each group of pig was composed of four layers viz., tunica mucosa, tunica submucosa, tunica muscularis and tunica serosa. Simple columnar epithelium lined the villi of duodenum. It was noticed that the villi and intestinal glands were more prominent in groups (Fig 6) followed by , , and C groups of pig. The mean (± SE) length of villi of duodenum of pig under different treatment groups are presented in Table 7. The average the length of villi of duodenum of C, , , groups of layers was 91.90±0.01, 91.92±0.00, 94.04±0.01, 113.11±0.01 μm respectively. The mean length of villi of duodenum group of layers were significantly (P<0.01) higher as compared to C, , , groups of layers. The average diameter of the crypts of the duodenum of C, , , group was 57.18±0.00 μm, 57.15±0.01μm, 56.33±0.39 μm, 56.04±0.01 μm respectively. The mean diameter of the crypts of the duodenum of treatment group of layers was significantly (P<0.01) lower as compared to C, groups. The kidney of pig was surrounded by a fibrous connective tissue Capsule. The kidney was divided into outer cortex and inner medulla. It was found that the cortex contained the uriniferous tubule and it was composed of both nephron as well as collecting tubules. The nephron and collecting tubules were entirely enveloped by basement membrane which was thickest in the parietal layer of the Bowman's capsule and in the thin limb of loop of Henle in all groups of pig, in present study (Fig 9 & 10). Similar observations were recorded by Dellmann and Brown (1993) in domestic animals and Beniwal (1995) in camel. The proximal convoluted tubule was lined by simple truncated pyramidal cells with brush border. Similar findings were reported by Dellmann and Brown (1993) in domestic animals.
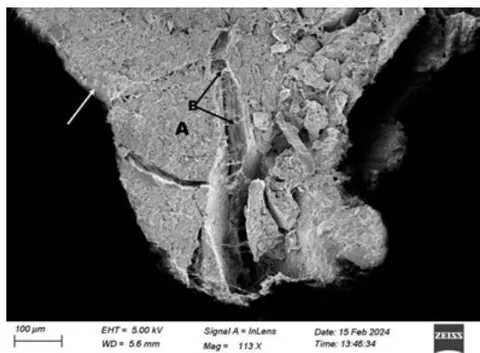
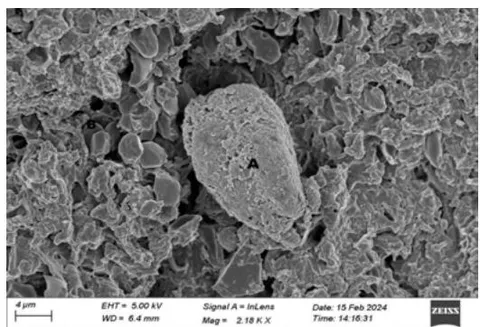
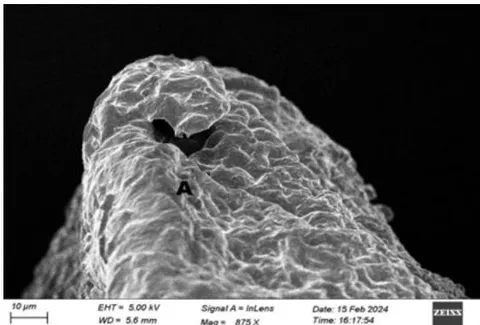
In the present study ultra structure of lymphoid organ (spleen and thymus), liver, duodenum and kidney of pig feeding trail was done. In present investigation, scanning electron microscopic studies of spleen, thymus, and duodenum of C and group of Pig was studied. The spleen of both the C and group of Pig was encapsulated by thick capsule and it contained numerous connective tissue fibers. Sheathed artery was noticed in both the C and group of Pig. Abundant lymphocytes aggregation was noticed in treatment group of Pig as compared to the C group of Pig. Each lobe of thymus was covered by thick capsule and it was divided into two parts viz., inner medulla and outer cortex with interlobular connective tissue in both C and treatment groups of Pig. Smooth T-lymphocytes were observed in both cortex and medulla of thymus of C and (Fig 11) groups of Pig. A clump of lymphocytes was noticed in medulla of thymus of (Fig 12) group of Pig. The duodenum of C and treatment groups of Pigs possessed tall, spatulate villi with horizontally-arranged surface clefts upon which a regular pattern of hexagonal absorptive cells and goblet cell mouths was superimposed. The enterocytes of villi of duodenum of (Fig 13) groups of layers birds were more prominent than the enterocytes of villi of duodenum of C groups of Pig.
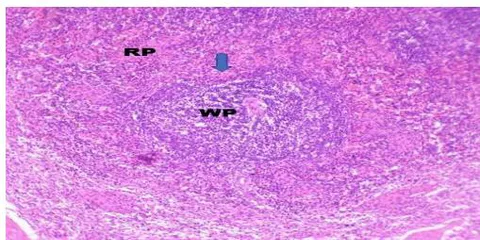
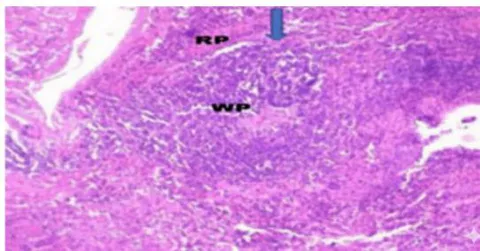
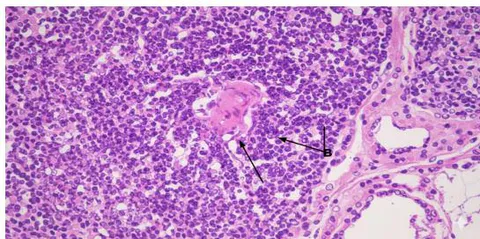
Treatment Groups Of Pig Under Feeding Trail. H& E, 40x.
IV. DISCUSSION
4.1 Chemical Composition of Tinospora Cordifolia (Giloy) Stem Samples
Gitanjali Devi (2020) and Kavya et al. (2015) reported that T. cordifolia contains with high fibre (15.8%), protein (4.5% - 11.2%), low fat (3.1%) and sufficient calcium (0.131%). In the present investigation the crude protein content, fibre, fat content was comparable with Gitanjali Devi (2020) and Kavya et al. (2015).
4.2 Body Weight of the Pigs
The Increase in body weight observed in the present study is in agreement with Singh et al. (2018) who observed the effect of T. cordifolia on growth might be due to active principles of Tinospora cordifolia i.e. Tinosporine which limits the metabolic signs of stress and alleviated the physiological consequences of stress. Phytogenic additives has antibacterial, antioxidant, antistress, gut microflora manipulation, immune enhancement properties and digestive enzymes stimulation could be the probable reasons for the positive effects exerted by them on the growth and health performance of animal. In the present study the improvement in the growth of animal might be due to antibacterial and antioxidant property of Tinospora cordifolia which improved the gut environment and microflora. The improvement in growth might be due to increase protein digestibility in group and due to positive development of intestinal structure. The intestinal villi are the main site of nutrient absorption and due to Tinospora cordifolia the villi height has increased resulted in higher nutrient absorption and better growth.
4.3 Feed Intake
The results obtained in present study regarding feed intake were in accordance with findings of Singh et al. (2009), Kulkarni et al. (2011) and Bhushan et al. (2013) who reported significant increase in feed intake when broilers were supplemented with Tinospora cordifolia stem powder in ration. The increased feed intake in Tinospora cordifolia supplemented groups might be due to presence of various bioactive compounds present in Tinospora cordifolia stem powder, which might stimulate the digestion system in poultry and improve the function of liver and increase the pancreatic digestive enzymes. Increased feed intake in Tinospora cordifolia supplemented groups also gain support with the findings of Kamel (2001) who reported that herbs, spices and various plant extracts have appetite and digestion stimulating properties, and antimicrobial effects. The result of feed conversion ratio in the present study were in agreement of Gupta et al., 2018. The improved FCR might be due to the antibacterial, antistress property of Giloy which has helped in proper development and growth of animal.
4.4 Digestibility of Nutrients
The improvement in digestibility of nutrient due to feeding of Tinospora cordifolia in the diet were comparable to Singh et al. (2018) findings where feed intake (g/bird), body weight gain (g/b) and FCR showed significant improvement as the level of giloy powder was increased in broiler birds. Singh et al. (2008) reported that Dry matter, Percent protein, energy were significantly higher in group supplemented with herbal liver tonic product than control. Jamroz et al. (2003) reported that phytogenic feed additives improves the gut microflora modify the digestive secretion, morphology (Pericet al., 2010). The increase in the digestibility of the nutrients in the present study might be due to the present of flavonoids that stimulate gut activity by improving the digestibility of all nutrients. The herbal plant extracts influence the ether extract but better result was observed in dry form than extract (Dalle et al., 2013). The increase in digestibility might be due to the active constituent present in herbs that can improve the intestinal environment, reduce pathogens, and increase antioxidant activity (Wang et al., 2021). The increase in dry matter digestibility and nitrogen free extract might be due to increase in activity of pancreatic lipase, amylase, trypsin and chymotrypsin (Patel and Srinivasan 2004; Wang et al., 2007). The increase in organic matter digestibility might be due positive effect of herbs which itself is due to its antibacterial and antioxidant property (Thomke 1998; Medel et al., 2002). The increase in crude protein digestibility might be due to increase secretion of digestive juices and improve the gastro intestinal condition. The increase in ether extract digestibility and crude fibre might be due to increase in pancreatic secretion which improves fat and fiber digestibility (Wang and Bourne; 1998). In the present study tannin content of Tinospora cordifolia were estimated both qualitatively and quantitatively.
V. CONCLUSION
ACKNOWLEDGMENT
The authors would like to thank the Dean, Faculty of Veterinary Science as well as the Directorate of Post Graduate Studies, AAU, Jorhat, for providing the resources to carry out the research work.
Conflicts of Interest
The authors declare no conflicts of interest
Availability of data and materials
Data may be provided following request to the corresponding author.
Disclaimers: The views and conclusions expressed in this article are solely those of the authors and do not necessarily represent the views of their affiliated institutions. The authors are responsible for the accuracy and completeness of the information provided, but do not accept any liability for any direct or indirect losses resulting from the use of this content.
Conflict of interest: The authors declare that there are no conflicts of interest regarding the publication of this article. No funding or sponsorship influenced the design of the study, data collection, analysis, decision to publish, or preparation of the manuscript.
were found significantly better in , than control and group. But there was no significant difference between control and group. The better digestibility of nutrients was found in group supplemented with Tinospora [email protected]%.
Grossly in present study it was found that the spleen of pig was long and narrow, and had a pointed ventral extremity. The border of the spleen was sharp and uniform wide. In cross section it was triangular. The hilus was on a longitudinal crest on the ventral surface. The color of the spleen was bright red but darkened after it was expose to the air. Similar findings were reported by Nickel et al. (1979) in Pig. The average length of the spleen of C, , and group of rat was , , and mm, respectively. The average breadth of spleen of C, , and groups of pig was , , and mm, respectively. The average thickness of the spleen of C, , and groups of pig was , , , and mm, respectively. The mean weight of spleen of C, , and groups of pig was , , and kg, respectively. The mean length, diameter, thickness and weight of the spleen of group and which was fed Giloy@1% and 1.5% were significantly higher compared to the and control group. The thymus of Pig was situated in the pericardial mediastinum anterior to the major vessels and ventral to the base of the heart. These finding was total agreement with the finding of Yugesh et al., (2014) in Pig. The average length of the thymus of C, , and groups of pig were , , and mm, respectively. The average breadth of thymus of C, , and groups of pig was , , and mm, respectively. The average thickness of the thymus of C, , and groups of pig were , , and mm, respectively. The mean weight of thymus C, , and groups of pig were , , and kg, respectively. The mean length, diameter, thickness and weight of the thymus of , were significantly higher compared to the group C, . The high result was found in group. In current investigation, it was noticed that the duodenum begins at the pylorus on the right side of the body at the level of the tenth to twelfth intercostal space. Its cranial part ascends caudodorsally along the visceral surface of the liver. It forms the horizontal sigmoid loop just cranial to the right kidney and ends at the cranial flexure of the duodenum. The descending duodenum passes caudally ventral to the right kidney. Similar observation was reported by Nickel et al., (1979) in Pig.
The knowledge of gross anatomy and histomorphology of lymphoid organs (Spleen and Thymus), liver, kidney and duodenum along with nutrient digestibility and blood parameters give a clear picture regarding effect of feeding Tinospora cordifolia (Giloy) in pigs. The results of the nutrient utilization, growth, gross anatomy and histomorphology, blood parameters in the experiment have shown that feeding of Tinospora cordifolia (Giloy) @ the rate of 1.5% has a positive effect on the growth of pigs and further it also helps to reduce the feed cost in pig feeding. The different pharamacological properties of Tinospora cordifolia (Giloy) have helps in showing the positive effect in pigs and thus it gives a clear picture that in the diet of pig feeding Tinospora cordifolia (Giloy) helps to maintain the health status of the pigs.
Informed consent
Conflict of Interest
The authors declare no conflict of interest.
Ethical Approval
Not applicable
Data Availability
The datasets used in this study are openly available at [repository link] and the source code is available on GitHub at [GitHub link].
Funding
This work did not receive any external funding.
References
Cite this article
Related Research

Special Issue
Launch a focused special issue to highlight research, emerging trends, and expert insights in your academic field.