




IntelliPaper
Abstract
Orientation- High market volatility increases unfavorable market risk premium.Investors have a keen interest in knowing variables that may help forecast stock prices.
Research purpose: The study examined the impact of macroeconomic volatility and interest rate differentials on stock market liquidity in Nigeria and South Africa.
Motivation for the study: While prior research has established that macroeconomic instability and financial liquidity variables determine stock market volatility in Africa, less research attention has been paid on the factors that can buffer better relationship.
Research approach/design and method- This study was structured to capture the relationships that exist between macroeconomic volatility and the interest rate differential on stock market liquidity, which implied that ex-post facto and analytical research designs were used. It relies extensively on secondary data, which was obtained from World Bank development indicators for the selected two countries from 1986–2022.
Main findings: Findings indicated that Macroeconomic volatility has a positive and significant effect on the stock market liquidity in Nigeria, while in South Africa, macroeconomic volatility has a positive and non-significant effect on the stock market liquidity.
Practical/managerial implications: These findings implicate the need for government enacts sound monetary policies in order to enhance economic growth in Nigeria and South Africa.
Contribution/value-add: This study is one of the first to show that the possibility thatmacroeconomic variables such as GDP, money supply, industrial production, are unstable and weak when it comes to absorbing stock.
Explore Digital Article Text
I. INTRODUCTION
The ever-growing need for well-functioning stock markets for economic growth and development has drawn the attention of many researchers globally, especially in emerging economies. This is because a stock market serves as an avenue through which funds are generated and mobilized for productive use, thus enhancing the economic growth of a country. Investors have a keen interest in knowing variables that may help forecast stock prices. Thus, they can more perfectly manage their positions and portfolios (maximize returns and/or minimize risk) if they can use macroeconomic news releases as reliable indicators for where the stock market is headed. Conversely, policymakers meticulously focus on the situation of the stock market, which can be regarded as a leading indicator of future macroeconomic activity. "Market liquidity is mainly evidence of its efficiency". Illiquidity in markets is a red flag that the market is poorly functioning, which can lead to a financial crisis. The measurement of liquidity is an important question that needs to be answered. Four dimensions are important in this respect. (1) Trading time: the ability to execute a transaction immediately at the prevailing price. (2) Tightness: the ability to buy or sell an asset at the same time and at the same price. (3) Depth: the ability to buy and sell a certain amount of an asset without influencing the quoted price. (4) Resiliency:
II. THEORY & HYPOTHESES
Despite the crucial role of stock markets in promoting economic growth, African stock markets are considered small and illiquid, with infrastructural bottlenecks and weak regulatory institutions. Thus, since most investors are risk-averse, they tend to run away from the market when there is uncertainty in expected returns. High market volatility increases the unfavorable market risk premium.
2.1 Conceptual review
2.1.1 Macroeconomic volatility
It is reasonably unarguable to believe the notion that the general macroeconomic environment, whether volatile or not, can have a significant impact on the stock market of a country (David & Ampah, 2019). Macroeconomic volatility can be seen as fluctuations in economic variables due to either domestic or external shocks that are not foreseeable or predictable. Macroeconomic volatility implies the vulnerability of macroeconomic variables to shocks. It is a situation where there is the possibility that macroeconomic variables such as GDP, money supply, industrial production, oil price, trade openness, exchange rate, interest rate, etc. are unstable and weak when it comes to absorbing shock.
2.1.2 Interest rate differential
According to Uchendu (1993), as cited in Salama (2018) "interest ratecan be defined as the return or yield on equity or opportunity cost of deferring current consumption into the future". Trade
2.1.3 Openness
Admittedly, trade openness can be used as an indicator of macroeconomic volatility; for example, Eiji (2017) asserted that the macroeconomic interpretation of the trade openness variable is that it measures the extent to which a domestic economy is exposed to external shocks.
2.1.4 Stock market liquidity
The term stock market refers to various channels through which the shares of a publicly held company are bought and sold. Such financial activities are conducted under a given set of regulations (James, 2022).
Turnover Ratio: The turnover ratio, as an indicator of stock market liquidity, measures the number of times the outstanding volume of shares changes hands and can complement traded value or GDP in some cases. It is obtained by dividing the value of the total shares traded by the stock market capitalization.
2.1.5 Money Supply
Money literally consists of the legal tender of a country and all other liquid financial instruments flowing in the economy at a particular point in time.
2.1.6 Exchange rate
The exchange rate is the rate at which one currency is exchanged for another currency (Mohan & Chitradevi, 2014). In another word," the price paid for a country's currency relative to another country's currency is known as the exchange rate" (Olweni & Omondi, 2011).
2.1.7 Macroeconomic Environment and the Stock Market
Understanding the relationship between macroeconomic volatility and the stock market is crucial for investors because macroeconomic factors play a vital role in the performance of the stock market.
2.1.8 Interest Rates and the Stock Market
Monetary policy uses interest rates as a tool to either increase or decrease the quantity of money in an economy. Thus, it raised the concern of regulators and investors about the pressing need to educate stakeholders on the impact of interest rate fluctuations (Sammyjo, 2022).
III. THEORETICAL REVIEW
3.1 Capital Asset Pricing Model
The Capital Asset Pricing Model (generally known as CAPM) was developed in the 1960s by Sharpe (1964). It is based on the portfolio theory introduced by Markowitz (1952). According to Sharpe, diversification gives the investor the opportunity to minimize all portfolio risk except the risk derived from fluctuations in economic activity. This risk, the systematic risk, grows with the addition of an individual stock and depends on the response to the economic and political environment.
3.2 Empirical Reviews
Yeoh and Suhal (2019) investigated the effects of money supply, exchange rate, and interest rate spread on the performance of the stock market in Malaysia. The study employed monthly data, from January 1997 to August 2018. The methods of analysis were the autoregressive distributed lag (ARDL) and GARCH models. The results showed that the money supply, real effective exchange rate, and interest spread had a long-run effect on the performance of the stock market.
Demir (2019) examined the impacts of some prominent macroeconomic factors on the Turkish stock market index, BIST-100 (Borsa Istanbul-100), over the 2003 Q1–2017 Q4 period using the Autoregressive Distributed Lag (ARDL) model. The study found that economic growth, the relative value of the domestic currency, portfolio investments, and foreign direct investments raise the stock market index, while interest rates and crude oil prices negatively affect it.
Udoka, Nya, and Bassey (2018) examined the effect of macroeconomic determinants on stock price movements in Nigeria using data on macroeconomic variables such as gross domestic product, exchange rate, inflation, interest rate, and absolute stock price. The study concluded that there was no long-term relationship between macroeconomic determinants and stock price movements in Nigeria. John (2019) examined the effect of macroeconomic variables on stock market performance in Nigeria uses annual time series data spanning 1981 to 2016. The study employed the Ordinary Least Square (OLS) regression technique and showed a negative effect on stock market performance (represented by market capitalization). The results showed that money supply has a significant positive effect and interest rate has a significant negative effect. The study also found that the exchange rate and inflation rate have no statistically significant effect on stock market performance in Nigeria.
Uhumnwangho (2022) examines the volatility of African stock markets and the factors influencing it in Africa. The Generalized Autoregressive Conditional Heteroscedasticity (GARCH) was used to generate the volatility, and the Generalized Method of Moments was applied to a dynamic panel model to examine the factors that account for volatility in Africa. Sixteen (16) African stock markets were covered for the period 2013 to 2019. Data was sourced from the African Securities Exchanges Association, Bank for International Settlements, and World Bank Development Indicators databases. The study found that macroeconomic instability and financial liquidity variables determine stock market volatility in Africa.
Siddiqi et al. (2021) examine how much stock liquidity is influenced by macroeconomic variables in the case of Pakistan. For this purpose, time series data is used for analysis by considering liquidity on the Pakistan stock exchange using a time span from 2016 to 2020.
The study seeks to examine the impact of macroeconomic volatility and interest rate differentials on stock market liquidity in Nigeria and South Africa.
Ho : Macroeconomic volatility and interest rate differentials do not have a significant positive impact on stock market liquidity in Nigeria and South Africa.
IV. RESEARCH METHODS AND DESIGN
This research study was structured to capture the relationships that exist between macroeconomic volatility and the interest rate differential on stock market liquidity, which implied that ex-post facto and analytical research designs were used. The study relies extensively on secondary data, which was obtained from World Bank development indicators for the selected two countries from 1986–2022. The motivation to use secondary data lies in the fact that the study is based on historical research that requires past quantitative data to test hypotheses. The various data sources were based on the parameters of the variables. Macroeconomic volatility (MAVO) was measured using the standard deviation of the gross domestic product (GDP), the interest rate (INT) differential was measured with the short-term interest rate, trade openness (OPEN) was measured with total trade (import + export)% GDP, stock market liquidity (STR) was proxied with the stock turnover ratio, and control variables were money supply (MOS) and exchange rate (EXR).
4.1 Measure, Control Variable
4.1.1 Dependent Variable
4.1.1.1 Stock Market Liquidity (STR)
A stock's liquidity generally refers to how rapidly shares of a stock can be bought or sold without substantially impacting the stock price. Liquidity enables investors to execute buy and sell orders at the desired price more efficiently. Liquidity helps increase the number of active participants in the stock market because you will easily find buyers to sell your assets.
4.2 Explanatory Variables
4.2.1 Macroeconomic Volatility (MAVO)
Macroeconomic volatility is defined as periods of unexpected boost and unpredictable sharp downward and upward movements of the macroeconomic variables. Macroeconomic volatility is measured by finding the standard deviation of the gross domestic product (GDP). In this study, macroeconomic volatility serves as the key explanatory variable.
4.3 Interest Rate Differential (INT)
An interest rate differential (INT) weighs the contrast in interest rates between two similar interest-bearing assets. Most often, it is the difference between two interest rates. Traders in the foreign exchange market use interest rate differentials when pricing forward exchange rates. Higher interest rates offer lenders in an economy a higher return relative to other countries. Therefore, higher interest rates attract foreign capital and cause the exchange rate to rise.
4.4 Trade Openness (OPEN)
Trade openness refers to the outward or inward orientation of a given country's economy. Trade openness is defined as the ratio of exports plus imports over GDP. Outward orientation refers to economies that take significant advantage of the opportunities to trade with other countries, whereas inward orientation refers to economies that do not take advantage of the opportunities to trade with other countries. Trade openness serves as an explanatory variable.
4.5 Money Supply (MOS)
The money supply is the total amount of money—cash, coins, and balances in bank accounts—in circulation. The money supply is also defined as a group of safe assets that households and businesses can use to make payments or hold as short-term investments. It was included as a control variable because the supply of money can boost or decrease stock market liquidity.
Exchange Rate (EXR): An exchange rate is the rate at which one currency will be exchanged for another currency. The essence of employing the exchange rate as a control variable is that it affects the prices of stocks in the stock market as well as the investment decisions of investors.
Techniques of Data Analysis: They applied some diagnostic tests for the purpose of achieving validity and reliability. The co-integration causality test and OLS were applied to ensure a reliable result.
Unit Root Test
Statement of Hypothesis
: Series has a unit root, : is not true
Table 1: Unit Root Test Table
| Variable | NIG | Order | SA | order | ||||||
| ADF sta | 5% cri | P-Value | Intgrat. | Decission | ADF sta | 5% crit | P-Value | Intgrat. | Decission | |
| M Supp | -4.4059 | -2.9763 | 0.0018 | 1(1) | Rej -null | -2.6206 | -1.9539 | 0.0108 | 1(1) | Rej -null |
| Exc Rate | -5.5655 | -2.9719 | 0.0001 | 1(1) | Rej- null | -4.6127 | -2.9677 | 0.0010 | 1(0) | Rej- null |
| Imports | -4.5199 | -2.9677 | 0.0013 | 1(0) | Rej- null | -6.2806 | -2.9678 | 0.0000 | 1(0) | Rej- null |
| Exports | -6.0455 | -2.9719 | 0.0000 | 1(1) | Rej-null | -5.3716 | -2.9919 | 0.0002 | 1(1) | Rej-null |
| Stock T | -2.3568 | -2.0063 | 0.0270 | 1(1) | Rej- null | -6.2807 | -2.9678 | 0.0000 | 1(0) | Rej- null |
| GDP | -4.5109 | -2.9678 | 0.0013 | 1(1) | Rej-null | -5.0231 | -2.9678 | 0.0003 | 1(0) | Rej-null |
| Int. Rate | -5.5931 | -2.9484 | 0.0000 | 1(1) | Rej-null | -6.1112 | -3.5366 | 0.0001 | 1(1) | Rej-null |
| Net_Tra | -5.0207 | -2.9389 | 0.0002 | 1(0) | Rej-null | -2.5213 | -1.9501 | 0.0131 | 1(0) | Rej-null |
The study observed that, from table (1), the constant and trend were not absolutely restricted simply because some trends were not statistically significant at the 5% level while others were. Since some of their respective probability values are not greater than 5% significance, we failed to ignore them by choosing (at the intercept, trend, or both). There is no evidence of a unit root among the series as tested since the probability value of t-statistics is less than 5% significant in both countries under study. The ADF results or values are more negative than the critical values at the 5% level in absolute terms. The series are said to be stationary at this point since there is no evidence of a unit root; therefore, the null hypothesis (presence of a unit root) is not accepted. The order of integration in both countries is similar while achieving a stationary level for all the variables; therefore, we apply the bounds co-integration test so as to identify the nature of their long-term relationship or association.
Test for Co-integration
Statement of Hypothesis
: Series is not co-integrated
is not true
Decision Criteria: Reject the null hypothesis if the calculated F-statistics is greater than i(1) bounds at 5% level of significance, otherwise accept the null hypothesis.
Table 2: Bounds Co-integration Test Table
| NIG | F Stat@5% | i(1) bounds | i(o) bounds | Result | SA | G S tat@5% | i(1) bounds | i(o) bounds | Result |
| Model one | 3.13 | 3.67 | 2.79 | Accept $H_o$ | Model one | 3.10 | 3.67 | 2.79 | Accept $H_o$ |
| Model Two | 1.44 | 3.67 | 2.79 | Accept $H_o$ | Model Two | 2.31 | 3.67 | 2.79 | Accept $H_o$ |
The results of table 2 indicate that there is no evidence of co integration among the variables. All the outcome from model one, two and three show that the value of Statistics is not greater than i (1) bounds and this gave rise to acceptance of null hypothesis. This implied that long run relationship does not exist among the variables, hence the need for short run causality test.
Test for Short run Causality (wald Test)
Statement of hypothesis
Decision criteria: Accept the null hypothesis if , otherwise reject the null.
Wald Test: Equation: Untitled
| Test Statistic | Value | df | Probability |
| F-statistic | 2.160340 | (3, 15) | 0.1353 |
| Chi-square | 6.481019 | 3 | 0.0904 |
Null Hypothesis: C(2)=C(3)=C(4)=0 Null Hypothesis Summary:
| Normalized Restriction (= 0) | Value | Std. Err. |
| C(2) | 0.483131 | 0.690262 |
| C(3) | -0.183440 | 0.314894 |
| C(4) | -0.052686 | 0.037781 |
Table 3 as displayed above, where the value of F-statistic is 2.160340, Chi-square is 6.481019 with corresponding probability of 0.1353 and 0.0904 respectively are not equal to zero. This implied that is not equal to.The study conclude that gross domestic product,money supply and exchange rate cause the stock trade in the short run. It proves that short run causal effect exist among the variables.The study failed to accept the null hypothesis, stating that is not equal to zero.
Statement of hypothesis
Decision criteria: Accept the null hypothesis if , otherwise reject the null.
Using model two as stock traded= f(interest rate, money-supply, exchange rate)
Table 4: (South Africa) Wald Test: Equation: Untitled
| Test Statistic | Value | df | Probability |
| F-statistic | 2.691162 | (3, 15) | 0.0835 |
| Chi-square | 8.073487 | 3 | 0.0445 |
Null Hypothesis: C(2)=C(3)=C(4)=0 Null Hypothesis Summary:
| Normalized Restriction (= 0) | Value | Std. Err. |
| C(2) | 0.032036 | 0.472958 |
| C(3) | -0.509260 | 0.367711 |
| C(4) | -0.043623 | 0.016788 |
Table 4 as indicated above displayed the value of F-statistic as 2.691162, Chi-square as 8.073487 with corresponding probability of 0.0835 and 0.0445 respectively which are not equal to zero. This implied that is not equal to.The study conclude that interest rate, money supply and exchange rate cause the stock trade in the short run. It proves that short run causal effect exists among the variables. The study failed to accept the null hypothesis, stating that is not equal to zero.
Statement of hypothesis
Decision criteria: Accept the null hypothesis if , otherwise reject the null.
Using model One as stock traded =f(GDP, money-supply, exchange rate)
Table 5
| Test Statistic | Value | df | Probability |
| F-statistic | 10.54262 | (3, 24) | 0.0001 |
| Chi-square | 31.62786 | 3 | 0.0000 |
Null Hypothesis: C(2)=C(3)=C(4)=0
Null Hypothesis Summary:
| Normalized Restriction (= 0) | Value | Std. Err. |
| C(2) | 0.693709 | 0.624503 |
| C(3) | 0.300539 | 0.176659 |
| C(4) | -0.200059 | 0.067709 |
Table 5 as indicated above displayed the value of F-statistic as 10.54262, Chi-square as 31.62786 with corresponding probability of 0.0001 and 0.0000 respectively which are not equal to zero in absolute terms. This implied that is not equal to.The study conclude that gross domestic product, money supply and exchange rate cause the stock trade in the short run. It proves that short run causal effect exist among the variables. The study failed to accept the null hypothesis, stating that is not equal to zero.
Statement of hypothesis
Decision criteria: Accept the null hypothesis if , otherwise reject the null.
Using model two = stock traded=f(interest rate, money-supply, exchange rate)
Wald Test: Equation: Untitled
| Test Statistic | Value | df | Probability |
| F-statistic | 7.045950 | (3, 23) | 0.0016 |
| Chi-square | 21.13785 | 3 | 0.0001 |
Null Hypothesis: C(2)=C(3)=C(4)=0
Null Hypothesis Summary:
| Normalized Restriction (= 0) | Value | Std. Err. |
| C(2) | -0.264152 | 0.653089 |
| C(3) | 0.078108 | 0.210369 |
| C(4) | -0.212403 | 0.069081 |
Table 6 as indicated above displayed the value of F-statistic as 7.045950, Chi-square as 21.13785 with corresponding probability of 0.0016 and 0.0001 respectively which are not equal to zero. This implied that is not equal to.The study conclude that interest rate,money supply and exchange rate cause the stock trade in the short run. It proves that short run causal effect exist among the variables. The study failed to accept the null hypothesis, stating that is not equal to zero.
Test For Multi- collinearity
Decision criteria: If the value of centered variance inflation factor(CVIF) is less than ten(10), there is no evidence of multi-collinearity on the explanatory variables.
Table 7
| NIG Variables | Uncentered VIF | Centered VIF | Multi-co linearity | SA Variables | Uncentered VIF | Centered VIF | Multi-co linearity |
| MAVO | 3.31492 | 1.25346 | Absent | MAVO | 1.675603 | 1.027255 | Absent |
| MOS | 14.32433 | 1.43485 | Absent | MOS | 70.18831 | 1.760174 | Absent |
| EXR | 8.879076 | 1.41511 | Absent | EXR | 29.92147 | 1.725551 | Absent |
| INT.rate | 7.653061 | 1.21972 | Absent | INT.rate | 38.25001 | 1.965012 | Absent |
| T –Open | 3.33897 | 1.03567 | Absent | Open | 2.21128 | 1.76461 | Absent |
Table 7 as indicates that the value of centered variance inflation factor(CVIF) for South Africa(SA) on these variables (mavo,mos,Exch rate,Int rate and trade -open) are 1.027255,1.760174,1.725551, 1.965012 and 1.76461 respectively.We observed in absolute terms that all the values are said to be less than ten (10) On the same table 1, we observed that for Nigeria (mavo, mos, Exch rate, Int rate and trade-openness), have their corresponding centered variance inflation factor (CVIF) values as 1.25346, 1.43485, 1.41511, 1.21972 and 1.03567 respectively which is less than ten (10)
Test for ARCH Effect
Statement of Hypothesis
: No ARCH effect
is not true
Decision Criteria: Accept the null hypothesis if , otherwise reject the null in favour of the alternate hypothesis.
Table 8: ARCH Effect Table
| NIG | MAVO(-1) | Decision | SA | MAVO(-1) | Decision |
| F-Stat | 0.325289 | F-Stat | 0.139349 | ||
| Obs. R $^{2}$ | 0.345983 | Accept null | Obs. R $^{2}$ | 0.149268 | Accept null |
| Prob F(1,26 | 0.5733 | Prob F(1,26) | 0.7120 | ||
| Prob.ChiSq | 0.5564 | Prob.Chi-Sq | 0.6992 | ||
| Interest Rate(-1) | Interest Rate(-1) | ||||
| F-Stat | 0.050955 | F-Stat | 1.815575 | ||
| Obs. R $^{2}$ | 0.053788 | Obs. R $^{2}$ | 1.824670 | ||
| Prob F(1,26 | 0.8227 | Accept null | Prob F(1,26 | 0.1865 | Accept null |
| Prob.ChiSq | 0.8166 | Prob.ChiSq | 0.1765 |
Table 8 indicate that probability values of F-statistics and that of Obs. on MAVO and Interes rate in both countries are (Nigeria -MAVO P-value of F-stat =0.5733 and P-value of Chi sq=0.5564). In similar manner South African activities were observed on the same table as (South Africa -MAVO P-value of F-stat =0.7120 and P-value of Chi sq=0.6992). The result or the outcome on the variable is said to be statistically not significant, since it is neither equal to zero nor less than 5% level of significance.
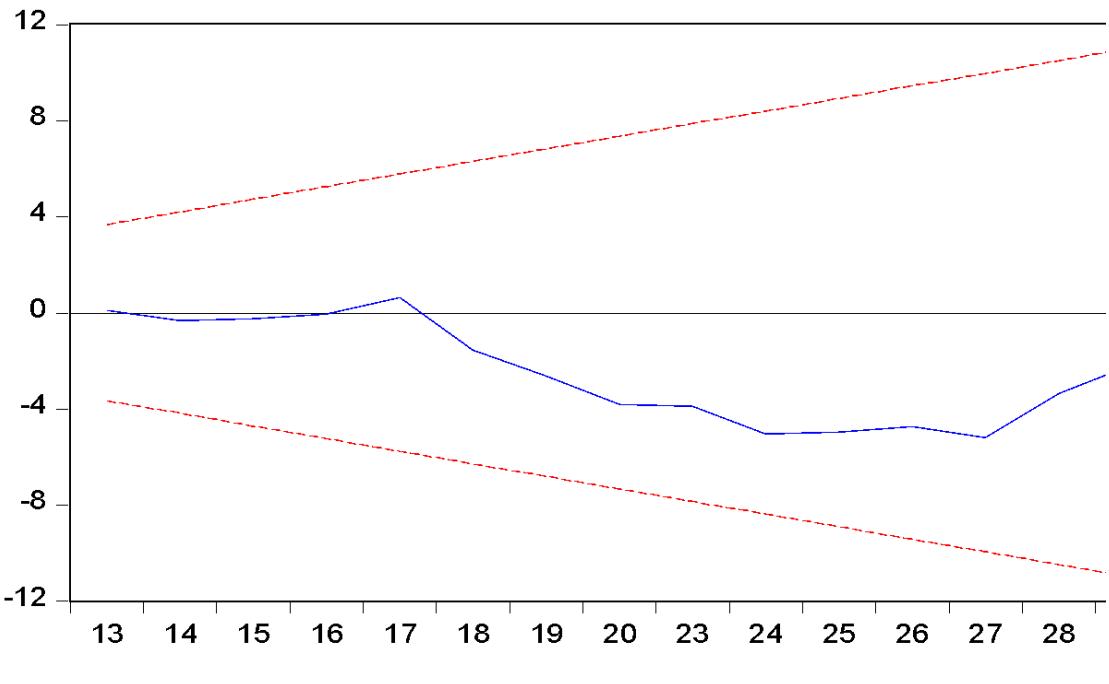
On the same table 8 the Interest rate differential on both countries are said to be statistically not significant, since the probability values of all the outcomes in absolute terms are neither equal to zero nor less 5% level of significance. Based on these observations, the study opted for the use of Fixed and random Effect estimation for the purpose of eliminating co-llinrearity of explanatory variables, since there is no presence of ARCH effect, therefore no need of ARCH model {"image_source":{"path":"images/e2de958e400ed0b210bad7fcaf3f1de76048876fccfea353d87a3fd616b6a5ac.jpg"},"content":"","chart_caption":[],"chart_footnote":[]}
{"image_source":{"path":"images/28dbd4fa234ac321bd6ba595c5caa84b314b186ecf032b8f01946dea2c5c63ce.jpg"},"content":"","chart_caption":[{"type":"text","content":"Figure 1: Nigeria Model one"},{"type":"text","content":"Figure 2: Model Two"}],"chart_footnote":[]} {"image_source":{"path":"images/038160df63650e91b2fcf6029973719034b6ce2fcb1deb20e077cb423b9d8259.jpg"},"content":"","chart_caption":[{"type":"text","content":"Figure 1: South Africa Model One"}],"chart_footnote":[]}
{"image_source":{"path":"images/7f3f7cb6f7aedc7b4bc41131816fab7fbf1a6a5fe65d8e64708c1a896ac9a832.jpg"},"content":"","chart_caption":[{"type":"text","content":"Figure 2: Model Two"}],"chart_footnote":[]}
Test of Hypotheses
Test of Hypothesis one
: Macroeconomic volatility did not have positive and significance effect on the stock market liquidity in Nigeria and South Africa
Decision Criteria: Accept the null hypothesis if the coefficient of the explanatory variable is negatively signed and the probability value is not less than 5% level of significance, otherwise reject the null. This condition is applicable to other hypothesis.
MODEL ONE
Table 9: Multiple Regression Table (OLS)
| Variables | Coefficients | T-statistic | P values | $R^2$ | Aj $R^2$ | P(f-stat | D W |
| STR | 21.9275 | ||||||
| (MAVO) | 0.207102 | 0.500124 | 0.6203 | 75% | 73% | 0.0000 | 1.33 |
| MOS(1) | 0.317342 | 2.026678 | 0.0508 | ||||
| EXS(1) | -0.347620 | -4.632320 | 0.0001 | ||||
| Nigeria | Coefficients | T-statistic | P values | $R^2$ | Aj $R^2$ | P(f-stat | D W |
| STR | -7.055453 | 0.66 | 0.60 | 0.0029 | 2.056 | ||
| (MAVO) | 1.571131 | 4.428479 | 0.0004 | ||||
| MOS(1) | 0.59600 | 3.129771 | 0.0061 | ||||
| EXS(1) | -0.00605 | -0.25013 | 0.7995 |
Researchers computation
Stock market liquidity, , Macroeconomic volatility
5.1 Results
South Africa From Table 10, the interpretation of the result as regards the coefficients of various repressors is stated as follows: The value of the intercept is 32.2550; it shows that stock market liquidity (STR) will experience a 32.25% increase when all other variables are held constant. The estimate coefficients, which are -0.35759 {INT, show that a unit decrease in interest rate will cause a 0.35% decrease in stock market liquidity (STR), 0.32828% {MOS, shows that a unit increase in money supply will cause a 0.32828% increase in stock market liquidity (STR), and -0.25395 {EXS, shows that a unit change in exchange rate will cause a -0.25% decrease in stock market liquidity (STR).
From Table 9, the interpretation of the result as regards the coefficients of various regressors is stated as follows: The value of the intercept is -7.055453; it shows that stock market liquidity (STR) will experience a 7.055% decrease when all other variables are held constant. The estimate coefficients, which are 1.571131 {MVO, show that a unit increase in macroeconomic volatility will cause a 1.57% increase in stock market liquidity (STR), 0.59600% {MOS} shows that a unit increase in money supply will cause a 0.59% increase in stock market liquidity (STR), and -0.006058 {EXS} shows that a unit change in exchange rate will cause a -0.006% decrease in stock market liquidity (STR).
The R2 of 66% implied that variation caused by (MVO) stock market volatility (STR) was explained by 66%, while the remaining 34% represents unexplained variables not included in the model and was taken care of by the error term. The adjusted R2 in the result shows 60% as the best fit of the model for the explanatory variable tested. There is evidence of positive autocorrelation since the DW statistic is 2.056. The p-value of the f-statistic is 0.000290, which concludes that the overall estimate is statistically significant.
Decision: The study fails to accept the null hypothesis since the coefficient value of the explanatory variable is positively signed (0.59600), indicating a positive impact on stock market liquidity and significance. The study therefore concludes that macroeconomic volatility has a positive and significant effect on stock market liquidity in Nigeria.
Test of Hypothesis Two
Statement of Hypothesis in null form
: Interest rate differentials did not have positive and significance impact on stock market liquidity in South Africa.
Table 10: Multiple Regression Table (OLS)
| Variables | Coefficients | T-statistic | P values | $R^2$ | Aj $R^2$ | P(f-stat | D W |
| STR | 32.2550 | 0.73 | 0.70 | 0.0000 | 1.04 | ||
| INT RATE | -0.35759 | -0.53762 | 0.5943 | ||||
| MOS(1) | 0.32828 | 1.63510 | 0.1113 | ||||
| EXS(1) | -0.25395 | *3.96832 | 0.0004 | ||||
| Nigeria | Coeffients | T-statistic | P values | $R^2$ | Aj $R^2$ | P(f-stat | D W |
| STR | -6.121344 | 0.32 | 0.20 | 0.077 | 1.05 | ||
| INT RATE | -0.006386 | -1.086833 | 0.2923 | ||||
| MOS(1) | 10.82669 | 2.171246 | 0.04444 | ||||
| LNEXS(1) | -3.257574 | -0.675649 | 0.5084 |
Stock market liquidity, Interest Rate Differentials, MOS = Money supply
EXS= Exchange rate
VI. DISCUSSION
5.1 Results
South Africa
From Table 10, the interpretation of the result as regards the coefficients of various repressors is stated as follows: The value of the intercept is 32.2550; it shows that stock market liquidity (STR) will experience a 32.25% increase when all other variables are held constant. The estimate coefficients, which are -0.35759 {INT, show that a unit decrease in interest rate will cause a 0.35% decrease in stock market liquidity (STR), 0.32828% {MOS, shows that a unit increase in money supply will cause a 0.32828% increase in stock market liquidity (STR), and -0.25395 {EXS, shows that a unit change in exchange rate will cause a -0.25% decrease in stock market liquidity (STR).
The R2 of 73% implied that variation caused by (INT) stock market volatility (STR) was explained by 73%, while the remaining 27% represents unexplained variables not included in the model and was taken care of by the error term. The adjusted R2 in the result shows 70% as the best fit of the model for the explanatory variable tested. There is evidence of positive autocorrelation since the DW statistic is 1.04. The p-value of the f-statistic is 0.0000, which concludes that the overall estimate is statistically significant.
Decision: The study accepts the null hypothesis since the coefficient value of the explanatory variable (bond rate) is negatively signed (-0.35759), indicating a negative impact on stock market liquidity; though not significant (0.5949), the study therefore concludes that bond interest rates have a negative and non-significance effect on stock market liquidity in South Africa.
Nigeria
From Table 10, the interpretation of the result as regards the coefficients of various regressors is stated as follows: The value of the intercept is -6.121344; it shows that stock market liquidity (STR) will experience a 6.12% decrease when all other variables are held constant. The estimate coefficients, which are -0.006 {INT, show that a unit decrease in interest rate will cause a 0.006% decrease in stock market liquidity (STR), 10.82% {MOS, shows that a unit increase in money supply will cause a 10.82% increase in stock market liquidity (STR), and -3.25 EXS, shows that a unit change in exchange rate will cause a -3.25% decrease in stock market liquidity (STR).
The of 32% implied that variation caused by (INT) stock market volatility (STR) was explained by 32%, while the remaining 68% represents unexplained variables not included in the model and was taken care of by the error term. The adjusted R2 in the result shows 20% as the best fit of the model for the explanatory variable tested. There is evidence of positive autocorrelation since the DW statistic is 1.05. The p-value of the f-statistic is 0.07, which concludes that the overall estimate is not statistically significant.
Decision: The study accepts the null hypothesis since the coefficient value of the explanatory variable (bond rate) is negatively signed (-0.006), indicating a negative impact on stock market liquidity; though not significant (0.2923), the study therefore concludes that bond interest rates have a negative and non-significance effect on stock market liquidity in Nigeria.
5.2 Theoretical Implication
The findings emanating from the impact of macroeconomic volatility and interest differentials on stock market liquidity are as follows:
-
Macroeconomic volatility has a positive and significant effect on the stock market liquidity in Nigeria, while in South Africa, macroeconomic volatility has a positive and non-significant effect on the stock market liquidity.
-
Interest rates have a negative and non-significant effect on stock market liquidity in South Africa and Nigeria.
Since the coefficient of macroeconomic volatility is -0.207 and 1.57 for South Africa and Nigeria, respectively, it implies that a change in the volatility by 1% will result by the same margin in a fall or a rise in the level of stock market liquidity that would be experienced in economic activity.
5.3 Practical Implication
These finding implicate the need for government enacts sound monetary policies in order to enhance economic growth in Nigeria and South Africa. The government will also need to benchmark for best practices in monetary policy development from those economies that are more advanced in order to develop better monetary policies that can improve the performance of the stock market.
5.4 Limitation and Future Decision
VII. CONCLUSION
The term stock market refers to various channels through which the shares of a publicly held company are bought and sold. Such financial activities are conducted under a given set of regulations. The market moves excess funds from savers (the surplus unit) to institutions (the deficit unit), which then invest them in productive uses.
All the explanatory variables in this study have elasticity less than unity (Es< 1). This implies that a proportionate change in any of the independent (X) variables will result in a proportionate change in stock market liquidity. With the findings resulting from this study, the following conclusions are drawn:
-
It will be important if the government enacts sound monetary policies in order to enhance economic growth in both countries under study. The government will also need to benchmark for best practices in monetary policy development from those economies that are more advanced in order to develop better monetary policies that can improve the performance of the stock market.
-
The government needs to create an enabling environment and promote infrastructural development to facilitate the ease of stock market activities in particular and the financial systems of both countries.
ACKNOWLEDGEMENTS
The author acknowledges all the participants, who, despite the tight schedules, took out time to complete the research instruments and return them on time.
Competing interests
The authors declare that they have no financial or personal relationship(s) that may have inappropriately influenced them in writing this article.
Author's contributions
I.O.I. collected and analysed the study data, conducted the literature search and prepared the final manuscript.
Ethical considerations
Ethical clearance was obtained from the Ethics Committee of the Department of Banking and Finance, Evangel University, Abakaliki Ebonyi State, Nigeria. Informed consent was obtained from all countries involved in the study.
Funding information
The author received no financial support for the research, authorship, and/or publication of this article.
Data availability
Derived data supporting the findings of this study are available from the corresponding author, I.O.I., upon reasonable request.
Disclaimer
The views and opinions expressed in this article are those of the author and do not necessarily reflect the official policy or position of any affiliated agency of the author.
Conflict of Interest
The authors declare no conflict of interest.
Ethical Approval
Not applicable
Data Availability
The datasets used in this study are openly available at [repository link] and the source code is available on GitHub at [GitHub link].
Funding
This work did not receive any external funding.
References
Cite this article
Related Research



Special Issue
Launch a focused special issue to highlight research, emerging trends, and expert insights in your academic field.
