




IntelliPaper
Abstract
The objectives were to quantify tree richness and estimate carbon stored during the recovery and development of tropical evergreen forest (BTP) affected by the traditional slash and burn (RTQ) system practiced by the Lacandon-Mayan ethnic group. This research was carried out in the Lacandona region of Mexico. The aim was to determine whether the RTQ system maintains tree species richness and whether stored C is recovered.
Methods. Dismantled areas were located with the RTQ system from 5, 10, and 20 years ago (BTR5, BTR10, and BTR20, respectively). To obtain tree richness, botanical collections of all tree species present in 0.1 ha plots of BTR5, BTR10, and BTR25, as well as two BTP plots (BTP1 and BTP2, respectively) were carried out. In each plot, height, diameter at breast height, and number of individuals of each tree species were recorded. To estimate the stored C, the equation proposed by Chave et al., (2005) was used, which relates the DAP and the density of the wood of each species.
Results. A tree richness of 71 species was obtained in 0.1 ha. In BTP1, 47 species were recorded and in BTP2, 38 species were recorded. The number of species increased (20, 17, and 39 species) according to the recovery age of the BTR (5, 10, and 20 years respectively), so the rest period is adequate for the recovery of tree richness. The accumulation of C in the trees showed that the RTQ system must modify the recovery or rotation age since the carbon stored at 5, 10, and 20 years was 29, 35, and 74 Mg C ha-1 respectively, while in BTP1 and BTP2 they were 478 and 512 Mg C ha-1 respectively. The polynomial model obtained indicates rest periods between 40 and 50 years to recover the C stored in the mature BTP.
Explore Digital Article Text
I. INTRODUCTION
The Evergreen Tropical Forest (BTP) is the dominant vegetation in the Lacandona region of Mexico and one of the ecosystems with the greatest floristic diversity.
In tropical areas, food production is through the slash-and-burn (RTQ) system. RTQ is considered a use sustainable system of BTP, which is still practiced by the Maya-Lacandon indigenous people (Ochoa-Gaona et al., 2007). And the rest or recovery periods are 15 to 20 years, which also allows the recovery of soil fertility (Diemont et al., 2006). However, it has also been pointed out that it is necessary to reduce the burning of agricultural waste because they are a source of Dioxins (Comisión para la Cooperación Ambiental, 2014).
Currently, the BTP rest or recovery times have been altered, and have even been reduced to seven years, so the question is: Does the tree wealth and the amount of carbon stored in a BTP recover in 20 years or less? To respond, the objectives of this work were: 1) Determine the variation and recovery of tree richness of the BTP, affected by the RTQ system in different years; and 2) To estimate how many years are required to recover the amount of C stored in a BTP after the RTQ system.
Answering these questions will help us develop better strategies for using and conserving BTP where this traditional farming system is practiced.
II. STUDY AREA DESCRIPTION
Location. This project was realized in the "Tres Lagunas" ecotourism center located in the town of San Javier, Municipality of Ocosingo, Chiapas, Mexico, which is located in the Lacandona region in the Montes Azules Biosphere Reserve, at the coordinates N, y W. Chiapas is located in the physiographic province of the highlands of Chiapas and Guatemala itself, which is divided into five subprovinces: Sierras Plegadas del Norte, Meseta de Chiapas, Central Depression, Coastal Plain of Chiapas and Sierra de Chiapas (Instituto Nacional de Ecología INE, 2000).
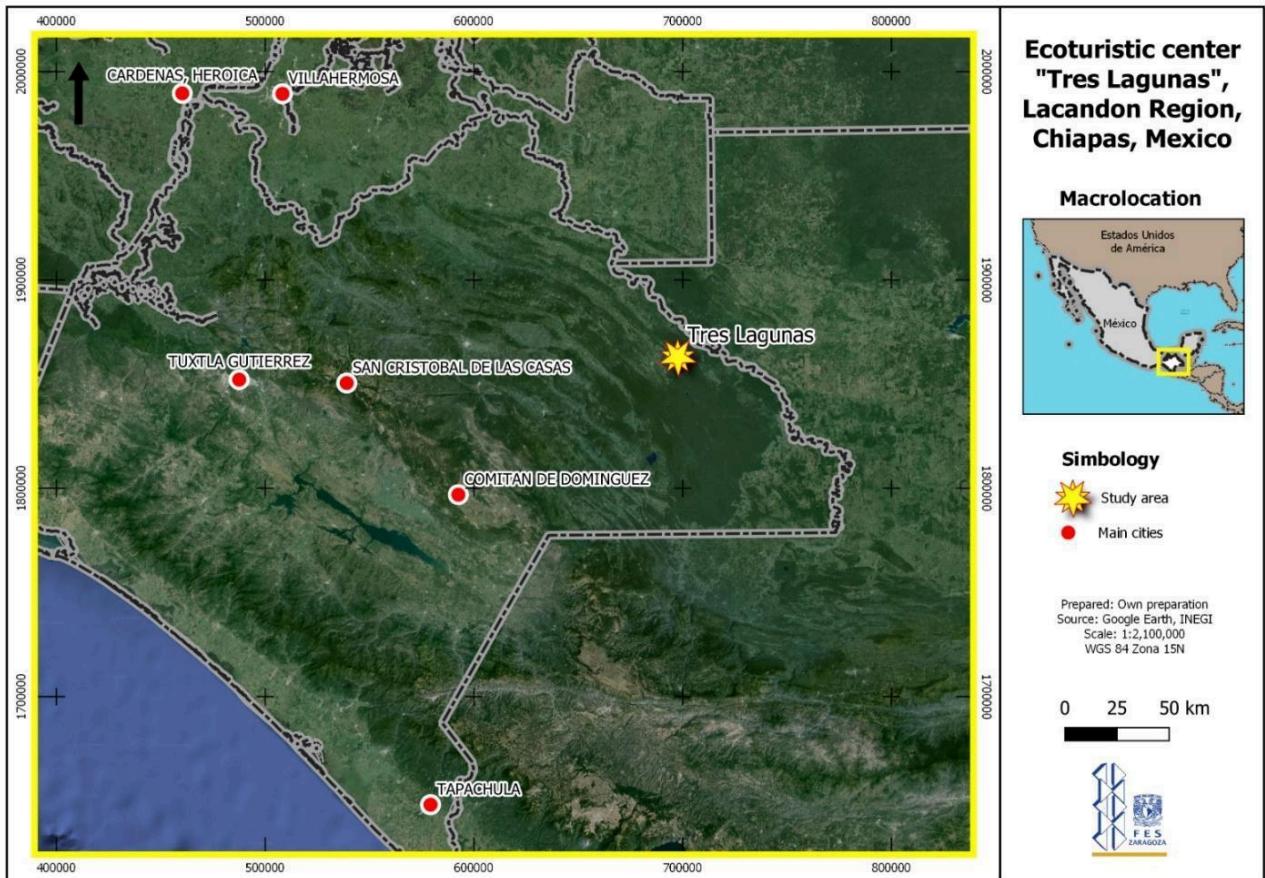
Figure 1. Location of the Ecotourism center "Tres Lagunas", in the Lacandona Region, Chiapas, Mexico.
Clime: The average annual temperature varies from 24 to 26 °C. Precipitation in the Lacandona region varies from 1,500 to 3,500 mm per year and is affected by the rugged relief of the mountains of Chiapas (INE, 2000).
Geology: It presents limestone rocks, with breaks, fractures, faults, and joints being, the elements that control the position of the karst forms. (INE, 2000).
Edaphology: Rendzines predominate in areas whose main geological substrates are limestone and sandstone. Its soils are shallow (3 cm thick), predominantly relatively acidic Lithosols (Leptsosols), with little organic matter, low fertility, and silt-clay texture (INE, 2000).
Hydrology: The hydrological region belongs to the Grijalva-Usumacinta system, which is one of the largest in the country (1550,200 ha), according to INE (2000).
Vegetation: This Evergreen Tropical Forest is characterized by having a closed and evergreen canopy where the trees in the upper layer have an average height of 30 m, although they can reach between 65 and 75 m. In this type of vegetation, woody climbing plants are abundant. The dominant tree species are canshán (Terminalia amazonia), guapaque (Dialium guianense), ramón (Brosimum alicastrum), chicozapote (Manilkara zapota), barí (Calophyllum brasilense), caoba (Swietenia macrophylla), palo mulato (Bursera simaruba), tinco (Vatairea lundellii) y bayo (Aspidosperma cruentum) (INE, 2000).
III. MATERIALS AND METHODS
Site selection: Sites locally called "acahuales" were selected, which are Tropical Forests in Recovery (BTR) of 5, 10, and 20 years (BTR20). The owner of the land, Mr. Pablo Chankin proportionated some data on the age and location of the BTR. Likewise, two areas of conserved and mature tropical forest (BTP) were located to have reference sites, which are characterized by the presence of trees with diameters at chest height between 30 and 60 cm, with well-developed buttresses and wide, which according to Pennington and Sarukhán (2005) correspond to mature phases of the development of a forest. The BTR and BTP are relatively close and on the edge of a conserved forest, under the same management system, soil group, and geology, based on the digital map provided by GEODATA (2008).
Tree species sample collection: Circular plots with an area of 0.1 ha were delimited which were divided into eight subplots. The five plots (0.5ha) correspond to two evergreen tropical forest sites (BTP1 and BTP2) and three plots of acahuales or tropical forests in recovery, 5, 10, and 20 years after being affected by the RTQ system (BTR5, BTR10, and BTR20). The location of each plot can be seen in Figure 2. In each subplot, the common name, basal area, and density of the tree species were recorded. Diameter at breast height (DBH) and coverage (in centimeters) were measured for each individual.
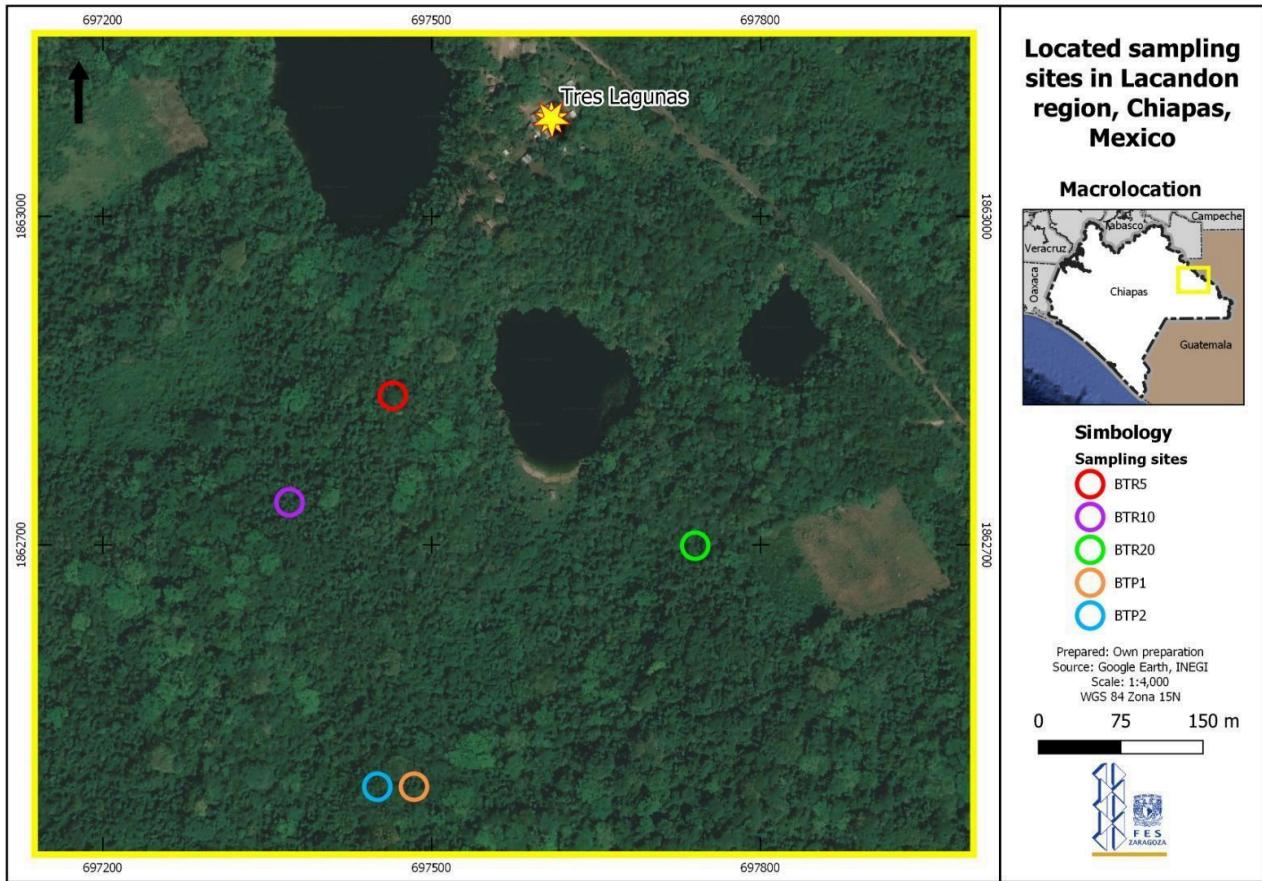 Figure 2: Location of sampling sites.
Subsequently, with the recorded data, the relative values of the frequency, density, basal area, and ecological importance value index of the species were obtained, by applying the following formulas:
Relative frequency (Fr). It was estimated as the number of subplots in which each species appeared.
Relative density (RD). The relative density was calculated as follows:
RD=(Absolute density per species/Absolute density of all species) × 100
Where:
Absolute density DA = Number of individuals of a species/Area sampled
Relative basal area (AB). It is the basal area of each species divided by the total basal area in the subplot times
The basal area (AB) is given by the formula: , where r is the tree radio DAP (diameter at chest height) of each species.
Importance value (VIR). It is defined as the sum of the values of frequency, density and, relative basal area.
Likewise, the tree diameter structure was obtained in each BTR, which is obtained from a graph of the number of individuals per diameter class.
Diversity index (DI): The Chao2 index was used. This estimator is based on the presence-absence of a species in a given sample, that is, only if the species is present and how many times that species is present in the set of subplots. According to Escalante-Espinoza (2003), it is calculated with the following formula:
where:
Sest= estimated number of species
Sobs= number of species observed
L= number of species occurring in a subplot (single species), and
M= number of species occurring in exactly two subplots (double or duplicate species).
The Chao2 index is an estimator of species diversity and tells us how diversity changes in each BTR and at what point it will resemble the BTP.
Similarity analysis. This analysis is carried out to evaluate the similarity of the tree composition of each BTR with the BTP. A cluster or hierarchical grouping analysis was used to obtain a dendrogram: Using the Stata V.8 package, the similarity index (SI) was applied as follows:
where:
a = number of species present at all sampling sites: A, B, C, D.
b= number of species present at one site A but absent at another B, C, D.
c = number of species present at site B but absent at A, C, D.
d = number of species that are not present in the two samples that are compared.
Determination of species and comparison of specimens. With the help of local parataxonomists, the species with the common name were determined, subsequently, specimens were collected for identification, based on Pennington and Sarukhán (2005) and they were collated in the INIF Herbarium (National Forest Herbarium) Mexico.
Carbon sequestration estimate . One of the approaches to quantifying the carbon stored in biomass consists of converting the data inventoried in the field through regression models. The equation developed by Chave et al. (2005) relates the density of the wood and the diameter at breast height to calculate the total aerial biomass, with the following formula:
ABG = Total aerial biomass.
Wood density.
diameter at breast height.
The value obtained is multiplied by the percentage of carbon contained in the trees, which is 47% (according to Kirby and Potvin, 2007), with which the amount of carbon stored in a tree.
The value obtained from each tree is multiplied by the number of plants per tree species. You do the same for each species and add up the total C stored at each sampling point and multiply it by 10 to get the amount of carbon per hectare of the BTR and BTP was obtained.
IV. RESULTS
A total of 1,662 stems corresponding to 71 species belonging to 33 botanical families were recorded.
Estructura diamétrica: Diametric structure. BTP1 has trees with DBH less than 0.01 m and up to 1.23 and 1.71 m, the latter corresponding to Terminalia amazonia. Trees with DBH less than 0.01 m, 1.03 m, and up to 1.60 m, corresponding to Manikara zapota and Dialium guanine, were also recorded in Tropical Evergreen Forest 2 (BTP2).
In the 5 and 10-year BTRs, diameter categories of 0.01 to 0.3 m are presented. In BTR20 there are trees with DAP less than 0.01 m and up to 0.6 m (of the species, Cryophillum mexicanum). In all cases, the predominant diameter category is 0.01 to 0.1 m and a lesser extent 0.11 to 0.2 m. Only in the BTPs do individuals appear with a DBH greater than 0.7. Table 1 shows the number of individuals with diameter intervals at chest height for each site sampling.
Table 1: Variation in the diameter structure and number of trees, in BTR of 5, 10, and 20 years and two evergreen tropical forests (BTP1 and BTP2) in the Lacandon Region, Chiapas.
| Site | Diameter at breast height DAP (cm) | ||||||||||
| <1 | 1-10 | 11-20 | 21-30 | 31-40 | 41-50 | 51-60 | 61-70 | 71-80 | 81-90 | >100 | |
| BTR5 | 0 | 120 | 70 | 1 | 0 | 0 | 0 | 0 | 0 | 0 | 0 |
| BTR10 | 0 | 263 | 90 | 9 | 0 | 0 | 0 | 0 | 0 | 0 | 0 |
| BTR20 | 18 | 333 | 44 | 18 | 3 | 0 | 1 | 0 | 0 | 0 | 0 |
| BTP1 | 64 | 328 | 25 | 12 | 4 | 1 | 2 | 0 | 1 | 0 | 2 |
| BTP2 | 52 | 226 | 20 | 19 | 9 | 2 | 0 | 0 | 0 | 1 | 2 |
Note: BTR5=Tropical Forest in Recovery, 5 years; Tropical Forest in Recovery, 10 years; Tropical Forest in Recovery, 20 years; BTP1=Tropical Evergreen Forest 1; BTP2=Tropical Evergreen Forest 2.
Structure and composition of the vegetation: The structure in BTP1 is composed of 47 species. The species Terminalia amazonia recorded the highest VIR value of 18.8. The next six species with VIR greater than three were: Metopium brownei, Spondias mombin, Astrocaryum mexicanum, Quercus sp., Sloanea schippii, and Trichospermum mexicanum.
Table 2: Tree vegetation structure, relative density, relative frequency, and relative Basal Area, and relative importance value in the BTP1, of the Lacandona region, Chiapas.
| Species | Dr | Fr | ABr | VIR |
| (%) | ||||
| Terminalia amazonia (J.F.Gmel.) Exell | 1.5 | 3.8 | 51.1 | 18.8 |
| Metopium brownei (Jacq.) Urban. | 17.4 | 6.9 | 13.6 | 12.6 |
| Spondias mombin L. | 9 | 6.3 | 0.2 | 5 |
| Astrocaryum mexicanum Lieb. Ex Mart. | 6.8 | 6.3 | 1.9 | 5 |
| Quercu ssp. | 8.6 | 5.6 | 0.4 | 4.9 |
| Sloanea schippii Standl. | 7.1 | 5 | 2 | 4.7 |
| Trichospermum mexicanum (DC.) Baill. | 1.5 | 3.8 | 8 | 4.4 |
| Chrysophillum mexicanum Brandegee | 4.9 | 4.4 | 0.7 | 3.3 |
| Nectandra ambigens (Blake) C.K. Allen | 4.2 | 5 | 0.6 | 3.2 |
| Dialium guianense (Aubl.) Sandw. | 3.9 | 3.8 | 1.7 | 3 |
| Psidium guajava L. | 3.2 | 3.8 | 1.8 | 2.9 |
| Vatairea lundelli (Standl.) Killip ex Record | 4.6 | 3.8 | 0.2 | 2.9 |
| Ampelocera hottlei (Standl.) Standl. | 3.9 | 3.8 | 0.8 | 2.8 |
| Brosimum alicastrum Sw. | 3.4 | 3.8 | 0.5 | 2.6 |
| Enterolobium cyclocarpum (Jacq.) Griseb. | 0.2 | 0.6 | 6.2 | 2.4 |
| Bursera simaruba (L.) Sarg. | 0.5 | 1.3 | 3.8 | 1.8 |
| Ficus cotinifolia Kunth | 0.7 | 1.9 | 2.8 | 1.8 |
| Mortoniodendron guatemalense Standl. & Steyerm | 1.7 | 2.5 | 0.6 | 1.6 |
| Swietenia macrophylla King | 1.5 | 3.1 | 0.1 | 1.6 |
| Simira salvadorensis (Standl.) Steyerm | 1 | 1.9 | 1.1 | 1.3 |
| Stemmadenia donnell-smithii (Rose) Woodson | 1 | 2.5 | 0.3 | 1.2 |
| Pithecellobium arboreum (L.) Urban. | 1.2 | 1.9 | 0 | 1 |
| Parathesis serrulata Mez. | 1 | 1.9 | 0.1 | 1 |
| Calophyllum brasiliense Cambess. | 1 | 1.9 | 0 | 1 |
| Astronium graveolens Jacq. | 0.7 | 1.9 | 0.1 | 0.9 |
| Hampea nutricia Fryxell | 0.7 | 1.9 | 0.1 | 0.9 |
| Alseis yucatanensis Standl. | 0.7 | 1.9 | 0 | 0.9 |
| Garcinia intermedia (Pittier) Hammel | 0.7 | 1.9 | 0 | 0.9 |
| Bola de perro ND | 0.7 | 1.3 | 0.1 | 0.7 |
| Pimenta dioica (L.) Merrill | 0.5 | 1.3 | 0.1 | 0.6 |
| Geonoma binervia Oerst. | 0.5 | 1.3 | 0 | 0.6 |
| Vernonia deppeana Less. | 0.5 | 1.3 | 0 | 0.6 |
| Sommera grandis (Bertl.) Standl. | 0.5 | 1.3 | 0 | 0.6 |
| Pachira aquatica Aubl. | 0.7 | 0.6 | 0.2 | 0.5 |
| Cecropia obtusifolia Bertol. | 0.2 | 0.6 | 0.4 | 0.4 |
| Schefflera morototonii (Aubl.) Maguire, Steyerm. &Frodin | 0.5 | 0.6 | 0.1 | 0.4 |
| Mata blanca ND | 0.5 | 0.6 | 0.1 | 0.4 |
| Ceratonia siliqua L. | 0.5 | 0.6 | 0 | 0.4 |
| Tabebuia rosea (Bertol.) DC. | 0.2 | 0.6 | 0.1 | 0.3 |
| Cassia holwayana Rose. | 0.2 | 0.6 | 0 | 0.3 |
| Aspidosperma megalocarpon Müll. Arg. | 0.2 | 0.6 | 0 | 0.3 |
| Quararibea funebris (La Llave) Vischer | 0.2 | 0.6 | 0 | 0.3 |
| Ficus máxima Mill. | 0.2 | 0.6 | 0 | 0.3 |
| Lysiloma acapulcensis (Kunth) Benth. | 0.2 | 0.6 | 0 | 0.3 |
| Byrsonima crassifolia (L.) Kunt. | 0.2 | 0.6 | 0 | 0.3 |
| Majab ND | 0.2 | 0.6 | 0 | 0.3 |
| Lysiloma latisiliquum (L.) Benth. | 0.2 | 0.6 | 0 | 0.3 |
Note: Dr: Relative density; Fr= Relative frequency; AB= Relative basal area; VIR= Importance value; ND= undetermined species.
The BTP2 structure is composed of 38 species. The species Dialium guianense has a relative density of 3.0%, a relative frequency of 3.7%, and a relative basal area of 34.4%. D. guianense also obtained the highest VIR; followed by Metopium brownei, Quercus sp., Spondias mombin, Terminalia amazonia, Brosimum alicastrum, Manikara zapota, Psidium guajava and Swietenia macrophylla (Table 3).
Table 3: Tree vegetation structure, relative density, relative frequency, and relative Basal Area, and relative importance value in the BTP2, of the Lacandona region, Chiapas.
| Species | Dr | Fr | AB | VIR | |
| (%) | |||||
| Dialium guianense (Aubl.) Sandw. | 3 | 3.7 | 33.4 | 13.4 | |
| Metopium brownei (Jacq.) Urban. | 10.8 | 7.5 | 19 | 12.4 | |
| Quercus sp. | 20.5 | 9 | 2.2 | 10.6 | |
| Spondias mombin L. | 10.8 | 7.5 | 0.1 | 6.1 | |
| Terminalia amazonia (J.F.Gmel.) Exell | 9.9 | 5.2 | 0.2 | 5.1 | |
| Brosimum alicastrum Sw. | 5.4 | 6 | 3.3 | 4.9 | |
| Manilkara zapota (L.) Royen | 0.3 | 0.7 | 13.2 | 4.8 | |
| Psidium guajava L. | 6.3 | 6.7 | 0.5 | 4.5 | |
| Swietenia macrophylla King | 0.9 | 2.2 | 10.2 | 4.4 | |
| Vernonia deppeana Less. | 4.2 | 6.7 | 0.8 | 3.9 | |
| Astrocaryum mexicanum Lieb. Ex Mart. | 4.2 | 5.2 | 1.2 | 3.5 | |
| Nectandra ambigens (Blake) C.K. Allen | 4.5 | 4.5 | 1.2 | 3.4 | |
| Simira salvadorensis (Standl.) Steyerm | 1.2 | 1.5 | 4 | 2.2 | |
| Bursera simaruba (L.) Sarg. | 0.9 | 1.5 | 4.3 | 2.2 | |
| Mortoniodendron guatemalense Standl. &Steyerm | 1.8 | 3.7 | 0.1 | 1.9 | |
| Chrysophillum mexicanum Brandegee | 2.4 | 3 | 0.1 | 1.8 | |
| Hampea nutricia Fryxell | 1.2 | 3 | 1.1 | 1.8 | |
| Ampelocera hottlei Standl. | 1.2 | 2.2 | 1.1 | 1.5 | |
| Sloanea schippii Standl. | 1.2 | 2.2 | 0.1 | 1.2 | |
| Zuelania guidonia (Sw.) Britt. & Millisp. | 0.9 | 1.5 | 0.6 | 1 | |
| Parathesis serrulata Mez. | 1.2 | 1.5 | 0 | 0.9 | |
| Schefflera morototonii (Aubl.) Maguire, Steyerm. &Frodin | 0.6 | 1.5 | 0.6 | 0.9 | |
| Lonchocarpus cruentus Lundell | 0.9 | 1.5 | 0 | 0.8 | |
| Majasté ND | 0.6 | 1.5 | 0.1 | 0.7 | |
| Calophyllum brasiliense Cambess. | 0.6 | 1.5 | 0 | 0.7 | |
| Cassia holwayana Rose. | 0.3 | 0.7 | 1 | 0.7 | |
| Trichospermum mexicanum (DC.) Baill. | 0.3 | 0.7 | 0.9 | 0.7 | |
| Mata blanca ND | 0.6 | 0.7 | 0.2 | 0.5 | |
| Stemmadenia donnell-smithii (Rose) Woodson | 0.3 | 0.7 | 0.1 | 0.4 | |
| Astronium graveolens Jacq. | 0.3 | 0.7 | 0.1 | 0.4 | |
| Sapindus saponaria L. | 0.3 | 0.7 | 0 | 0.4 | |
| Alseis yucatanensis Standl. | 0.3 | 0.7 | 0 | 0.4 | |
| Pseudolmedia oxyphyllaria Donn.Sm. | 0.3 | 0.7 | 0 | 0.4 | |
| Cydista aequnoctilis (L.) Miers. | 0.3 | 0.7 | 0 | 0.3 | |
| Pachira aquatica Aubl. | 0.3 | 0.7 | 0 | 0.3 | |
| Vatairea lundelli (Standl.) killip ex Record | 0.3 | 0.7 | 0 | 0.3 | |
| Garcinia intermedia (Pittier) Hammel | 0.3 | 0.7 | 0 | 0.3 | |
| Pimenta dioica (L.) Merrill | 0.3 | 0.7 | 0 | 0.3 | |
Note: Dr: Relative density; Fr= Relative frequency; AB= Relative basal area; VIR= Importance value; ND= undetermined species.
The BTR5 structure is composed of 20 species. The species Trichospermum mexicanum presents a relative density, frequency, and basal area of 72.3%, 17%, and 66%, respectively, and a VIR of 51.8, followed by Heliocarpus donnell-smithii, Cecropia obtusifolia, Ficus maxima and Sommera grandis (Table 4).
Table 4: Tree vegetation structure, relative density, relative frequency, and relative Basal Area, and relative importance value in the BTR5, of the Lacandona region, Chiapas. Note: Dr: Relative density; Fr= Relative frequency; AB= Relative basal area; VIR= Importance value; ND= undetermined species.
| Species | Dr | Fr | AB | VIR |
| (%) | ||||
| Trichospermum mexicanum (DC.) Baill. | 72.3 | 17 | 66 | 51.8 |
| Heliocarpus donnell-smithii Rose | 4.7 | 12.8 | 6.8 | 8.1 |
| Cecropia obtusifolia Bertol. | 4.7 | 10.6 | 5.9 | 7.1 |
| Ficus máxima Mill. | 4.7 | 10.6 | 3 | 6.1 |
| Sommera grandis (Bertl.) Standl. | 3.1 | 8.5 | 4.2 | 5.3 |
| Dialium guianense (Aubl.) Sandw. | 1 | 4.3 | 2.1 | 2.5 |
| Quercus sp. | 1 | 4.3 | 0.9 | 2.1 |
| Astronium graveolens Jacq. | 1 | 4.3 | 0.8 | 2 |
| Piscidia piscipula (L.) Sarg. | 1 | 4.3 | 0.4 | 1.9 |
| Alseis yucatanensis Standl. | 0.5 | 2.1 | 2.6 | 1.7 |
| Oreopanax liebmanii Marchal. | 1 | 2.1 | 1.5 | 1.5 |
| Cydista aequnoctilis (L.) Miers. | 0.5 | 2.1 | 2 | 1.5 |
| Brosimum alicastrum Sw. | 0.5 | 2.1 | 1.4 | 1.4 |
| Castilla elástica Cerv. | 0.5 | 2.1 | 1.3 | 1.3 |
| ND | 0.5 | 2.1 | 0.5 | 1.1 |
| Luehea speciosa Willd. | 0.5 | 2.1 | 0.1 | 0.9 |
| Lonchocarpus cruentus | 0.5 | 2.1 | 0.1 | 0.9 |
| Tabebuia rosea (Bertol.) DC. | 0.5 | 2.1 | 0.1 | 0.9 |
| Cassia holwayana Rose. | 0.5 | 2.1 | 0.1 | 0.9 |
| Nectandra ambigens (Blake) C.K. Allen | 0.5 | 2.1 | 0.1 | 0.9 |
The structure of BTR10 is composed of 17 species. The species Trichospermum mexicanum and Zexmenia frutescens are the species that present the highest values of density and relative frequency. The species with the highest VIR were Trichospermum mexicanum and Zexmenia frutescens, Bursera simaruba, and Nectandra ambigens (Table 5).
Table 5: Tree vegetation structure, relative density, relative frequency, and relative Basal Area, and relative importance value in the BTR10, of the Lacandona region, Chiapas. Note: Dr: Relative density; Fr= Relative frequency; AB= Relative basal area; VIR= Importance value; ND= undetermined species.
| Species | Dr | Fr | AB | VIR |
| (%) | ||||
| Trichospermum mexicanum (DC.) Baill. | 28.2 | 17 | 65.3 | 36.8 |
| Zexmenia frutescens Blake. | 58.7 | 17 | 29.5 | 35.1 |
| Bursera simaruba (L.) Sarg. | 2.6 | 10.6 | 0.5 | 4.6 |
| Nectandra ambigens (Blake) C.K. Allen | 2.6 | 8.5 | 1.9 | 4.3 |
| Ficus máxima Mill. | 1.3 | 6.4 | 0.5 | 2.7 |
| Astronium graveolens Jacq. | 1 | 6.4 | 0.8 | 2.7 |
| Spondias mombin L. | 1.3 | 6.4 | 0.4 | 2.7 |
| Aspidosperma megalocarpon Müll. Arg. | 1 | 6.4 | 0.1 | 2.5 |
| Alseis yucatanensis Standl. | 0.6 | 4.3 | 0.1 | 1.7 |
| Árbol ND | 0.6 | 2.1 | 0.1 | 1 |
| Schefflera morototonii (Aubl.) Maguire, Steyerm. &Frodin | 0.3 | 2.1 | 0.3 | 0.9 |
| Sommera grandis (Bertl.) Standl. | 0.3 | 2.1 | 0.2 | 0.9 |
| Swietenia macrophylla King. | 0.3 | 2.1 | 0.2 | 0.9 |
| Cecropia obtusifolia Bertol. | 0.3 | 2.1 | 0.1 | 0.9 |
| Topotste ND | 0.3 | 2.1 | 0.1 | 0.8 |
| Alchornea latifolia Swartz | 0.3 | 2.1 | 0.1 | 0.8 |
| Pithecellobium arboreum (L.) Urban. | 0.3 | 2.1 | 0.03 | 0.8 |
The BTR20 structure is composed of 39 species. The species Trichospermum mexicanum presented a relative density, frequency, and basal area of 16.5%, 6.7%, and 52.9%, the VIR for T. mexicanum was 25.4. Other species that presented a VIR > 3 were: Sommera grandis, Quercus sp., Nectandra ambigens, Hampea nutricia, Chrysophillum mexicanum, Astronium graveolens, Swietenia macrophylla, Alseis yucatanensis and Schefflera morototonii (Table 6).
Table 6: Tree vegetation structure, relative density, relative frequency, and relative Basal Area, and relative importance value in the BTR20, of the Lacandona region, Chiapas.
| Specie | Dr | Fr | AB | VIR |
| (%) | ||||
| Trichospermum mexicanum (DC.) Baill. | 16.5 | 6.7 | 52.9 | 25.4 |
| Sommera grandis (Bertl.) Standl. | 11.2 | 6.7 | 8.1 | 8.7 |
| Quercus sp. | 16.5 | 6.7 | 1.6 | 8.3 |
| Nectandra ambigens (Blake) C.K. Allen | 13.2 | 5.2 | 3 | 7.1 |
| Hampea nutricia Fryxell. | 5.7 | 4.5 | 2.3 | 4.2 |
| Chrysophillum mexicanum Brandegee. | 0.7 | 1.5 | 10.3 | 4.2 |
| Astronium graveolens Jacq. | 2.6 | 4.5 | 4.6 | 3.9 |
| Swietenia macrophylla King. | 4.3 | 5.2 | 1.3 | 3.6 |
| Alseis yucatanensis Standl. | 4.3 | 4.5 | 1.1 | 3.3 |
| Schefflera morototonii (Aubl.) Maguire, Steyerm. & Frodin | 2.6 | 3.7 | 2.7 | 3 |
| Calophyllum brasiliense Cambess. | 3.1 | 4.5 | 0.2 | 2.6 |
| Bursera simaruba (L.) Sarg. | 2.2 | 3.7 | 1.4 | 2.4 |
| Tabebuia rosea (Bertol.) DC. | 0.5 | 0.7 | 5.3 | 2.2 |
| Palo rayo ND | 2.2 | 3.7 | 0.5 | 2.1 |
| Vatairea lundelli (Standl.) killip ex Record | 1.9 | 3.7 | 0.7 | 2.1 |
| Psidium guajava L. | 1.2 | 3.7 | 0.4 | 1.8 |
| Alchornea latifolia Swartz | 1 | 3 | 0.3 | 1.4 |
| Vernonia deppeana Less. | 1 | 3 | 0.1 | 1.4 |
| Bola de perro ND | 1.4 | 2.2 | 0.4 | 1.4 |
| Acosmium panamense (Benth.) Yakovlev | 1 | 3 | 0.1 | 1.3 |
| Terminalia amazonia (J.F.Gmel.) Exell | 1 | 2.2 | 0.4 | 1.2 |
| Lonchocarpus cruentus Lundell. | 0.7 | 1.5 | 0.8 | 1 |
| Spondias mombin L. | 0.7 | 2.2 | 0 | 1 |
| Manilkara zapota (L.) Royen | 0.5 | 1.5 | 0.1 | 0.7 |
| Eschweilera mexicana Wendt, Mori and Prance. | 0.5 | 1.5 | 0 | 0.7 |
| Simira salvadorensis (Standl.) Steyerm | 0.5 | 1.5 | 0 | 0.7 |
| Pithecellobium arboreum (L.) Urban. | 0.5 | 0.7 | 0.3 | 0.5 |
| Dialium guianense (Aubl.) Sandw. | 0.2 | 0.7 | 0.5 | 0.5 |
| Pimenta dioica (L.) Merrill | 0.2 | 0.7 | 0.2 | 0.4 |
| Sapindus saponaria L. | 0.2 | 0.7 | 0.2 | 0.4 |
| Aspidosperma megalocarpon Müll. Arg. | 0.2 | 0.7 | 0.1 | 0.4 |
| Blepharidium mexicanum Standl. | 0.2 | 0.7 | 0 | 0.3 |
| Lysiloma acapulcensis (Kunth) Benth. | 0.2 | 0.7 | 0 | 0.3 |
| Zit-it ND | 0.2 | 0.7 | 0 | 0.3 |
| Palo morado ND | 0.2 | 0.7 | 0 | 0.3 |
| Platymiscium yucatanum Standl. | 0.2 | 0.7 | 0 | 0.3 |
| Centradenia floribunda Planchon. | 0.2 | 0.7 | 0 | 0.3 |
| Parathesis serrulata Mez. | 0.2 | 0.7 | 0 | 0.3 |
| Sloaneaschippii Standl. | 0.2 | 0.7 | 0 | 0.3 |
Note: Dr: Relative density; Fr= Relative frequency; AB= Relative basal area; VIR= Importance value; ND= undetermined species.
Species diversity (Chao2) and tree density (number of stems) are similar between BTR recovered 20 years later and conserved evergreen tropical forests. Table 7 shows the diversity index for the five sampled sites.
Table 7: Chao 2 diversity index, in VTR and evergreen tropical forest, of the Lacandona region, Chiapas. Note: BTR5=Tropical Forest in Recovery, 5 years; Tropical Forest in Recovery, 10 years; Tropical Forest in Recovery, 20 years; BTP1=Tropical Evergreen Forest 1; BTP1=Tropical Evergreen Forest 2.
| Sitio | Species number | Stems number | Chao2 diversity index |
| BTR5 | 20 | 191 | 21 |
| BTR10 | 17 | 312 | 49 |
| BTR20 | 38 | 418 | 55 |
| BTP1 | 47 | 409 | 63 |
| BTP2 | 38 | 332 | 50 |
| TOTAL | 71 | 1662 |
Tree richness: In BTP1, 47 species were recorded, and in BTP2 38 species. In the 20-year BTR the species richness is similar to that of the conserved sites (39 species); while for sites with a shorter recovery time, the species richness is lower (Figure 3).
{"image_source":{"path":"images/34734146f49de168b313d98986bce38095ca06430a46073243d451e6472b5caf.jpg"},"content":"","chart_caption":[{"type":"text","content":"Figure 3: Tree richness in BTR of different ages and two evergreen tropical forests, in the Lacandon region, Chiapas."}],"chart_footnote":[]}
Tree density: The results showed 4,090 and 3,220 individuals ha for BTP1 and BTP2, respectively. After 20 years of recovery, in the BTR the tree density was 4,810; while in BTR5 it was 1,910 and in BTR10 it was 3,120 individuals.
Variation of tree composition: In BTR 5 one and then two species dominate. After 20 years the tree richness becomes very similar to that of the conserved and mature BTP. In BTR5 the species Trichospermum mexicanum covers 73% of the tree composition, the remaining 28% is made up of other species. In BTR10, the species Zexmenia frutescens and Trichospermum mexicanum represent 87% and 13% respectively of the tree species composition. In BTR 20 the species T. mexicanum, Quercus sp., Nectandra ambigens, and Sommera grandis represent 57% of the tree composition, but the remaining 43% is composed of other species. In BTP1, Species Metopium brownei, Spondias mombin, Quercus sp., Sloanea schipii, and Astrocaryum mexicanum represent 49% of the tree composition, while 51% is composed of other species. In BTP2 the species Quercus sp., Metopium brownei, Spondias mombin, and Terminalia amazonia represent 52% of the tree composition and the remaining 48% is covered by other species (Figure 4).
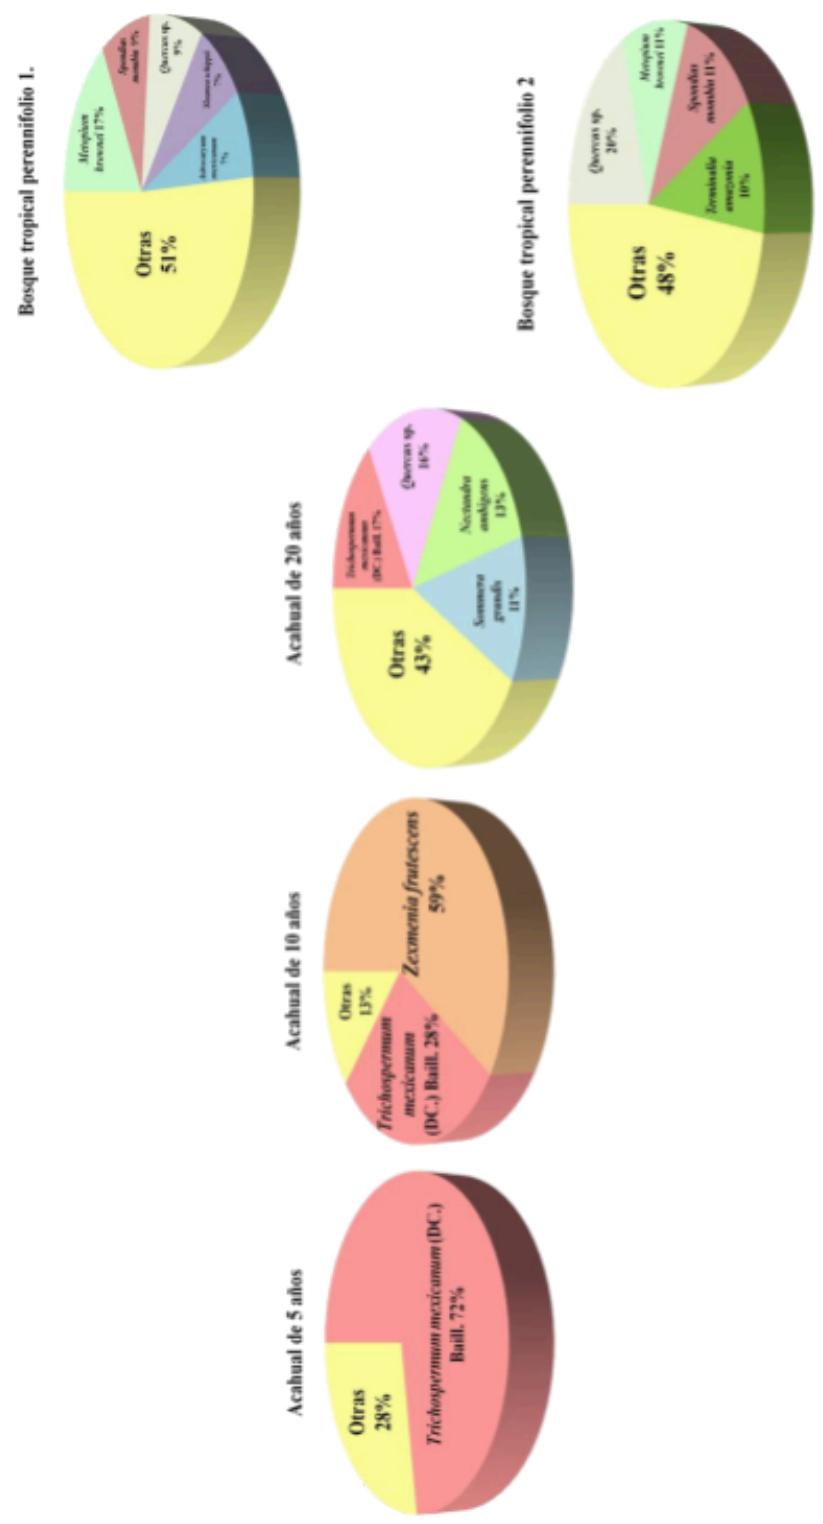 Figure 4: Variation of tree composition in acahuales of 5, 10, and 20 years, derived from a tropical evergreen forest subjected to slash-and-burn systems and two tropical evergreen forest sites, in the Lacandona region, Chiapas.
Similarity analysis. The dendrogram shows two groups. In the first, BTP1 and BTP2 show 68% similarity and 50% with BTR20. The other group is composed of BTR5 and BTR10 with 39% similarity. According to the Jaccard index, there is the same number of groups, however, the similarity between BTR5 and BTR10 was lower.
Stored carbon. The amount of carbon stored in BTP1 and BTP2 was estimated to be a total of 479 and 513 Mg C ha respectively. In BTR5, BTR10, and BTR20, the stored carbon obtained was 29, 35, and 80 Mg C ha respectively (Figure 5). The polynomial equation obtained was: , con , and describes the increase in stored carbon concerning the age of the BTR (Figure 5).
{"image_source":{"path":"images/97b5938fb4e211efe5d08c545c64087905ab3e5b446b683dc8d999a8291684d8.jpg"},"content":"","chart_caption":[{"type":"text","content":"Figure 5: Stored carbon (Mg C ha "},{"type":"equation_inline","content":"^{-1}"},{"type":"text","content":") in BTR of 5, 10, and 20 years and in two evergreen tropical forests, concerning that captured in the Panama BTP. The BTRs are a product of the application of the slash-and-burn system."}],"chart_footnote":[]} {"image_source":{"path":"images/4a713e2120153357631f4be22f83c7f600107840814b3307dfabf5d310969980.jpg"},"content":"","chart_caption":[{"type":"text","content":"Figure 6: Hypothetical polynomial model of carbon stored during the development of the BTR in the first 20 years, in a tropical forest in the Lacandona Region, Chiapas."}],"chart_footnote":[]}
To know the time that must elapse for a BTR to store C similar to that of a tropical evergreen forest subjected use RTQ, the equation shown in Figure 7 was used. According to this extrapolation, at least 50 years are required for BTR to reach stored carbon values similar to those of mature BTP.
{"image_source":{"path":"images/7c1186d9f901722603dd6400d21a4141ffcffcef9148f30f3aeb4b4f8cd79149.jpg"},"content":"","chart_caption":[{"type":"text","content":"Figura 7: Modelo polinómico hipotético de años necesarios para volver a recuperar el carbono almacenado, similar a un de BTP en la Región Lacandona Chiapas México."}],"chart_footnote":[]}
V. DISCUSSION
The RTQ system did not record species during the first three years, which is why acahuales or recovering tropical forests (BTR) were sampled up to five years later. In BTR5 there is the presence of Trichospermum mexicanum, Heliocarpus donnellsmithii, Cecropia obtusifolia, Castilla elastica, Luehea speciosa, and Tabebuia rosea. These species are considered pioneers in disturbed ecosystems (Pennington and Sarukhán, 2005). The seeds of these species arrive through birds, and in the case of C. obtusifolia, C. elastica, L. speciosa, and Tabebuia rosea by bats and some rodents (Vázquez-Yanes et al., 1984), so seed dispersal for zoochory it is very important.
For birds to reach these sites, they require the presence of shrubs, and for this reason, they do not appear in the first three years when weak herbaceous plants are abundant. The dominance of fast-growing herbaceous plants does not allow the arrival of birds and therefore seeds of tree species, as reported by the owners of the plots studied. Pioneer species show accelerated growth in clearings where they can receive full sunlight and spread quickly over disturbed areas since they present early seed production (Pennington and Sarukhán, 2005; Turner, 2001).
It is important to note that in the first five years, species typical of high and medium evergreen forests were recorded, such as Astronium graveolens, Alseis yucatanensis, and Nectandra ambigens, as well as species considered climax (25% of the species) as Dialium guianense, Brosimum alicastrum and Lonchocarpus cruentus. The seeds of these species arrive through wind dispersal and the rest by birds, bats, and monkeys (Pennington and Sarukhán, 2005). A. graveolens is a threatened species included in NOM-059-SEMARNAT-2001). The germination of these species in these conditions is since they only require humidity, for example, for N. ambigens (Barajas-Guzmán and Álvarez-Sánchez, 2004) and B.
alicastrum (Vázquez-Yanes et al., 1984). Meanwhile, D. guianense requires passage through the digestive tract of birds for its germination (Vázquez-Yanes et al., 1984).
The above suggests that the initial presence of species with advanced stages of succession and even climax depends on dispersal syndromes, in the case of the RTQ system in the Lacandona region, it is due to zoochory.
The presence of pioneer species, species typical of the middle stratum of, and climax species of the BTP (22, 25, and 53% mean of the species, respectively). In the early stages of succession, they coincide with what has been recorded in other tropical forests. According to Whitmore (1998), when a clearing is opened, the seeds of pioneer and climax species arrive simultaneously for colonization after a disturbance, but the pioneer species dominate until they are progressively displaced by the climax species. In a study in Atewa, Ghana, it was found that colonization began with 90% pioneer species, but already 60% climax species were also present during the first year). The two groups grew together and progressively became enriched with the remaining 40% of the climax species and were subsequently dominant in the older evergreen tropical forests (Swaine and Hall, 1983). Something similar occurred in Barro Colorado, when the presence of climax and pioneer species occurred after the opening of a clearing, and they grew together during the first five years (Brokaw, 1987).
In BTR10, pioneer species decline and constitute only 25% of the species. The dominance of Trichospermum mexicanum is maintained and that of Zexmenia frutescens and Bursera simaruba increases, but Cecropia obtusifolia decreases. The arrival of Z. frutescens is by wind and zoochory (Standley, 1926). The increase in B. simaruba indicates that recruitment is continuous, and its growth occurs due to its greater ecological breadth (Vázquez-Yanes et al., 1984).
When the pioneer species develop and form a canopy, they allow a greater presence of shade-tolerant BTP species (33.33%) such as Nectandra ambigens, Astronium graveolens, Alseis yucatanenses, and Alchornea latifolia; advanced secondary vegetation species (16.66%) such as Spondias mombin and Schefflera morototonii and even climax species (25%) such as Aspidosperma megalocarpon, Swietenia macrophylla and Pithecellobium arboreum (Pennington and Sarukhán, 2005).
The arrival of seeds of S. mombin, S. morototonii, is attributed to the fact that its dispersal syndrome is carried out by birds (Vázquez-Yanes et al., 1984) and the dispersal of seeds of A. latifolia occurs by birds and bats because It requires the bird's gastric juices to germinate. In A. megalocarpon. S. macrophylla and P. arboreum dispersion is anemochorous (wind) (Pennington and Sarukhán, 2005; Vázquez-Yanes et al., 1984). The presence and greater abundance of these species are because they are adapted to more humid, protected, and fertile areas (Pennington and Sarukhán, 2005), therefore, they only occur under the canopy, and can potentially replace pioneer species.
In BTR20, pioneer species continue to constitute 25% of the total species. T. mexicanum, Bursera simaruba, Tabebuia rosea, Psidium guajava and Lysiloma acapulcensis (VIR 25.4, 2.4, 2.2, 1.8, 1.0, 0.3 and 0.3 respectively). Meanwhile, the middle stratum species Nectandra ambigens, Hampea nutricia, Chrysophillum mexicanum, and Blepharidium mexicanum among others registered a VIR of 7.1, 4.2, 4.2, and 0.3 respectively, but continued to increase their dominance and reach 40%.
Regarding the species of climax vegetation, for example, Vatairea lundelli, Acosmium panamense, and Terminalia amazonia mainly (VIR 2.1, 1.3, 1.2% respectively) constitute 32.14%. Finally, only Schefflera morototonii and Spondias mombin were recorded as characteristic species of advanced secondary vegetation (Pennington and Sarukhán, 2005).
The arrival of P. guajava, L. acapulcensis, Hampea nutricia, Chrysophillum mexicanum, and Blepharidium mexicanum is because they present a zoochory dispersal syndrome (Vázquez-Yanes et al., 1984; Ávila et al., 2005; Rodríguez-Velázquez et al., 2009) and the species Vatairea lundelli, Acosmium panamense and Terminalia amazonia present a dispersal syndrome due to anemocoria (Salazar and Soihet, 2001; Rodríguez Velázquez et al., 2009).
The increase in tree species of different sizes that represent a greater diversity of fruits also means a greater number of perching sites, which favors the arrival of new species of birds and therefore a greater dispersal of seeds, and this may explain why They find new species in more developed stages. In this regard, Bojorges-Baños and López-Mata (2006) found in the jungles of Veracruz that the abundance, diversity, and composition of bird communities are closely related to tree richness. Shankar-Raman et al. (1998) found that richness, diversity, and abundance increase as post-disturbance succession develops, similar to the slash-and-burn system in Indian tropical forests. The above helps to explain why the similarity of the 20-year-old acahual with BTP1 and BTP2 increases.
In BTP1, middle stratum species predominate and constitute 50% of the species. Metopium brownei, Chrysophillum mexicanum, and Nectandra ambigens stand out (VIR 12.6, 3.3, and 3.2, respectively), while the climax species constitute 23.52%, such as Terminalia amazonia, Dialium guianense and Vatairea lundelli the most characteristic, with VIR 18.8, 3.1 and 2.9, respectively. Spondias mombin has been frequently recorded in advanced secondary vegetation (Pennington and Sarukhán, 2005).
In BTP1, pioneer species are also present such as Trichospermum mexicanum and Psidium guajava, among others (VIR 4.4 and 2.9 respectively). It should be noted that the pioneer and climax species are present in the same proportion.
In BTP2 the VIR for Metopium brownei, Swietenia macrophylla, and Nectandra ambigens were 12.4, 4.4, and 3.4, respectively, which are species of the middle stratum (57.14%) and are dominant. The climax species constitute 25% (Dialium guianense, Terminalia amazonia, and Brosimum alicastrum, with VIR 13.4, 5.1 and 4.9 respectively). Schefflera morototoni and Spondias mombin are found as advanced secondary vegetation species (Pennington and Sarukhán 2005). The pioneer species that dominate are P. guajava, B. simaruba, and T. mexicanum with VIR 6.1, 4.5, 2.2, and 0.7%, respectively, and composed 14.28%.
Based on the above, we can infer that the process of repopulating the tropical forest affected by the RTQ system in the Lacandona region begins with the arrival of seeds, both of pioneer species and advanced stages, and even climaxes, through birds and bats (mainly up to three years old). This occurs since seeds dispersed by birds have a greater chance of reaching fields that are surrounded by remnants of jungle, in addition to the fact that their flight in open fields is conditioned by the presence of food sources and perches (Martínez-Ramos and García-Orth, 2007).
In this regard, Wunderle (1997) found that the greatest flight activity in birds was recorded between 1 and 80 m from the edges of the secondary forest towards the open field, and therefore the opening of small clearings during the RTQ system also allows be quickly colonized.
Based on the above, it can be said that pioneer tree species develop and tend to dominate in the first 10 years, and then form a canopy that offers new shelters and seed dispersal sites, mainly by ornithochory; either by species from the middle stratum, advanced secondary vegetation and climax. These species germinate due to the greater humidity offered by this new condition, which, combined with a lower intensity of light, allows their development. Subsequently, seeds of shade-tolerant species arrive, both from advanced secondary vegetation, middle stratum, and from climax species (mainly by zoochory), which grow and are favored by the opening of new clearings. In the Lacandona region, Chiapas, the set of species of advanced stages grows until it reaches the height of the canopy, and becomes dominant after 20 years, so the abundance of the pioneer species decreases, and the similarity of the tree composition with the evergreen tropical forest.
In general, the results obtained demonstrate that the management scheme of the traditional RTQ system, with 20-year cycles and openings of less than 1ha, does not alter the process of maintaining the richness of tree species. The richness found in the two BTP and BTR sampled was 71 species in 0.5 ha and is located within the average range of that recorded for the BTP.
In the Lacandona Forest, the number of tree species per hectare recorded by other authors is variable, for example, 160 (Meave, 1983), 79 (Levy-Tacher et al., 2006), and 31 (Ochoa-Gaona et al., 2007). In other tropical forests in Ecuador, between 44 species per hectare have been recorded (Wright, 2002) and up to 620 in Colombia (Giraldo, 2000).
BTR development and carbon sequestration.
Trees assimilate and store large amounts of carbon throughout their lives, mainly in the tree trunk and it's related to the diameter structure and tree density (Chave et al., 2005).
Tropical agricultural systems have the greatest potential for carbon (C) sequestration (Albrecht and Kandji, 2003). In the Lacandona region, acahuales or BTR are generated after the practice of slashing, slashing, and burning, which by increasing their age after the disturbance (5, 10, and 20 years), increases the density of stems and therefore stored carbon. Something similar to what was recorded by Huges et al. (1999), during the development of BTR that are within the intervals reported by (Albrecht and Kandji, 2003) which are between 12 to , and are greater than those recorded by Eaton and Lawrence (2009). For three-year secondary forests in Yucatán and twenty-four years . Williams et al. (2008) recorded values between 10.1 and for plots of more than 20 years of abandonment in Mozambique. However, in Lacandona, Chiapas, the high stored carbon content is attributed to the species richness and tree density.
In BTP 1 and BTP2, the amount of C stored was 478.73 and 512.53 Mg C ha , respectively, higher than that recorded by other authors. For example, in the forest plots in Mozambique recorded 4.3 to 33.4 Mg ha (Willimas et al., 2008). In a primary and secondary forest in Panama 251.7 Mg C ha (Chave, 2004). In the Amazon rainforest, with values from 335 Mg C ha (Kirby and Potvin, 2007); 144.5 Mg C ha (de Alencastro et al. 2005); to 145 to 232 Mg C ha (Houghton et al. 2000). Xiao-Tao et al. (2010) recorded 163 to 258 Mg C ha es in a seasonal tropical forest in China; Meanwhile, Glenday (2006) in East Africa obtained 330 ±65 Mg C ha . Finally, Eaton and Lawrence (2009), in a conserved forest in Yucatán 73.5 Mg C ha .
The higher carbon values obtained in the BTPs of the Lacandona region can be attributed to: i) Selva Lacandona can be more productive than other areas; ii) Other allometric equations are used in most of the works cited; iii) There may be a difference in the productivity of the BTP and the density of the wood of each species since although the BTP1 and BTP2 are contiguous, they have a difference of 30 Mg C ha ; iv) The age of the forests in conservation has not been specified, but some, such as Holz et al. (2009), consider a forest in conservation to be between 25 and 50 years old; vi) In this work, areas with large-diameter trees are selected. These are indicators of a mature state and can be used for the following purposes, and vii) BTPs affected by Mercury (Hg), such as those from Central and South America, tend to lose their fertility and productivity (Carvalho et al., 2019; Mainville et al., 2006).
The results indicate that the 20-year cycle of the RTQ system allows tree richness to be restored, but does not allow C to be stored at a rate similar to that of BTPs, which store eight times more. The above has strong implications because this type of agriculture is considered sustainable, but in this 20-year cycle, the amount of C stored in a mature evergreen tropical forest is not recovered. According to our estimates, it takes approximately 50 years for stored carbon to recover, 10 years than estimated by Chazdon et al. (2016) for tropical forests.
To reduce the recovery time of C storage in BTR, we consider as a possible strategy, leaving the trees alive at the ages of 10 to 20 years and then applying the RTQ system. Likewise, fast-growing and commercial pioneer species such as Bursera simaruba, a timber species, are planted, and the resin is used for incense and varnish (Toledo-Aceves et al., 2009). These species are propagating by cuttings (Vázquez-Yanes et al., 1984) and the use of similar species could imply rapid growth and C storage in less time.
VI. CONCLUSIONS
Based on the results of this study it can be concluded that:
-
The RTQ system traditionally applied by the Lacandon Maya, with periods of rest of 20 years, allows the recovery of the richness, diversity, and tree density of the Lacandon jungle.
-
The RTQ system practiced with 20-year rest periods does not allow the regeneration of the amount of C stored in tropical evergreen forests; this would be achieved with 50-year rest periods.
-
The development of the BTR and the regeneration of the tree cover is gradual and depends largely on the dispersal of seeds by fauna, particularly birds.
ACKNOWLEDGMENTS
This work was funded by the PAPIIT-IN 217308 project of the UNAM and the FES Zaragoza UNAM-Biology. We thank Mr. Pablo Chankin Njabor and his family for the support and facilities provided for the proper development of this research on his property. Janelle Sacnité Chávez-Barrera, Juan M. Castro-García, Sandra E. Aldana-Pérez, Jesús A. Lugo Aldana, Adriana Vallejo Fernández, Juan A. Poblano-Olivares, and Tania González-Vargas supported during the sampling and fieldwork.
ABSTRACT
We show that the Diophantine equation
admits matrix triple solutions from M3(N) and M6k(N), . We construct infinite universes made of these solutions. We introduce different construction structures sets of matrix solutions associated to the Diophantine equation (0.1). These construction structures sets of matrix solutions allow us to show that there exists an infinite number of multiverses (parallel universes) of the matrix solutions of the Diophantine equation (0.1) containing each a finite number of universes of matrix triples.
Classification: MSC Code: 11D09, 15A03, 11C20
Language: English
Conflict of Interest
The authors declare no conflict of interest.
Ethical Approval
Not applicable
Data Availability
The datasets used in this study are openly available at [repository link] and the source code is available on GitHub at [GitHub link].
Funding
This work did not receive any external funding.
References
Cite this article
Related Research



Special Issue
Launch a focused special issue to highlight research, emerging trends, and expert insights in your academic field.
