


IntelliPaper
Abstract
Current practice for assessing toe scour, requisite armor mass and wave overtopping of rock-armored coastal revetments is based empirically on flume study data. Flume data are normalised, which is done to synthesize large datasets to a notionally common scale, making equations dimensionless. Factors that normalize laboratory data for developing current predictive formulae for scour, requisite armor mass and overtopping discharges are based universally on wave height and gravitational acceleration. This article utilizes data from comprehensive scale model studies of various rock armored coastal revetments from which current-practice formulae have been derived, but normalizing the laboratory data using factors based on wave energy rather than wave height alone. This has resulted in predictions of toe scour, requisite armor mass and average overtopping discharges that are more accurate than those from formulae in current use. The influence of wave period is examined with wave period being incorporated into predictive equations, resulting in further improvements. Some model and scale effects are identified, recommending further research.
Explore Digital Article Text
I. INTRODUCTION
1.1 Background
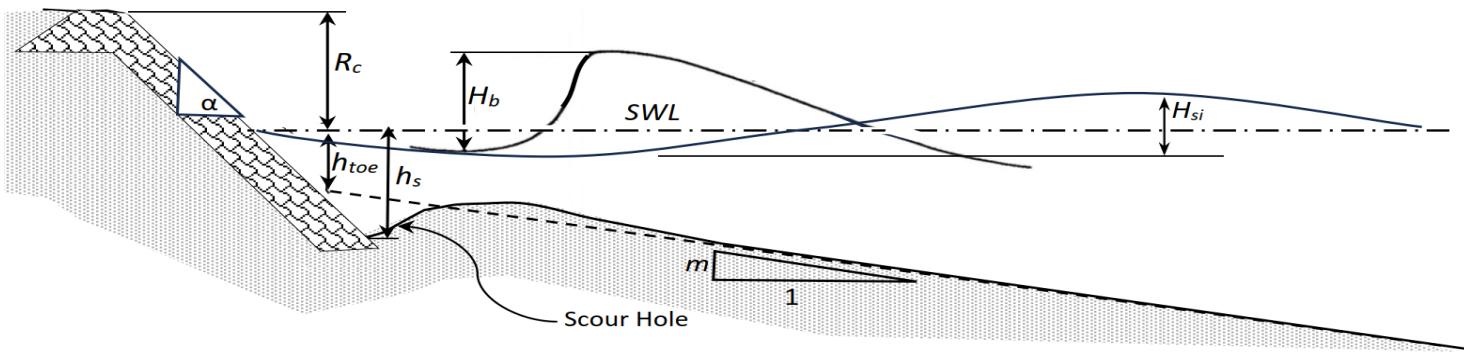
Coastal revetments are designed to protect shoreline assets from the natural processes of wave erosion and inundation. Generally, they are located in shallow nearshore waters, subjected to depth-limited breaking waves (Figure 1).
The breakers may be spilling, plunging or surging (Figure 2), depending upon the steepness of the incident breaking waves and the bed slope upon which they are shoaling and breaking, that is, the breaking wave surf similarity parameter (or breaking wave Iribarren Number), :
where is the tangent of the bed slope (-), is the breaking wave height (m) and is the deepwater wavelength (m), given by where g is gravitational acceleration and is the wave period (s). Spilling breakers occur when , plunging breakers when and surging breakers when .[2] On steep to flat slopes in shallow water around depth .3

Figure 1: Definition schema for depth-limited waves breaking onto a rock armored coastal revetment (distorted scale, SWL is still water level, is incident significant wave height).
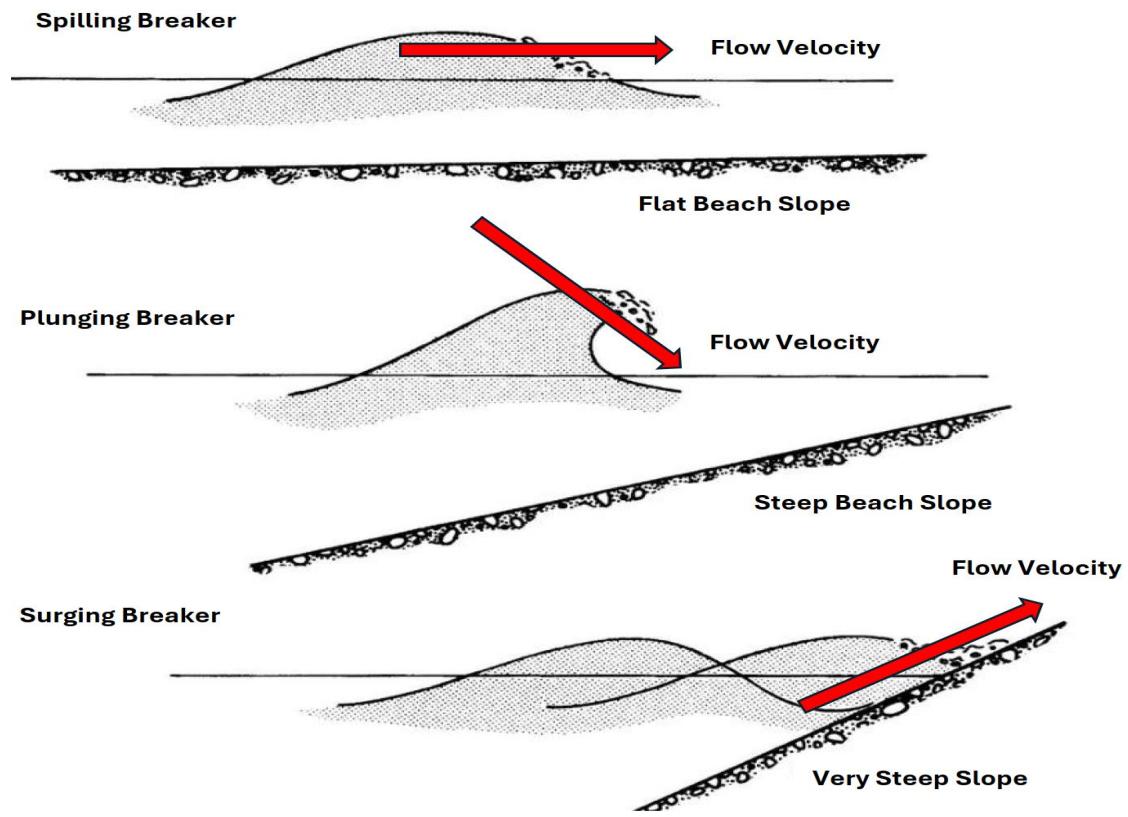
Figure 2: Types of breaking wavesmodified from [4] (Figure 27)
Hydrodynamic considerations for the design of rock armored coastal revetments include:
Seabed scour
Armour stability
Wave overtopping.
Further consideration may need to be given to the design methodology, with much current practice relying on scale modelling results.
These considerations deal with natural random processes that cannot be determined accurately. This drives conservatism in design, which may depend upon the appetite adopted for the level of risk, which will be informed by the available data, confidence in theoretical understanding, empirical evidence, and confidence in climate change predictions. Factors of safety are adopted, and empirical data are enveloped by design equations with acceptable levels of non-exceedance.
1.2 Seabed Toe Scour
The Coastal Engineering Manual (CEM) presents a simple "rule-of-thumb" that serves as an engineering guideline for sloping revetments under breaking waves, a conservative estimate being:1
where is the toe scour depth (m) below the still water level (SWL), is the maximum wave height sustainable in the water depth (m).
Assuming , data from movable bed model studies of toe scour at sloping revetments over a large range of scales are presented in Table 1 and Figure 3.[5-10]
Table 1: Scour data from movable bed flume model studies for sloping revetments[5]
| Researcher (Revetment slope V:H) | Test No. (-) | Hsi(m) | h_toe(m) | m(-) | Tp(s) | hs(m) |
| [10] Salauddin & Pearson (2019) (1V:2H) | 0.100 | 0.060 | 0.050 | 1.13 | 0.110 | |
| 0.100 | 0.075 | 0.050 | 1.13 | 0.113 | ||
| 0.100 | 0.100 | 0.050 | 1.13 | 0.134 | ||
| [9] Sutherland et al. (2006) (1V:2H) | 26 | 0.190 | 0.199 | 0.013 | 1.87 | 0.270 |
| 27 | 0.192 | 0.199 | 0.013 | 3.24 | 0.308 | |
| 28 | 0.194 | 0.199 | 0.013 | 1.55 | 0.274 | |
| 34 | 0.200 | 0.126 | 0.013 | 3.24 | 0.179 | |
| [8] Steetzel (1993) (1V:1.8H) | T1, H298-I | 1.500 | 0.816 | 0.027 | 5.40 | 1.500 |
| T2, H298-I | 1.500 | 0.816 | 0.027 | 5.40 | 1.500 | |
| [7] Van der Meer & Pilarczyk (1988) (1V:2H) | 1:7 scale | 0.860 | 1.238 | 0.033 | 6.40 | 2.000 |
| 1:35 scale | 0.170 | 0.247 | 0.033 | 2.90 | 0.380 | |
| [6] Steetzel (1985) (1V:1.8H) | T2, M2501-II | 0.253 | 0.121 | 0.027 | 3.10 | 0.239 |
| T3, M2501-II | 0.253 | 0.119 | 0.027 | 3.40 | 0.302 |
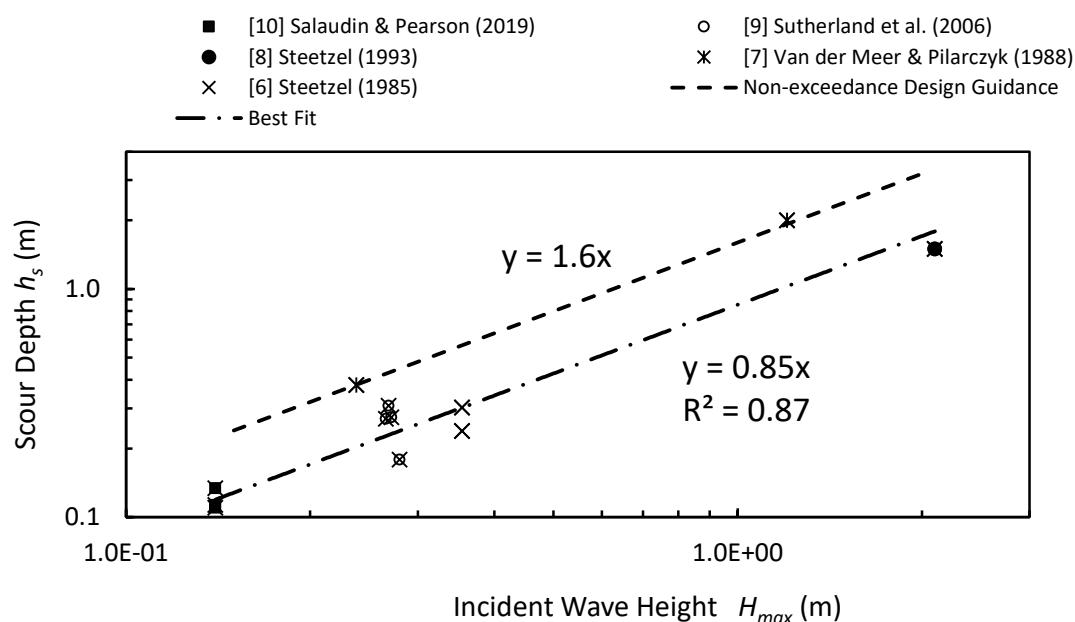
Figure 3: Scale model research results for toe scour depth versus maximum wave height at the toe for sloping revetments (1V:1.8 - 2.0H)
1.3 Requisite Armour Mass
Concept design formulae for revetment rock armor define the median requisite armor mass as a function of wave height, rock density, water density, and revetment slope following the passage of a number of waves. The formulae are in the form:
where is the median requisite stable armor mass (kg), is the armor density , is the incident significant wave height (m), is the relative submerged density of the armor to water , is the revetment armor slope and is a damage coefficient derived empirically.[11] Subsequent developments of this formula have included additional factors in the calibration coefficient for the extent of damage,[12,13] the number of waves and the porosity of the revetment core,[14,15,16] and wave period giving formulae variations for plunging and surging wave fronts.[16] For a two-layered rock armor on an impermeable core revetment, these formulae are compared in Table 2 where is damage (\%), ,[16] is the number of waves (-),[16] surf similarity parameter based on mean wave period (-).[16] The formulae are compared also for "no damage" ( , ) in Figure 4.
Table 2: Damage coefficients recommended by various researchers for application to the Hudson equation for standard rock armor placed pell-mell[11]
| Researcher Reference | n;KD | Remarks |
| [15] Van Gent (2004) | 1; 1 | 1000 waves |
| [12,13] Gordon (1972) | 1; 1.2D0.51 | 2000 Plunging breakers |
| [16] Van der Meer (1988) | 0; 79(S/√N)0.6εm-1.5 | N Plunging breakers |
| [16] Van der Meer (1988) | 1.5; 2.2(S/√N)0.6εm0.3 | N Surging breakers |
| [14,15] Van Gent et al. (2003) | 1; 5.4(S/√N)0.6 | N All breaker types |
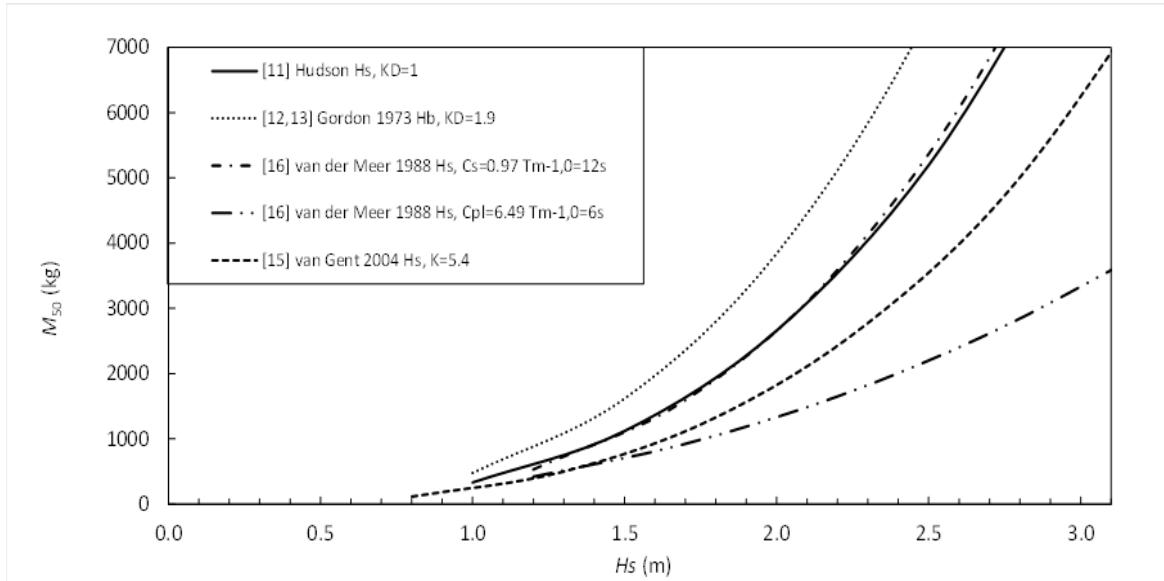
Figure 4: Current practice concept design formulae for sizing rock armor mass for no damage of a typical two-layered standard rock armored coastal revetment, impermeable core, , ,
1.4 Wave Overtopping
For various seawall and revetment configurations, the EurOtop 2018 Overtopping Manual[17] presents current practice for the relationships between measured discharges, ( ), normalized by the factor and the freeboards, ( ), normalized by the factor .[18] For mild rubble-mound structures, current practice uses Equation (4) for mean overtopping discharge:[17](Eqn5.10 p115):
where , , is the surf similarity parameter (-), with being the revetment slope, and , , and are influence factors that account for revetment berms, armor slope roughness, angle of wave incidence and a range of geometrical factors (respectively). Guidance for their quantification is given in the EurOtop 2018 Overtopping Manual.[17]
II. METHOD AND MATERIALS
2.1 Thesis
The energy of breaking waves is dissipated in various ways including the sound and shudder from wave breaking producing sea spray,[18] seabed scour,[5,8] rocking and moving of revetment armor,[19] wave runup and overtopping, gravity and infragravity wave reflection.[18]
Incident wave energy, , is a function of the product of wave height squared and wavelength thus:[20](p2-26, Eqn.2-38)
where is the unit mass of seawater , is gravitational acceleration , is the incident significant wave height (m), is the nearshore wavelength (m). In shallow water, the nearshore wavelength can be approximated by:[2],[20](p2-25 Eqn.2-37)
where is the nearshore depth at the revetment toe (m).
In the following, data from comprehensive scale model studies of rock armored coastal revetments are used to derive concept design formulae for seabed scour, stable rock armor mass and overtopping discharge by normalizing laboratory data with factors based on wave energy, rather than using current practice with factors based on wave height alone.
2.2 Scour
Equation (7) is a concept design formula for revetment toe scour, based on wave energy, which has been calibrated empirically with results from several moveable bed model studies covering a large range of scales (Table 1, Figure 5):
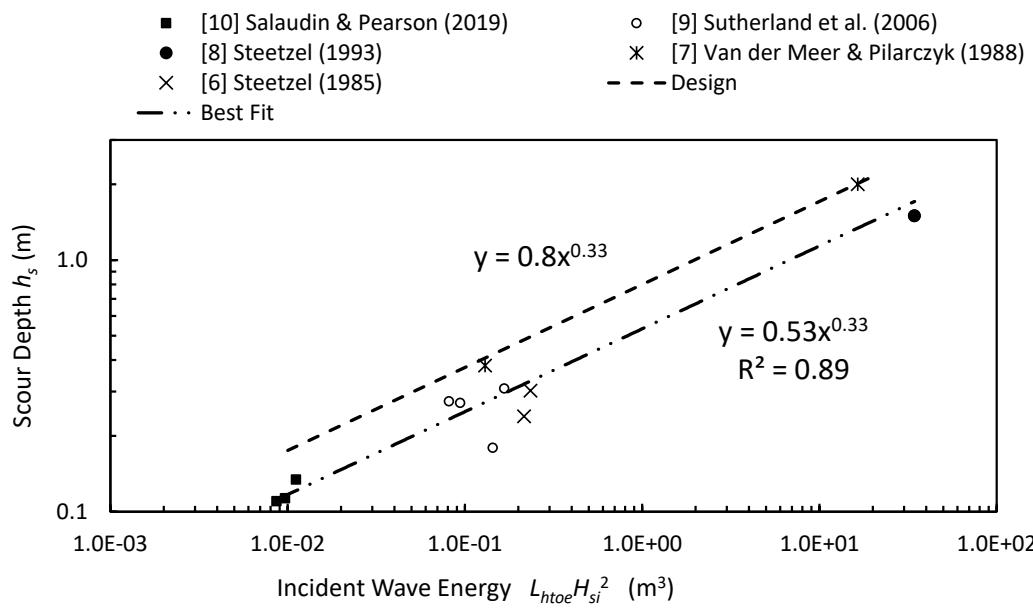
Figure 5: Scale model calibration of a toe scour formula for the design of 1V:2H sloping rock armored revetment
2.3 Armour Mass
It is the energy in breaking waves, that is, the breaking velocity of the fluid mass, that applies the disturbing forces of lift and drag to revetment armor that may cause it to rock and shift, and for rock armor placed pell-mell it is the mass of that armor under the restoring force of gravity that secures or otherwise its stability.[19] The wave energy method for rock armor stability was calibrated empirically with results from flume studies on rock-armored impermeable mounds under a range of random wave conditions (Table 3, Figure 6).
Table 3: Range of test conditions for data in Figure 6
| Data Source | Dn50(m) | Hs/h_{toe}(g) | T(s) | Damage(%) | m(-) | cota(-) | ξb(-) | Breaker type |
| [21] Thomson and Shuttler (1975) | 0.016 - 0.032 | 0.07 - 0.16 | Ts:1.0 - 1.3 | 15 | 0.000 | 2,3,4,6 | 1.2 - 3.0 | Plunging & surging |
| [16] van der Meer (1988) | 0.036, 0.210 | 0.06 - 0.32 | Tm:1.3 - 3.3 | 1 - 40 | 0.033 | 2,3,4,6 | 0.5 - 5.3 | Plunging & surging |
| [14] van Gent et al. (2003) | 0.026 | 0.42-0.59 | Tp:1.2 - 3.0 | 2 - 30 | 0.033 | 2,4 | 0.4 - 1.0 | Spilling & Plunging |
For the wave energy method under the breaking wave conditions in Table 3, the best fit relationship between armor mass (kg), level of damage (-), number of waves (-), revetment slope (-), relative density (-) where is armor mass , and wave energy is given in Equation (8):
with Equation (9), being a non-exceedance relationship, recommended for concept design:
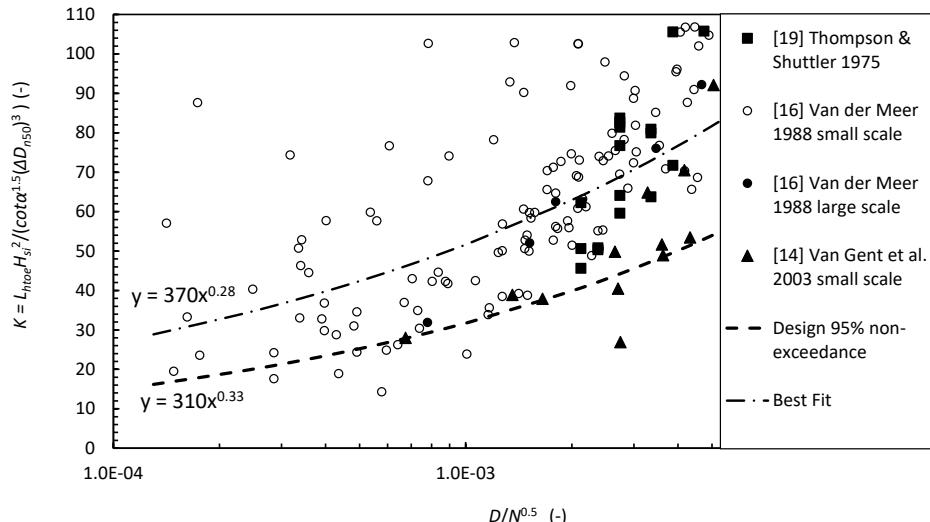
Figure 6: Wave energy damage coefficient versus damage by a number of waves for double layered standard rough angular rock armored revetments placed pell-mell over impermeable underlayers
2.4 Wave Overtopping
Scale model wave overtopping data comprised results from a comprehensive set of flume experiments undertaken at the US Army Engineer Waterways Experiment Station's Coastal Engineering Research Centre (CERC) to investigate the amelioration of flooding at Roughan's Point, Massachusetts.[22] The data was sourced from a 16:1 (prototype:model) scale model of a rock armored revetment (Figure 7) conducted in a by by long wave flume.
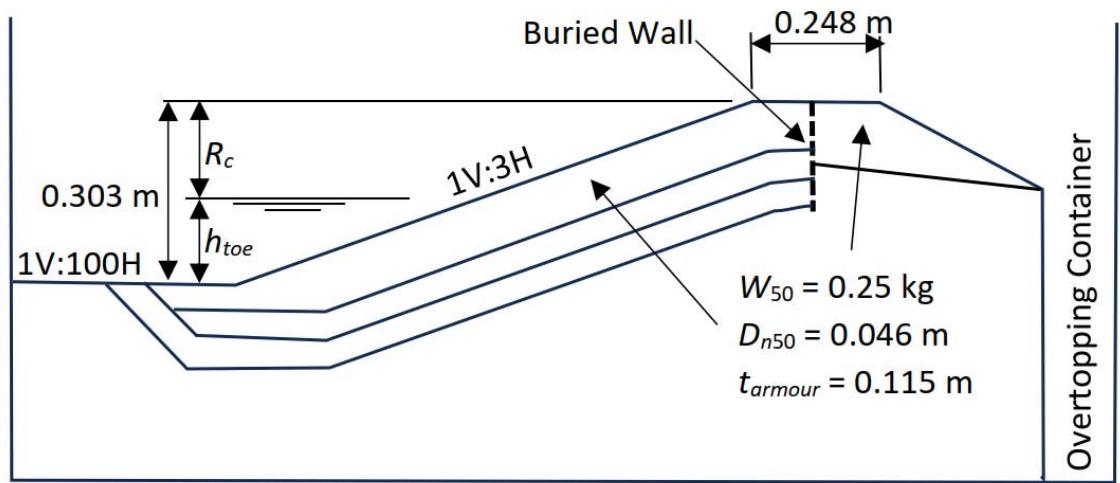
Figure 7: Revetment model schema[22]
A wide range of wave conditions was represented in these tests, with the incident significant wave heights measured at the revetment toe. During a single test run, irregular waves were generated continuously for 33 minutes, each test comprising some 1,000 waves. The wave paddle was programmed to produce a modified Joint North Sea Wave Program (JONSWAP) wave spectrum for the water depth at the wave generation blade, with waves shoaling and breaking on the seabed and spilling onto the revetment.[22] Overtopping rates were determined by measuring the change in water level in the overtopping container behind the model during a test run using point gauges.
The overall influence factor, , providing for the rock armor slope roughness, porosity and specific geometric properties of the revetment, was assessed by calibrating to Equation (4). The calibration achieved the best fit result with .[18]
Equation (4) was modified for wave energy normalizing factors in Equation (11):
The model data allowed for further calibration of the remaining factors and to wave period. For the wave energy factored equation, this was undertaken for each wave period dataset by varying and to optimise scatter and accuracy, which allowed derivation of relationships for the factors and to the modelled wave periods.[18] This allowed the derivation of Equation (12), which incorporates wave period at prototype scale, the values for and having been determined at model scale (prototype:model) according to Froude scaling.[18]
III. DISCUSSION
3.1 Toe Scour
The scale model data do not support current practice, being the "rule-of-thumb" that the toe scour depth is the maximum wave height that can be sustained in the water depth (Figure 8). Large and small scale (1:7, 1:35) modelling undertaken at Delft Hydraulics has indicated that the maximum scour depth can exceed the maximum sustainable wave height by a factor of around 1.6, [5,7] which is shown to have occurred at a relative toe depth , as predicted.[23] Hence, Equation (7) is recommended for concept design for revetment toe scour.
[10] Salaudin & Pearson (2019) [9] Sutherland et al. (2006)
[8] Steetzel (1993) [7] Van der Meer & Pilarczyk (1988)
[6] Steetzel (1985) [1] USACE (2006) "rule-of-thumb"
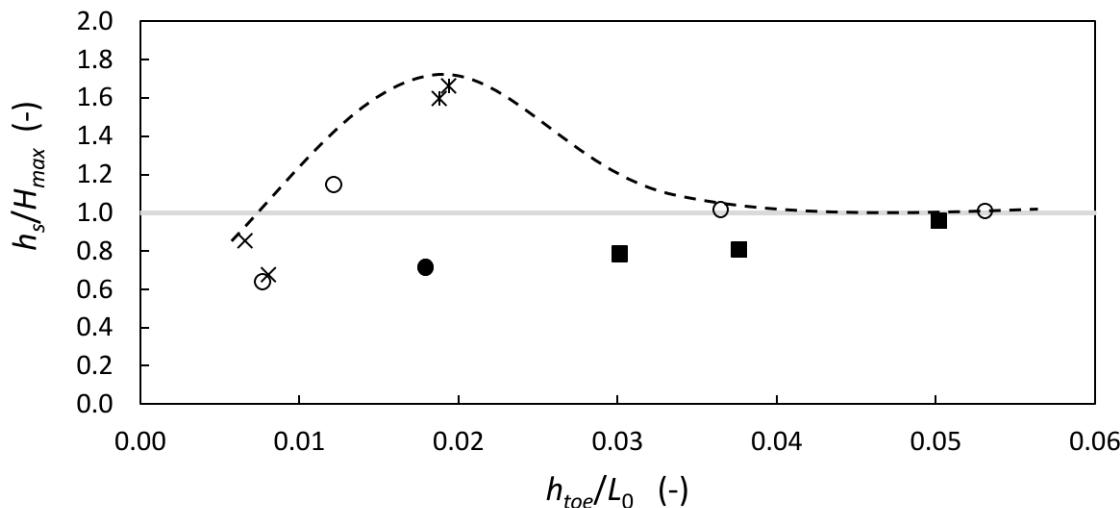
Figure 8: Ratio of maximum measured scour depth to maximum wave height versus relative toe depth for physical scale modelled sloping revetments (Table 1)
3.2 Armour Mass
The proposed wave energy formula for requisite rock armor mass, Equation (9), is compared with commonly used rock armor sizing formulae in Figure 9.[11-13,15,16] For a wide range of wave periods, it compares well with the equations of van der Meer[16] up to a significant wave height of around , beyond which it gives smaller mass for longer periods and larger mass for shorter periods. The formula cannot be compared meaningfully with those of Hudson,[11] Gordon[12,13] or van Gent[15] as those formulae do not include wave period.
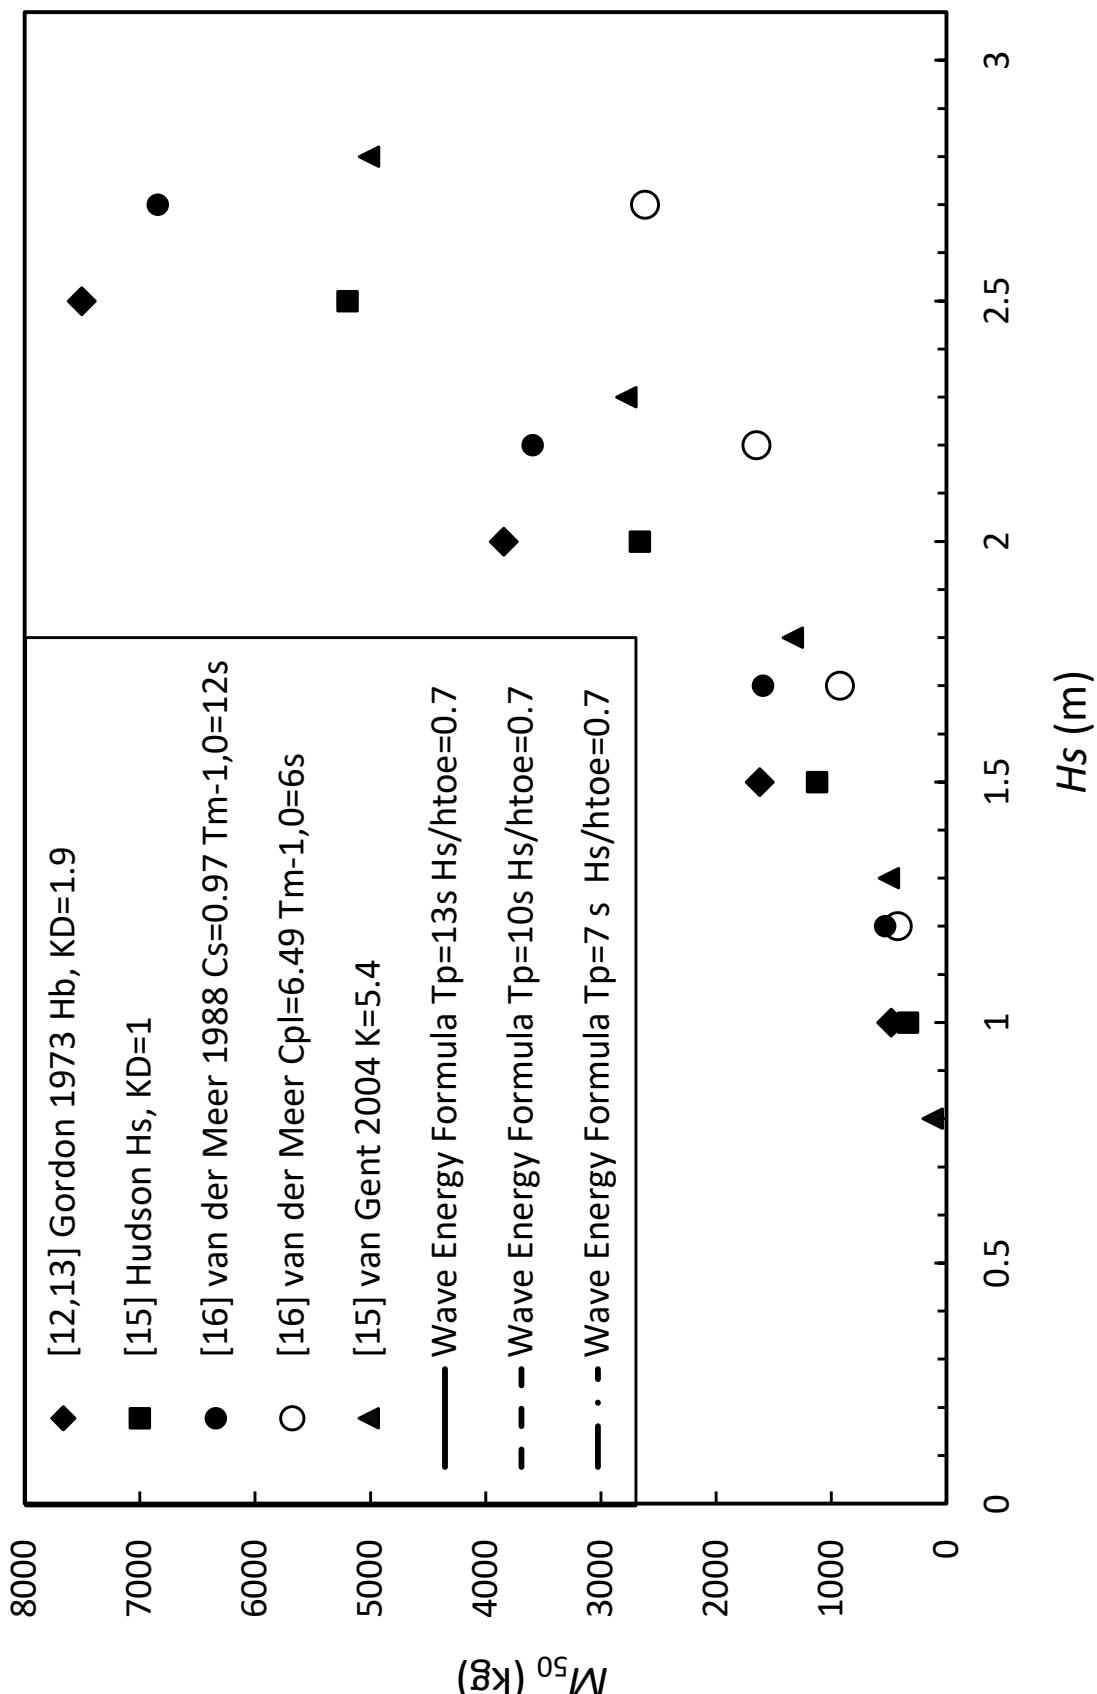
Figure 9: Comparison of commonly used rock armor sizing formulae with the proposed wave energy formula for , . Assumed: ; ; ; .
The coherence of the flume data normalised with wave height alone and with wave energy is compared in Figure 10. The data normalised with wave height gives values over a spread of two orders of magnitude, whereas that normalised with wave energy has a spread of one order of magnitude. This is reflected in the Coefficient of Determination, which is higher for the data normalised with wave energy.
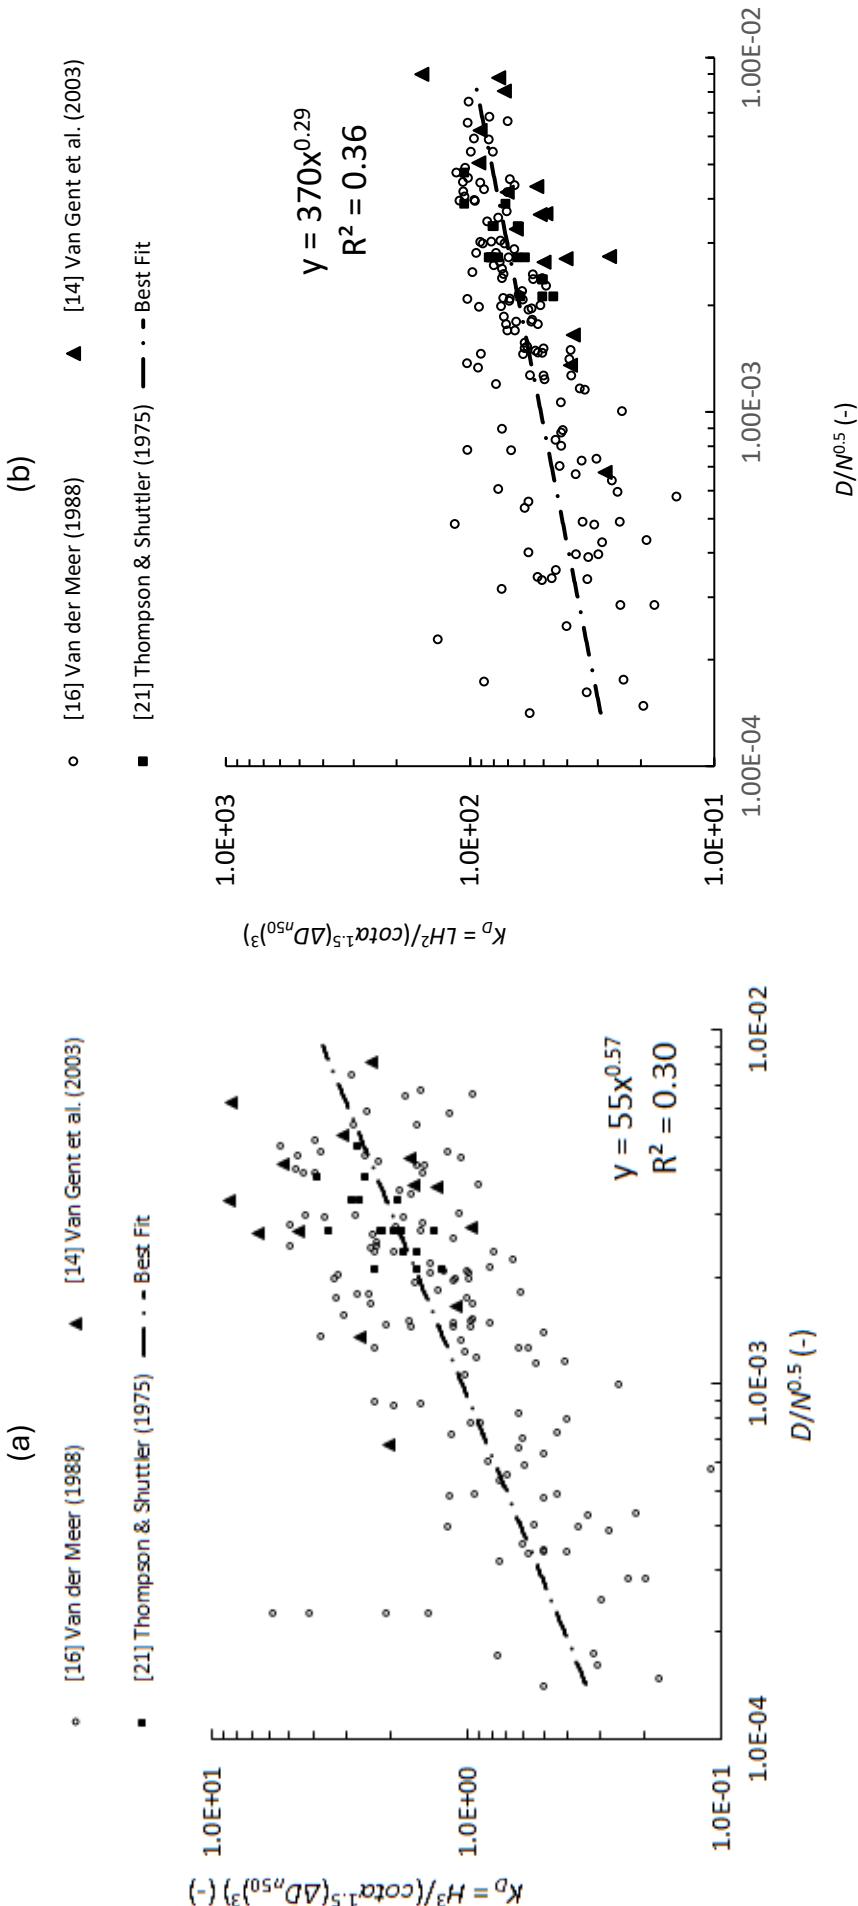
Figure 10: Coherence of flume data normalised with (a) wave height and (b) wave energy
3.3 Overtopping Discharge
The revetment model data versus the prediction equations normalised with wave height factors and wave energy factors are compared in Figure 11(a) and Figure 11(b) respectively. The prediction equation based on data normalised with wave energy factors is more coherent, with a coefficient of determination of 0.87 compared with 0.76 for the prediction equation based on data normalised with wave height alone.[18] Further, however, the data based on wave energy normalization show a clear trend with wave period, which is not unexpected and which is not apparent with the data normalised using wave height alone.
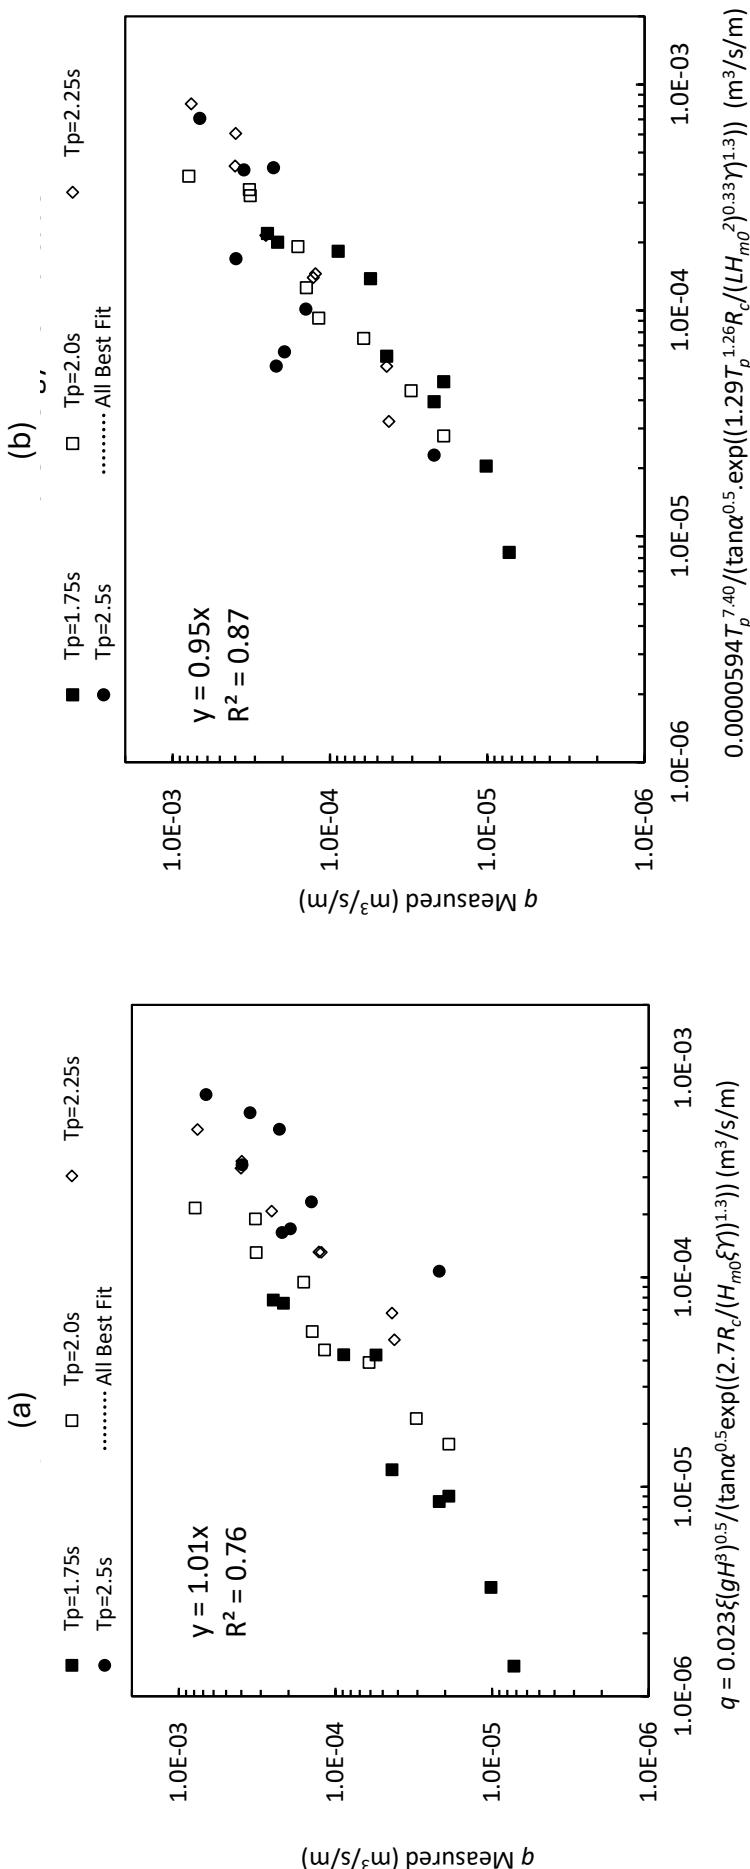
Figure 11: Revetment model data for measured versus predicted discharges with calibrated equations normalised with (a) wave height factors and (b) wave energy factors including calibration to wave period
The predictions using the equation based on wave energy normalization including wave period are more accurate than those using the equation developed from wave height normalization (Figure 12).[18]
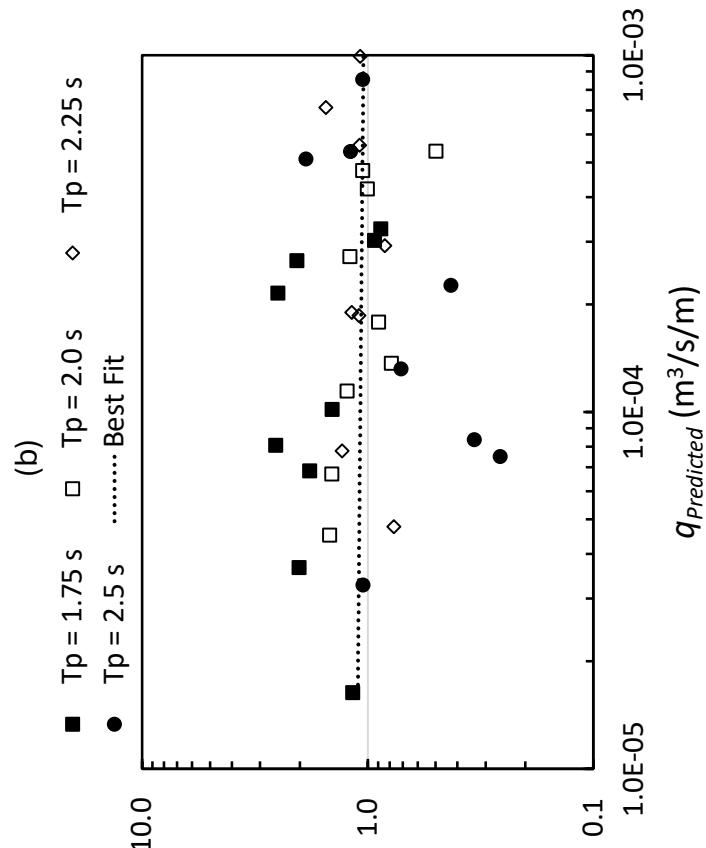
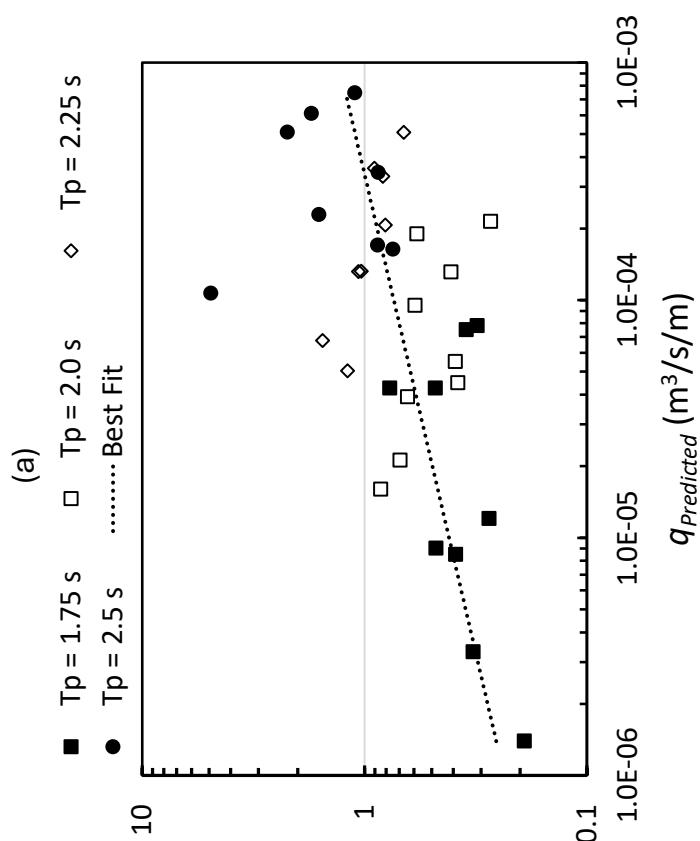
Figure 12: Comparison of predictions with measured revetment model data for (a) the current practice equation normalised with wave height factors and (b) the proposed equation normalised with wave energy factors and calibrated to wave period
3.4 Design Methodology
Results from physical scale modelling may not represent prototype behavior correctly because of experimental model effects and/or scale effects.[18] Depending on the scale applied for concept design, prototype conditions could lay beyond some of the limits of the modelling parameters used for concept design formulae. Extrapolating model results should consider experimental constraints including:
- The fronting seabed slope affects wave shoaling and breaking. Seabed slopes of the scour tests varied widely from . However, for armor mass only one bed slope, , was modelled, as was the case for overtopping with .
- Revetment slopes varied little for scour with , for armor mass but for overtopping considered herein .
- Model wave periods varied from 1 s to 3 s. This would limit a 9:1 Froude scale model to schematise prototype wave periods from 3 s to 9 s [18]. For a smaller scale model of 50:1, say, the prototype periods schematised by the modelling would range from 7 s to [18]. Scaling up to prototype dimensions using equations developed from scale modelling may include test results that have schematised unrealistic prototype wave periods.[18]
- Much of the data used to develop concept design formulae is based on around 1,000 zero-crossing waves. Revetments in depth-limited situations are likely to be subjected to a much larger number of waves, in which case average overtopping discharges and requisite armor mass may be underestimated.[18,19]
- Results of two-dimensional flume studies do not replicate any three-dimensional processes that occur in the nearshore surf zone fronting revetments.[5,18,19]
Site-specific scale modelling is recommended for the detailed design of coastal revetments. Apart from experimental constraints, Reynolds number scale effects are possible.[18,19] The drag coefficient for spheres increases for but decreases for $\mathrm{Re} > 2 \times 10^{5}.[24] Should that apply to rock armor, then if the model data are applied at normal scales for prototype concept design, for the likely prototype ranges of Reynolds number the drag force coefficient of the flow on rock armor would be relatively lower in the prototype than that in the model, leading to conservative estimates for requisite armor mass,[19],21 but non-conservative estimates for runup and overtopping.[18]
IV. CONCLUSIONS
Formulae for the concept design of coastal revetments located in shallow water have been presented that relate toe scour, the requisite stable mass of armor rock and overtopping discharges to the energy of the incident breaking waves. These formulae include parameters for significant wave height, wave period, toe depth, degree of armor damage, the number of waves, revetment slope, armor and water densities, and revetment crest freeboard. The formulae have been calibrated using flume data generated by research at university and government hydraulic laboratories in the UK, USA and the Netherlands. The formulae are compared with current practice and show more coherence with the available flume data. Scale effects have been considered, with requisite armor mass likely to be over-estimated and average overtopping under-estimated. This research would benefit from more laboratory data, which is recommended particularly to investigate the impacts of seabed slope, wave period and Reynolds number scale effects.
Funding: This research has been self-funded by the author.
Data Availability Statement: All data, models and code generated or used during the study appear in the submitted article and are available as referenced.
Conflicts of Interest: The author declares no conflicts of interest. The author was employed by the company Worley Consulting. The author declares that the research was conducted in the absence of any commercial or financial relationships that could be construed as a potential conflict of interest.
Conflict of Interest
The authors declare no conflict of interest.
Ethical Approval
Not applicable
Data Availability
The datasets used in this study are openly available at [repository link] and the source code is available on GitHub at [GitHub link].
Funding
This work did not receive any external funding.
Cite this article
Related Research


Special Issue
Launch a focused special issue to highlight research, emerging trends, and expert insights in your academic field.
