




IntelliPaper
Abstract
Paramos are an important mountain ecosystem; they are essential water supplier to Andean population. Understanding its hydrological function is fundamental to preserve it, manage and to implement conservation programs. Little is known about the effect of paramos’ vegetation upon the water fluxes. Evapotranspiration (EVT) is the main water output in this ecosystem and the most complex to measure. Using an ecosystem approach was estimated EVT through the net daily variation of soil water content (SWC) and was abstracted information about the other fluxes. The aim was assessing the effect of different plant life forms upon SWC and ETV. Therefore, TDR sensors were installed in the first 10cm into soils beneath different sort of covers (rossette, shrub and bare soil) and they were set up 10minute register, from March 2012 to November 2013. The shrub kept a SWC mean 36% higher than the rosette and like bare soils (bs). In the dry season, the rosette hold a SWC close to bs, but its SWCs were more stable, despite the rain decrease and its fluctuation. In bs the soil water discharge was two times faster than under plant covers. In the driest period, the shrub maintained 120% much water and the rosette a half extra than bs. Below the shrub and bs the drainage had high likely. The runoff was not detected in any cover condition. The EVT was reduced a half by plants in the dry season, being the shrub effect more markable.
Explore Digital Article Text
I. INTRODUCTION
Andean paramo is a high mountain ecosystem located in north Peru, Ecuador, Colombia and Venezuela, between 2800 m and 4800 m altitude, above the upper limit of forests and under the glacier limit (Cuesta & Becerra, 2009; Monasterio, 1980). Its location in high altitude and the tropics define its weather, dominate by a high solar radiation input (Rodríguez-Morales et al., 2019; Padron et al., 2015), a low-temperature mean 6°C with a wider daily oscillation (between 17°C and -3 °C) than the annual temperature fluctuations (Rodriguez-Morales, 2010). Its rainfall is very low-intensity and high frequency, mainly drizzle (Padron et al., 2015; Rodríguez-Morales et al., 2014) with a markable seasonal pattern, with a wet and a dry season (Sarmiento, 2000). The paramos vegetation is characterized by a high biodiversity and elevated endemism with open canopy dominated by rosettes and shrubs (Llambi et al., 2014.
Paramos are an essential ecosystem to the Andean population because they are water suppliers (Carrillo-Rojas et al., 2016; Monasterio et al., 2006). The Andean inhabitants and their productive activities, such as agriculture, livestock, and hydro electrical supply, depend directly on this ecosystem (Smith et al., 2011; De Bievre et al., 2006; Hofstede, 1995). Its weather, soils and vegetation determine its hydrological function; they favor the water storage in the wet season and release it in the dry season, regulating and maintaining permanent streamflow (Rodríguez-Morales et al., 2019; Naranjo & Duque, 2004), being this one of its leading environmental services.
In this crucial role, the paramos' vegetation undoubtedly has a significant effect on its hydrological process because plants modify almost all the water fluxes at the ecosystem scale (Pacheco & Ataroff, 2005; Sarmiento, 2000; Belmore & Romero, 1999). Paramos' plants have morphological and physiological adaptations to avoid water deficit stress (Rada et al., 2019). For example, Espeletia schultzii, a dominant caulescent rosette, has stomatal control during the dry season (Sandoval et al., 2019); also, its leaves are covered by a dense pubescent, which reduces the gas chance, including water vapor, and it has a medulla to store water. While Hypericum laricifolium, a dominant sclerophyllous shrub, has tiny leaves with a leather texture (Rada, 1993). All these mechanisms lessen the transpiration flux. In Addition, vegetation protects the dark soil of Paramo against high solar radiation, providing shade (Sarmiento, 2000), reducing the evaporation rate (Rodriguez-Morales, 2010), and contributing organic matter (Nierop et al., 2007), which favors water soil storage.
This research aimed to deepen the understanding of paramos plants' effects on the hydrological process by assessing the impact of two dominant plant growth-forms, rosettas and shrubs, Espeletia schultzii and Hypericum laricifolium, upon the water fluxes, emphasizing soil water content and evapotranspiration.
Despite the importance of paramos and its vegetation, anthropic activities such as agriculture, grazing, timber harvest, climate change, and global warming have been changing its structure and function. In this context, agriculture is expanding its frontier over paramos, transforming and replacing its vegetation (Sarmiento, 2000); livestock harms the plant structure by stepping or consuming; the local population extract shrubs and timber for firewood, reducing its biomass and cover. Therefore, there needs to be more information about the role of plants over the paramos' function to generate base information to justify its conservation, support decisions and its sustainable management (Ochoa-Tocachi et al., 2018; Acevedo et al., 2006; Buytaert et al., 2011)..
Additionally, global warming and climate change impact the water function of paramos through the increase of its temperature mean (Anderson et al., 2012; Buytaert et al., 2011), so there is more energy available for the evapotranspiration process, more extended drought periods are warning (Buytaert et al., 20006b), and likely an increase in rain intensity favors the surface fluxes, soil erosion and the restock of water reservoirs will likely be affected, decreasing the water offer (Giorgi & Bi, 2005). Plants could be significant in regulating the evapotranspiration outlet (Ochoa-Sanchez et al., 2020) and other hydrological fluxes, maintaining the water supply service. Also, knowledge about the repercussions of plant growth-forms on hydrology is insight to improve evapotranspiration estimates (Callañaupa et al., 2021) and perform hydrological models, adjusting parameters related to cover and explain part of its uncertainty to research the future scenarios and design strategies to adapt and mitigated to their effects.
1.1 Evapotranspiration
Evapotranspiration (EVT) is one of the main fluxes in water balance; it is the principal water output of mountain ecosystems (Li et al., 2024; Diaz, 2009; De Brieve et al., 2006; Buytaert, 2006c). In the Venezuelan paramos, EVT is more than 60% of the rain inputs (Rodriguez-Morales et al., 2019; Sarmiento, 2000), while in Ecuador, this flux is around 50% (Carrillo-Rojas et al., 2016). Due to EVT being a crucial flux in the water balance of paramos and highly modified by plants, the assessment of vegetation is necessary to understand the hydrological function of this ecosystem.
This water flux is the most complex to measure or to estimate (Carrillo-Rojas et al., 2016) because it is affected by many variables such as the plants' ecophysiology and morphology, edaphic properties, and environmental conditions (Callañaupa et al., 2021; FAO, 1990). There are many methods to estimate or measure EVT. However, for the aims of this research, few of these methods are suitable for evaluating species separated. One of those is lysimeters, the most direct method, but it is methodologically complicated and inaccurate (Ochoa-Sanchez et al., 2019). EVT equations such as Adjusted Evapotranspiration (FAO, 1990) could be helpful but demand knowing a vast number of variables, whose measuring requires specialized devices, specifically for the ecophysiological variables. When there are no measurements of these variables, theoretical coefficients reported in the bibliography are used, expecting they represent the condition in the study area; it incorporates high incertitude.
This research introduces a straightforward method for estimating ETV using an ecosystem approach. This method was developed using the following scientific principles.
1.2 Ecosystem approach
According to Acevedo and Sarmiento (1990), at ecosystem scale, water budget is calculated through the equation 1
Where, total precipitation (Tt Pp) is the ecosystem water input. The vegetation canopy catches a portion of this; it is foliar interception (F Int); leaves and stems hold this water, and then it is evaporated; this water does not get to the soil surface; it represents an ecosystem water outlet. The water quantity intercepted by vegetation depends on the Leaf Area Index (ratio of leaf area to ground area), cover, and structure. A stratified canopy has a higher foliar interception than a simple and opened one. Additionally, the magnitude, intensity and frequency of rains affect the foliar interception (Ocho-Sanchez et al., 2018) because when the rain magnitude overcomes the water canopy saturation, foliar interception stops. A high rain intensity beats the canopy resistance, minimizing this flux, and the rain frequency determines how much water there is in the canopy and how far it is to get the saturation. For example, A high frequency decreases the F Int because the canopy reaches saturation easily. At the same time, low frequency allows canopy evaporation and the canopy water content goes down, keeping the canopy empty to catch the next rain. When the canopy gets saturated the water starts to drop. The water that reaches the soil turns into two fluxes: infiltration (Inf) or surface runoff (R). Infiltration is the water that gets into the soil, and due to it being a transferred flux, it is not included in the equation. In contrast, R represents an ecosystem egress. This last flux happens under two conditions: when the soil saturation point is surpassed or when the rain intensity is higher than the infiltration rate (Hortonian surface runoff).
Into the soil matrix, if the soil water content reaches the Field Capacity (FC), drainage (D) happens; it is the gravimetric water that goes out to the soil and contributes to the subsurface fluxes, restocking aquifers and the stream. The water is stored (S) if the FC does not rise. Then, this water is evaporated (EV) or transpired (T) by plants. These two fluxes are integrated by evapotranspiration (EVT), another outlet. Evapotranspiration is affected by environmental conditions, air temperature, solar radiation, wind speed, relative humidity, soil water content, leaf area index, cover and plant height, among others.
At the same time, foliar interception could be expressed such us
Where Ef Pp is the effective precipitation that drops from the canopy after it reaches saturation; additionally, rain directly falls over the soil surface where there is no plant cover. Sf is the stemflow, which is water running down on plants to the soil.
Therefore, another way to describe the water budget is
Focusing on storage, soil water content variation ( ) depends on every water flux rate and their integration. could be positive when, during a period, the input fluxes are higher than the output ones, and the soil gets wetter, or is negative when water outputs overcome inputs and soil has lower water content than in the beginning.
At this scale, almost all of the water fluxes are directly impacted by plants; for example, Ef Pp and EVT depend on the percentage of cover. Additionally, the canopy shape, leaf area index, vegetation height, phenology, and plant life form affect the F Int and Sf. Similarly, T is customized by the growth-form and other morphological and physiological characteristics such as root deep, stomatic control, and medulla. Surface runoff is reduced by cover, and infiltration usually is favored by it. Indirectly, vegetation produces litter, which turns into soil organic matter, increasing the water storage capacity of soils and decreasing the drainage rate.
1.2 Evapotranspiration estimation
This research uses the ecosystem approach to estimate evapotranspiration, following equation 4 and based on two assumptions: Firstly, considering soil water content (SWC) at a specific time is the integration of all the water fluxes. Secondly, every flux gets value cero except evapotranspiration during no rain days. As a result, during days without precipitation, the is equivalent to the evapotranspiration rate. It is straightforward method to calculate EVT, but it does have a limitation- it cannot be used during rainy days, particularly in the wet season.
On the other hand, when the water soil content is measured simultaneously under contrasting plant growth-forms and in bare soil in the same environmental conditions, the differences of SWC, EVT and other water fluxes represent the vegetation effect on hydrological fluxes.
Aims
Analyze the effect of two dominant growth-forms on soil water storage, evapotranspiration rates and other water fluxes, by comparing measures of TDR sensors, installed in soils below a rosette (Espeletia schultzii), a shrub (Hypericum laricifolium) and bare soils in a Venezuelan paramo.
Methods
Study area location
The study area was the Paramo of Mixteque. It is located on the microwatershed of Miguaguo, 8°44′N and 70°53′W, at 3,850 m altitude; it is part of the upper basin of the Chama River, contributing to the
Maracaibo Lake. The paramo of Mixteque is protected in the Sierra Nevada National Park in Merida-Venezuela. However, the local communities use it as a grazing area, to develop tourist activities, to gather woodfires, and depend directly on the water that this paramo supplies for irrigation and consumption (Smith et al., 2011).
Climate
The rain is 1,020 mm annually, distributed in a seasonal pattern with a dry and a wet season. The dry season is from December to March, with very scarce rains, while the wet season is between April and November (Rodriguez-Morales, et al. 2019, Rodriguez-Morales, et al. 2014). The rain characterizes drizzle, very low intensity and high frequency (Rodriguez-Morales, 2010). The annual temperature mean is 6.1°C. Solar radiation is significantly elevated, especially when there are no clouds during the dry season, getting 1,277 W m-2 seg-1, (Rodriguez-Morales, 2010) the highest value that can reach the Earth's surface.
Vegetation
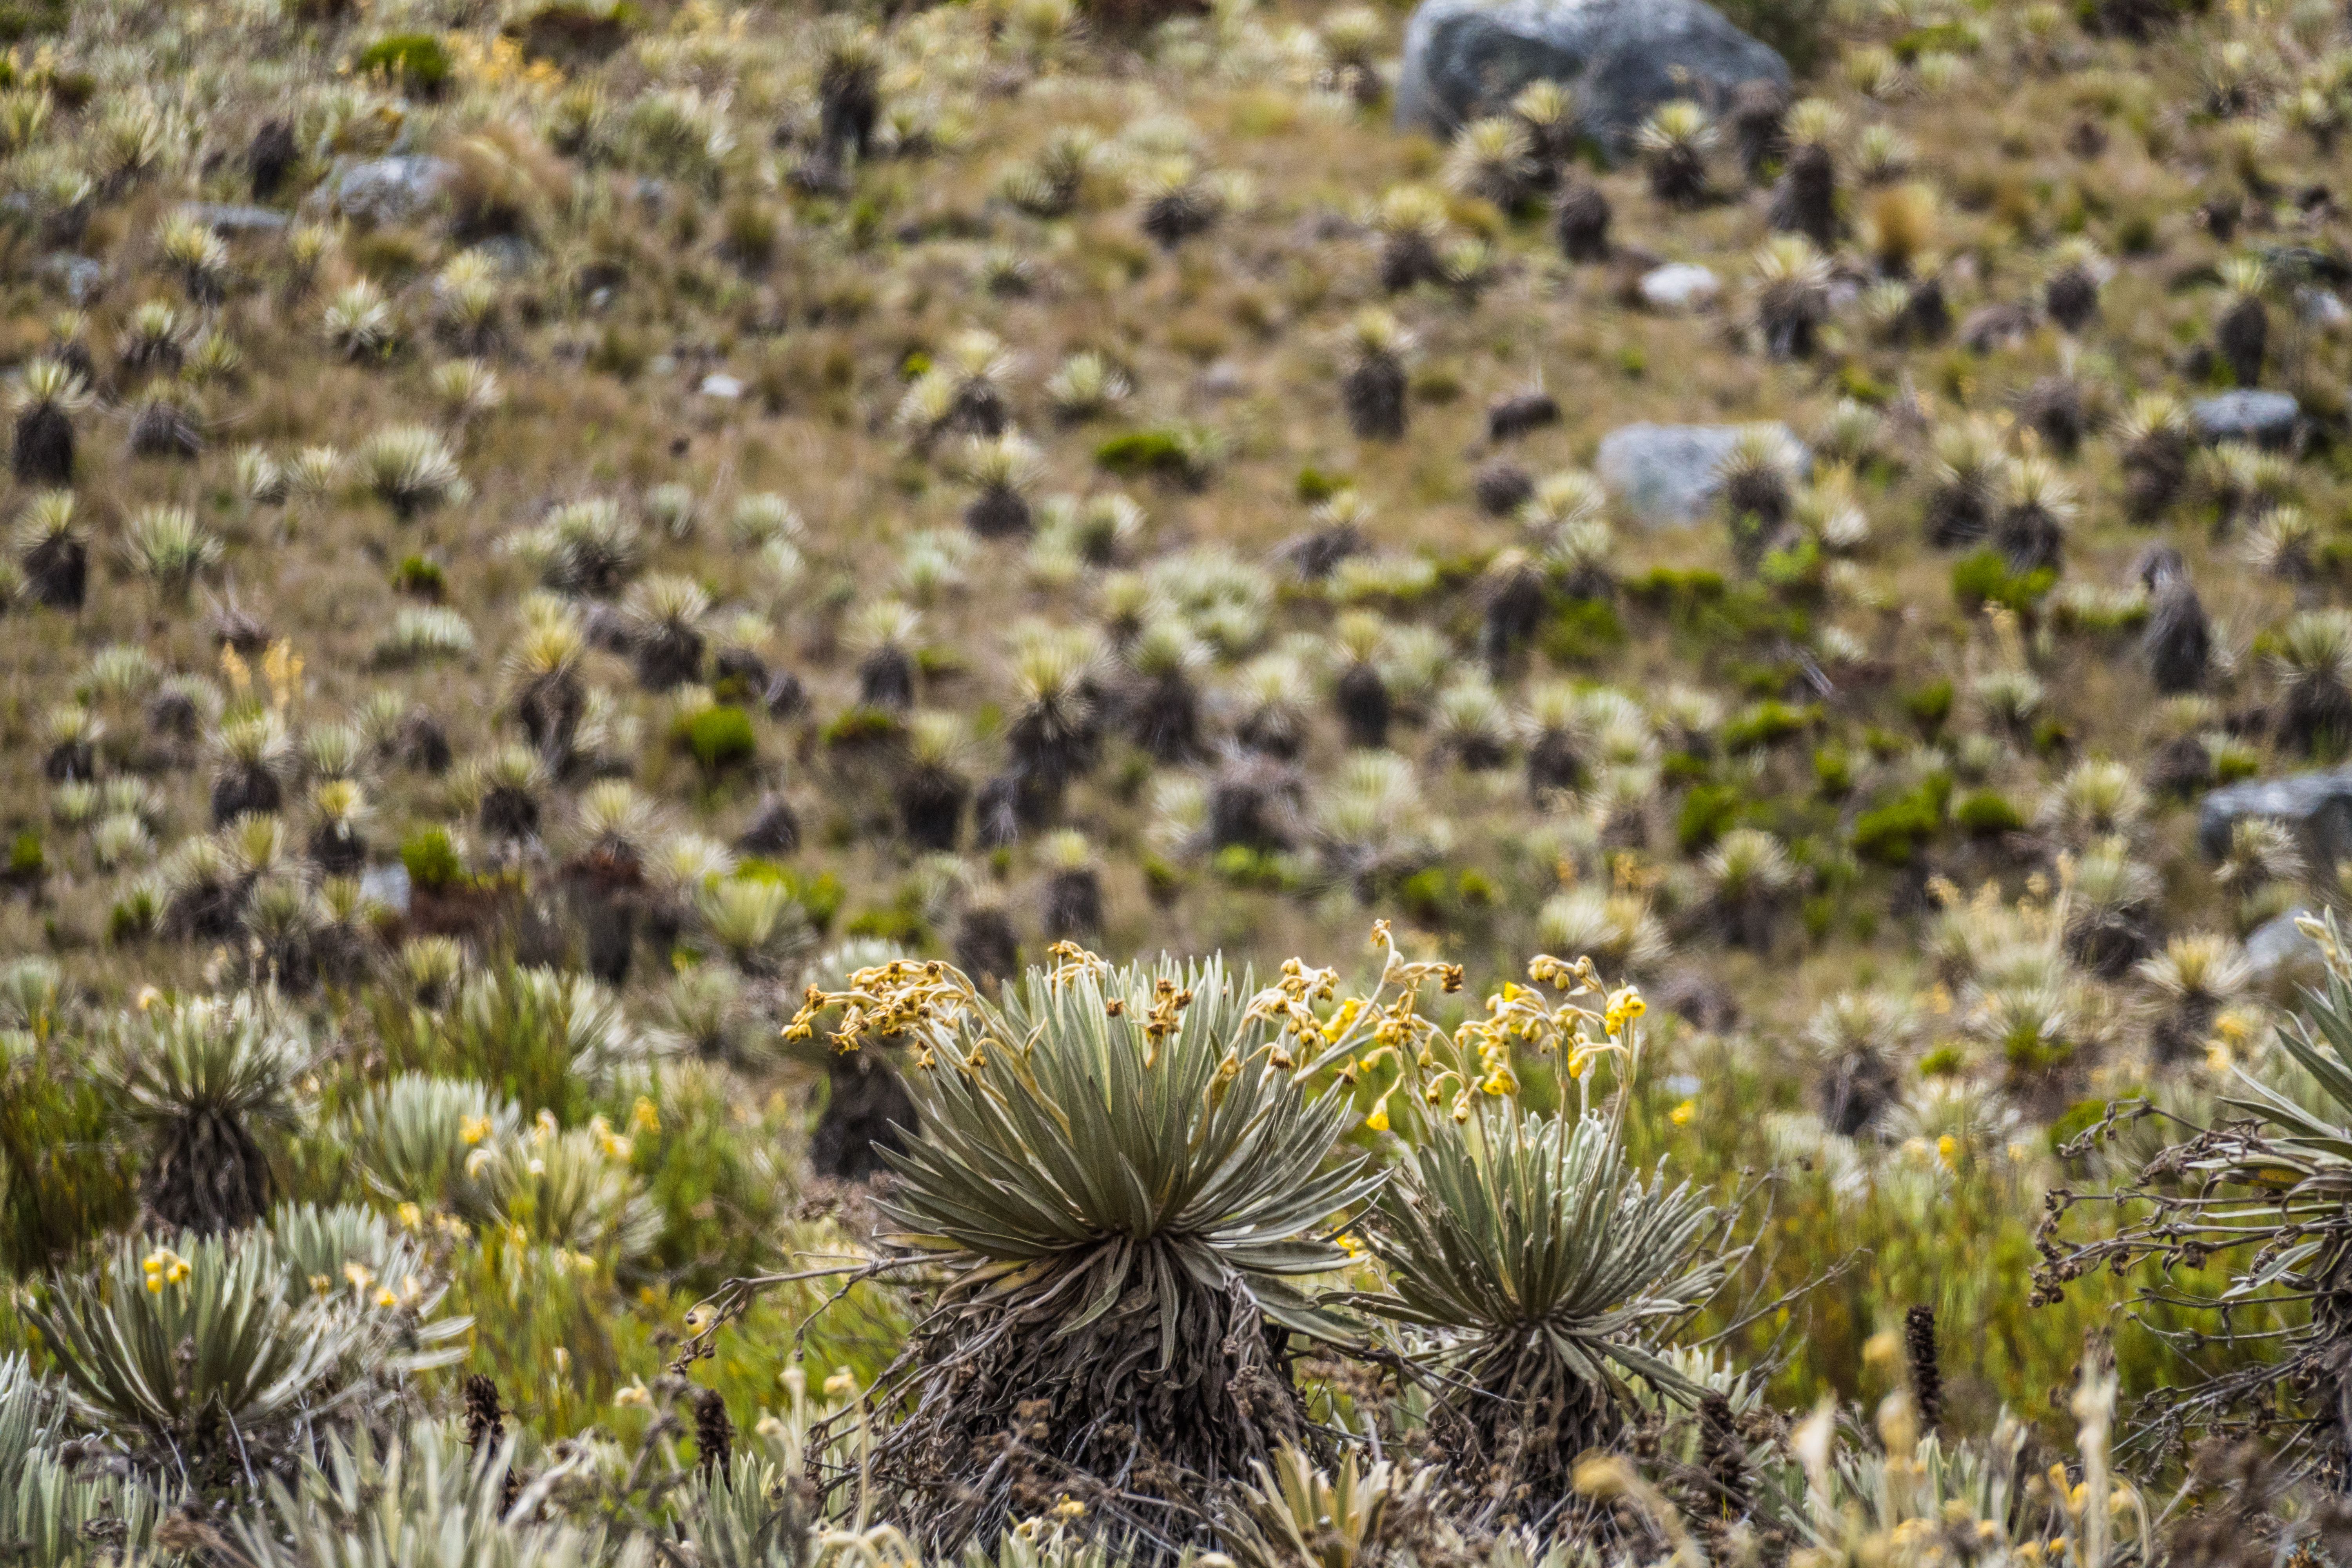
The vegetation is homogenous. It is dominated by two growth-forms, rosettes and shrubs, Espeletia schultzii and Hypericum laricifolium, respectively (Figure 1) (Rodriguez-Morales, 2010). They are the most common species, representing more than 65% of cover in the paramos of Sierra Nevada Park.
E. Schultz (Family Asteraceae) is a caulescent giant rosette with 30cm long leaves, covered with a dense white pubescence on both surfaces; its stem is protected by a layer of dead leaves, which isolated it against frozen nocturne temperatures. It has a medulla formed by parenchyma tissue, a water reservoir. It can get 125 cm high. In comparison, H. laricifolium (Family Hypericaceae) is a sclerophyllous shrub, highly branched with diminutive leaves 3mm long and 80 to 125cm high (Rada, 1993).
Soil characteristics
The paramo of Mixteque is a fluvio-glacial valley with high slopes and sandy loam soils dominated by Entisols and Inceptisols, with a minority of Histosols (7.4%) (Cordoba, 2014). According to Rodriguez-Morales et al. (2019), the soil has a field capacity of , a permanent wilting point of , saturation of , and saturated hydraulic conductivity of .
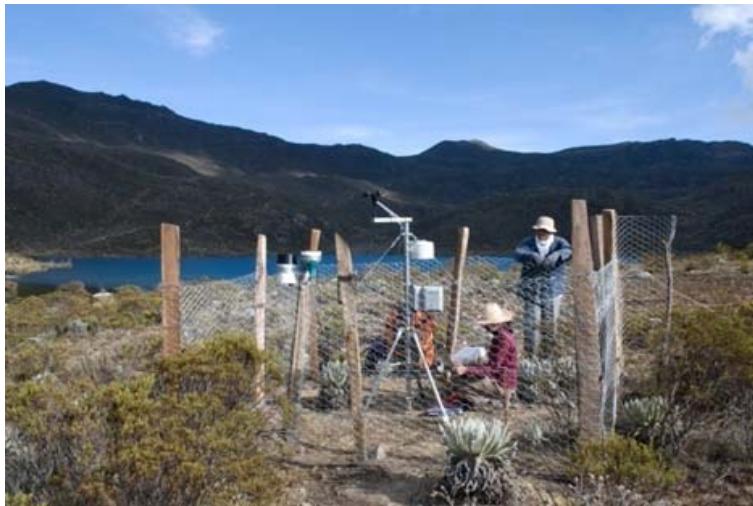 Figure 1: Experimental plot where the TDRs and weather station were installed. Surrounding the fence are shrubs of Hypericum laricifolium with small olive-green leaves and a rosette of Espeletia schultzii with big white leaves in the right-centre of the picture. Paramo of Mixteque, Merida-Venezuela.
Monitoring of water soil content
The soil water content (SWC) was monitored using four TDR sensors, model S-SMC-Moo5, brand HOBO, installed in the first 10cm depth. Two of them were in the bare soils and the other two below a rosette of Espeletia schultzii and under a shrub of Hypericum laricifolium in a 25 m2 parcel next to a weather station with rain, solar radiation, air temperature and wind speed sensors. The TDRs and the weather station were set up to measure every 10 minutes. The TDRs were calibrated with soil water content samplings collected during the fieldwork using the gravimetric method, ensuring the highest level of accuracy.
To the gravimetric method, soil samples were taken in the first 10 cm close to the TDRs, using metal cylindrical (15cm diameter). The soil in the cylinders was wrapped with cling film to keep the soil humidity intact. They were brought to the laboratory, weighed, dried using a heater for 48 hours and 105 C degrees, and then weighed again. The weight initial less the weight final is the water weight and divided by the dry soil (weight final) is the soil water content in gr gr units; to convert to m m , they were multiplied by the soil's bulk density reported by Rodriguez-Morales (2010). The calibration function was created through regression analysis between SWC gravimetric measures versus SWC measured with TDRs on the same date and time the gravimetric samples were collected and finally the TDR registers were right.
The study was developed between 8th March 2012 and 9th November 2013. Although there was a data gap between the 7th and 25th of July 2012, unfortunately, it is a period excluded from the analysis. To analyze the soil water content in a continuous period were used the registers from 25th July 2012.
Comprehensive analyses of the SWC were performed on a daily, monthly, seasonal, and full-period basis in the different covers. The soil water discharge was estimated using the daily trend slopes in the transition wet-dry seasons and after isolated rains during the dry season. The drainage was analyzed, estimating how often the SWC reached the field capacity. Surface runoff was analyzed by examining how often the SWC rose to soil saturation.
For evapotranspiration rate calculations, daily rain was recorded. The days without precipitation were filtered, and the soil water content variations ( ) were calculated through the difference between 6 am and 7 pm%SWC registers, light sun hours in tropical regions when there is the highest latent heat of vaporization in the ecosystem. Additionally, 24 hours was calculated as well. When the soil water content variations were negative (when the SWC initial was lower than the SWC final) were eliminated from the analysis.
The SWC and the units were transformed from to mm, using a 100-unit factor derived from the 10 cm depth where TDRs were installed. was equivalent to the evapotranspiration rate where TDRs were below vegetation and the evaporation rate where TDRs were in bare soils.
The Kruskal Wallis test and U de Mann-Whitney test were used to compare SWC and EVT means under the kind of covers, and the paired t-test was used to evaluate differences between the 12-hour and 24-hour analyses.
II. RESULTS
During the study period, the daily rain was 3.2 mm on average and 0.3 mm median, showing very low rainfall magnitude. The daily maximum was 39.8 mm. Figures 2a and 2b show the rain distribution in the study period. The dry season is clearly from November to March, with few isolated rainy days, and a wet season between April and October. Monthly rains in the dry season do not exceed 60 mm, while in the wet season, the rains can rise more than 200 mm per month. In the whole study period, the total rain was 1583 mm. Noticeably, just 5% (73 mm) of these incomes entered during the dry season, suggesting marked differences between seasons. In other words, during the dry season, the water input decreases, the environmental water demands increase in favor of evapotranspiration flux, the soil water stock is affected, and plants are under water stress pressure. While in the wet season, there is a high water income in the ecosystem, the rains are widespread, the saturation of the canopy is favored, and it is expected a rise in effective precipitation, high relative humidity, and more water enabled for plants, the soil is more likely to reach the saturation.
Figure 2c depicts the solar radiation inputs in the paramo, with a daily mean of . Notably, this increases to during the dry season when clouds are scarce and clear skies dominate. This surge in solar radiation plays a crucial role in the dry season, facilitating a temperature increase in the air, leaves, and soil surface, and a rise in evapotranspiration demands.
{"image_source":{"path":"images/44faf9dc9e5bad734a29eea744e3fec13f779f6c321bb4fad017531c4c0567a0.jpg"},"content":"","chart_caption":[],"chart_footnote":[]} {"image_source":{"path":"images/7699c481195de1895887e719fa4fed1b9c7af21d80f6ad321a61713992bf6d1f.jpg"},"content":"","chart_caption":[],"chart_footnote":[]}
{"image_source":{"path":"images/75035bcd84b56a72b9e645fa49cde866790a9a9a5f89b51924b2f5239faced9f.jpg"},"content":"","chart_caption":[],"chart_footnote":[]}
Figure 2a: Monthly rain (mm), Figure 2b. Daily rain (mm), and Figure 2c. Daily solar radiation mean (W m ), between July 2012 and November 2013, in the paramo of Mixteque.
Analysis of water soil content
The records of the two TDRs installed in bare soils did not show significant differences (sig=0.675); consequently, their average was used in the analysis.
During the study period, the shrub maintained the highest SWC, whose mean was similar to that of the bare soil but 36% higher than that of the rosette (Figure 3 and Table 1).
In the wet season, the bare soil retained a similar SWC mean to the shrub and was 20% higher than the rosette (Table 1). In contrast, in the dry season, the shrub hold the highest mean, around 30% higher than bare soil and the rosette, whose means were close.
Although the rosette maintained the lowest SWC mean during the study period and the dry season, Figure 4 shows that it maintained a higher and more stable SWC on dry days compared to bare soil.
{"image_source":{"path":"images/31730d53ef4e8335fafe64052d0672733950d6e640fec5f9c23a0a18b9acae06.jpg"},"content":"","chart_caption":[{"type":"text","content":"Figure 3: Daily soil water content mean (mm day "},{"type":"equation_inline","content":"^{-1}"},{"type":"text","content":") under a rosetta of Espeletia schultzii, below a shrub of Hypericum laricifolium, and in soils without plant cover, in the study period from 25th July 2012 to 9th November 2013, in the paramo of Mixteque."}],"chart_footnote":[]}
Table 1: Soil water content (mm day ) means and standard deviations (SD) of the study period and the seasons. Analysis under Espeletia schultzii, Hypericum laricifolium and bare soils, between 25th July 2012 and 9th November 2013, in the paramo of Mixteque.
| Whole period | Wet season | Dry season | |||||||
| Espeletia | Hypericum | Bs | Espeletia | Hypericum | Bs | Espeletia | Hypericum | Bs | |
| Average | $23.2^a$ | $28.2^a$ | $27.8^a$ | $27.9^b$ | $33.3^c$ | $34.4^c$ | $13.2^d$ | $17.2^e$ | $13.6^d$ |
| SD | 8.8 | 9.9 | 12.2 | 4.5 | 5.4 | 5.3 | 7.4 | 8.4 | 10.6 |
Regardless of the type of cover, the SWC saw a significant decrease at the start of the dry season (Figure 4). The bare soils, in particular, experienced a rapid decline at a rate of 0.84 mm day between 1st November and 17th December (Table 2), which was almost twice as fast as the covered soils, reaching values close to zero. In contrast, the rosette and the shrub showed a more gradual decrease of 0.59 mm day and 0.56 mm day , respectively.
{"image_source":{"path":"images/616200486b2299527949d59c244209d4f41bb7caa123f72769b7e94166b3e8e9.jpg"},"content":"","chart_caption":[{"type":"text","content":"Figure 4: Soil water content (mm day-1) variation. Analysis below a rosette of Espeletia schultzii, a shrub of Hypericum laricifolium and bare soil, from 25th July 2012 to 9th November 2013, in the paramo of Mixteque. Between dashed lines, the dry season."}],"chart_footnote":[]}
The SWC fluctuated according to the rain pattern (Figures 4 and 2b), but the magnitude of this variation is more notable in bare soil during the dry season. The water discharge in bare soils was 0.91 mm day after isolated rainy days in the dry season (between 27th December and 2nd February); in contrast, the soil under the rosette showed a slower water discharge of 0.42 mm day , and below the shrub, it was 0.63 mm day in this same period (Table 2) and maintaining SWC more constant.
Table 2: Slopes of the trend lines of Figure 4, representing the soil discharge rate (mm day ) in the wet-dry-season transition and after isolated rains in the dry season. Analysis of soils below a rosette of Espeletia schultzii, a shrub Hypericum laricifolium and bare soil, between 25th July 2012 and 9th November 2013, in the paramo of Mixteque.
| Period | Condition | Espeletia | Hypericum | Bare soil |
| 1ts Nov 2012-17thDec 2012 | Transition wet to dry season | -0.59 | -0.56 | -0.84 |
| 27thDec 2012-2ndFeb 2013 | After isolated rainy days in the dry season | -0.42 | -0.63 | -0.91 |
| Average | -0.51 | -0.59 | -0.88 |
{"image_source":{"path":"images/68108e693314ced71ed2d457a259300bc87a1a0f757b94817708e4a637823893.jpg"},"content":"","chart_caption":[{"type":"text","content":"Figure 5: Effect (%) of a rosette and a shrub upon the daily SWC mean. Positive values mean the cover increases the soil water stock. From 8th March 2012 to 9th November 2013, in the paramo of Mixteque."},{"type":"text","content":"The rosette reduced the SWC during the wet months (Figure 5) by 30% compared to bare soil. The shrub did not show an effect compared to bare soil. Conversely, in the dry season, plants helped maintain the SWC. During the driest month, the shrub held 120% more water than bare soils. The rosette kept 50% more water than uncovered soils."}],"chart_footnote":[]}
Analysis of drainage and superficial runoff
During the wet season, in bare soils, the WSC exceeded the field capacity (FC) in 95% of the 10-minute registers and 96% of the days (Table 3), so drainage was very likely. The shrub followed a similar trend to bare soil, but under the rosette, the SWC reached the FC in 64% of the registers and the wet days. This life form reduced the probability of drainage. In contrast, during the dry season, the drainage went down noticeably. In bare soils and the shrub, the SWC rose the FC in less than 19% of the 10-minute registers and days. Under the rosette, the drainage was almost improbable during this season (Table 3). Table 3: Analysis of the drainage. Number of days when the SWC reached the Field Capacity (FC) and their percentage (%). In Italic, the number of 10-minutes-registers when the WSC exceeded FC end its probability (%), below a rosette of Espeletia schultzii, a shrub Hypericum laricifolium and bare soil, between 25th July 2012 and 9th November 2013, in the paramo of Mixteque.
| Field Capacity | ||||
| Espeletia | Hypericum | Bare soil | Total | |
| Wet season | 204 (63) | 297 (92) | 309 (96) | 323 |
| Dry season | 4 (3) | 27 (18) | 28 (19) | 151 |
| Wet season | 19233 (64) | 41164 (89) | 43862 (95) | 46428 |
| Dry season | 147 (1) | 3031 (14) | 2656 (12) | 21744 |
Under any condition, the measured SWC was higher than the saturation point throughout the study period. As a result, the probability of surface runoff occurrence was extremely low by saturation.
Less than 8% of soil water content variations ( SWC) were negative in any cover condition, it means the SWC initial was lower than the SWC final; soil gained water in some days when rain was not registered; these SWC were eliminated from the evapotranspiration analysis.
The plant life forms did not significantly impact on 24h evapotranspiration means (Figure 6, black columns) throughout the period. The rosette EVT was 1.01 mm day-1, the shrub EVT was 0.97 mm day-1, and in bare soil, 0.96 mm day-1 (sig=0.370). The same trend was found in the 12h EVT (Figure 6, grey columns) (sig=0.157).
However, in the wet and dry seasons, the plants clearly influenced the EVT rates, and a marked contrast appeared (Figures 7).
Due the 24h EVT and 12h EVT showed the same trends, the following EVT analysis considered only the 24h EVT estimation.
{"image_source":{"path":"images/1137c4ba93513ae308ebf5e0be089d71d3dc5e3e98f632954e29fa77402ec6d0.jpg"},"content":"","chart_caption":[{"type":"text","content":"Figure 6: Comparison of daily evapotranspiration means estimated through 24-hours "},{"type":"equation_inline","content":"\Delta"},{"type":"text","content":" SWC and 12-hours "},{"type":"equation_inline","content":"\Delta"},{"type":"text","content":" SWC (light hours) in no rain days, in soils below a rosette of Espeletia schultzii, a shrub Hypericum laricifolium and bare soil, between 24th March 2012 and 9th November 2013, in the paramo of Mixteque."}],"chart_footnote":[]}
Wet season Plants had EVT rates 30% higher than bare soil in the rainy months. The EVT under the rosette was 1.32 mm day , and beneath the shrub, it was 1.26 mm day , contrasting with 0.83 mm day in bare soil. In other words, rosette and shrub increased the EVT compared with uncovered soils (Figure 7, black columns).
Dry season
EVT under the rosette and the shrub was almost a half lower than the bare soils (Figure 7, gray columns). EVT in the rosette was 0.70 mm day ; in the shrub, it was 0.66 mm day ; and in bare soils, it was 1.09 mm day , demonstrating that plants reduce the EVT rates and regulate the EVT outputs.
Comparing the rosette and shrub EVT between the wet and the dry seasons (Figure 7), it was found that plants drastically reduced their own EVT rates; their ETV in the dry season was almost half lower than their ETV in the wet season, this difference was around 0.60 mm day . In other words, it was water that was kept in the soils and did not go out from the ecosystem thanks to paramo plants. On the other hand, bare soils showed a 31% EVT increase, and EVT in the dry season was around 0.25 day extra than during dry months.
{"image_source":{"path":"images/a95258c01c81591ba90471341b6ce98e3020b73c64ac673c720136f5b1fb0d63.jpg"},"content":"","chart_caption":[{"type":"text","content":"Figure 7: Comparison of the daily evapotranspiration means in the wet and the dry seasons, estimated through the differences of 24h- "},{"type":"equation_inline","content":"\Delta"},{"type":"text","content":" SWC, in no rain days, in soils below a rosette of Espeletia schultzii, a shrub Hypericum laricifolium and bare soil, between 24th March 2012 and November 2013, in the paramo of Mixteque."}],"chart_footnote":[]} {"image_source":{"path":"images/4dbcb4bf0b6db854cb98efb6264e74074603a61a7019164948d3e19261245d21.jpg"},"content":"","chart_caption":[{"type":"text","content":"Figure 8: Daily evapotranspiration under different kinds of plant covers, estimated through the difference of soil water content in 24 hours (24h "},{"type":"equation_inline","content":"\Delta"},{"type":"text","content":" SWC), in no rain days, from 8 "},{"type":"equation_inline","content":"^{th}"},{"type":"text","content":" March 2012 to 9 "},{"type":"equation_inline","content":"^{th}"},{"type":"text","content":" November 2013, in the paramo of Mixteque. Between dashed lines, the dry season."}],"chart_footnote":[]}
The rosette had the highest daily EVT rates in the wet season (Figure 8), but on many days, the daily EVTs of the shrub were higher than that of the rosette. These few daily ETVs with large amounts below the rosette must considerably increase its wet ETV mean. In contrast, the bare soils had the highest
EVT rates on days without rain, while the shrub had the lower daily EVT rates on most days of the dry season.
III. DISCUSSION
3.1 Soil water content
The rosette had the lowest soil water content (SWC) mean during the whole period, and a similar SWC mean to the bare soils in the dry season. It could be interpreted as the rosettes do not favor water storage in soil. However, considering the rosette SWCs never were as lower as bare soil SWCs (values close to 0 mm) in the dry months, and additionally, the bare soil SWC rose sharply on the rainy days during the dry season, which increased its mean closing it to rosette mean; therefore, rosette might retain more water than it appears.
Wet season
Foliar Interception In the rainy months, foliar interception (F int) could explain the differences between the SWC in bare soils, the rosette, and the shrub. The lower SWC of covered soil might be due to the F int, which reduces the effective precipitation (Ef Pp) and the water inputs in soils, decreasing the SWC. The canopy characteristic affects the F int, so the plant life forms have different impacts in this flux.
According to this interpretation, bare soil received the total precipitation because no canopy intercepted it, so it had the highest SWC mean. Meanwhile, the shrub slightly modified the total precipitation due its tiny leaves and highly branched canopy. Supporting this supposition, the shrub SWC mean was 1.1 mm day-1 lower than bare soil SWC mean in the wet season. On the contrary, the giant leaves in dense spiral and marcescent leaves around the rosettes' trunk intercepted a considerable portion of the precipitation. The difference between rosette SWC and the bare soil SWC (rosetta F int) was around 5 mm day-1; consequently, the rosetta SWC mean was the lowest compared with the other covers.
In the Ecuador paramos, Ochoa-Sanchez et al., (2018) estimated a canopy storage capacity of tussock grasses of approximability 2 mm day-1, which agrees with the shrub and rosette F int estimation in this research according to their morphological characteristics.
Considering that F int turns in evaporation from the canopy and must be added to the evapotranspiration rate, the rosette's EVT rate was very high. A potential explanation could be the stemflow, which reduces the F int. Unfortunately, it was not measured in this research. This flux is water intercepted by the canopy, which then turns into infiltration through the trunks and roots. This flux contributes to restocking soil. The stemflow probably affected deep soil layers that the TDRs have not monitored. To support this supposition it is necessary to assess this flux through the design of laboratory experiments with rosette individuals, simulating precipitation and collecting the stemflow in the base of these plants.
Drainage
The SWCs were high under the shrub and in bare soil in the wet season; therefore, they overcame the field capacity in 90% of the wet season days. Consequently, drainage is a highly probable flux in these cover conditions, in contrast with the rosette, which had around 60% probability. The difference between shrub and rosette drainage could be attributed to their F int. The high rosetta F int reduced its SWC and its drainage probability.
This high drainage under the shrub and the bare soil must favor hydrological regulation because it contributes to subsurface fluxes supplying and maintaining the stream. Additionally, due the subsurface fluxes are slower than the surface ones, the drainage delays the water moves in the ecosystem and favors that paramo basins release the water slowly.
Surface runoff
Due to the SWCs never overcoming the soil water saturation in any cover conditions, surface runoff was not detected by exceeding the saturation in the study period. This outcome could be supported by Sarmiento (2000), who found that the runoff probability is very scarce, and just 5% of the total precipitation turns into this flux in the paramo of Gavidia, Venezuela.
The low surface runoff in paramos has been attributed to the high sand content of the Venezuelan paramos soils, which increases infiltration rates. For example, in the study area, Rodriguez-Morales et al. (2019) reported a sand content of 72.4%, similar to Gavidia. Buytaert et al. (2006b) reported that soil characteristics favor infiltration in the Ecuador paramos.
In combination with the soil properties, the very low rain intensity of the paramos is a significant factor that makes surface runoff less probable. Perrin et al. (2001) mentioned that the rain events produced Hortonian runoff in just a few days. The low-intensity rainfall is typical of paramos, according to Padron et al. (2015) and as reported by Rodriguez et al. (2014) Sarmiento (2000) and others.
Low surface runoff contributes to the paramos' hydrological regulation because water moves through subsurface fluxes in the ecosystem. It helps to conserve soils, minimizing the erosion process.
Evapotranspiration
In the wet season, the high rain frequency in the paramos (Rodriguez-Morales et al., 2015) favours holding soil water available to plants, so there is no water limitation to transpiration, and plants do not need to regulate the water outputs while they are photosynthesizing. Consequently, the EVT rates were 30% higher in soil covered than in bare soils during this season. Supporting this analysis, Rada (1993) reported that Hypericum laricifolium showed a little stromatic limitation in the wet months. Additionally, the plant roots can actively extract water from soils, and they could explore deeper layers, increasing the water enable to the EVT, while the bare soils have a water stock that if it consumed the evaporation stop.
The EVT was 5% higher in Espeletia schultzii, which could be explained by their larger leaves, which increase the transpiring surface compared with the tiny leaves of Hypericum laricufolium.
Wet season In contrast with the wet season previously analysed, during the dry months, the evapotranspiration rates should define the SWC under the different covers due to the foliar interception turned cero and the other fluxes.
The slope of the trend in Figure 4 or the soil water discharge is a way to estimate the EVT. These EVTs were similar to the EVT means calculated through the soil water content variations during the dry season.
It was found that the discharge of bare soil was almost two times faster than that of covered soils. Under this cover condition, the lowest registers of SWC were found. The shrub had the slowest slope, keeping the highest soil water amounts.
Analyzing the EVT estimated through the SWC, soils without cover had the highest EVT mean in the dry season. This can be explained by the increase in solar radiation and evapotranspiration demands (ETo) in this season, as described by Rodriguez-Morales et al. (2015) and Rodriguez-Morales (2010).
In dry conditions, the effect of plants upon EVT is more noticeable. The paramo species adaptations against the hydric stress reduce the EVT, conserving the water in this ecosystem (Rada, 1993). For example, the shrub of Hypericum laricifolium has tiny leaves with a leather texture leaf, which limits transpiration. While Espeletia schultzii has other adaptations against the hydric stress, its large leaves are covered by a dense white pubescent, which reflects the high solar radiation and lessens the leaf temperature and the gasses interchange, minimizing the transpiration flux, despite the fact its medulla stores water and keeps this flux going, making its EVT 5% higher than the shrub. Supporting this discussion, Sandoval et al. 2019, reported that Hypericum laricifolium has adaptations more effective against drought. Both growth forms showed strong stomatal control (Rada et al., 2019), especially in the middle of the day when the vapour pressure drops, the evapotranspiration demands rise, avoiding the transpiration increase.
Whereas, in bare soils, the main limitation to EVT is the soil water available to this flux (Callañaupa et al., 2012), due to this ecosystem receiving elevated energy.
Whole period
The similitude in the EVT means under shrub, rosette and bare soils during the study period can be explained through the contrasting influences changes that plants have on the EVT rates in each season; for example, their transpiration goes up, increasing their EVT rates during the wet season. While they limit the transpiration, their EVT decreases during the dry season. Both effects were cancelled out during the whole period. Contrariary, bare soils hold EVT (evaporation) is similar in both seasons.
Despite the imperceptible impact of plants upon the EVT throughout the study period, if climate change prolongs the drought period, the plant effect could be marked.
The positive soil water content differences in no rain days could be explained through inputs through the dew, fog or very low-intensity rain, less than 0.2 mm (rain gauge accuracy) that could not be restricted. Other explanation could be TDR inaccuracy measuring SWC. Deeper analyses are needed to. For example, analysis the relative humidity and temperatures to estimate the probability to dew happens or laboratory assay with TDRs installed in soil under evapotranspiration conditions and without any water input and the analysis of the SWC variation with the aim to verify if is find positive variations.
The method to estimate EVT through SWC has a noticeable limitation, particularly during the wet seasons. The rain frequency is markedly high in the Andean paramos, and there are not sufficient days to estimate it; for example, June and July 2013 had just one day each. However, it represents a low-cost and easy-to-implement method to estimate the EVT; it could be used to calibrate and validate other methods.
3.2 The growth forms effect upon the hydrological fluxes
Summarizing the influence of the rosette (Espeletia schultzii), in the wet months, it decreases the SWC, likely due to its high LAI which increases the foliar interception and reduces the effective precipitation. Additionally, the rosette minimizes the drainage fluxes. While, during the dry season, the rosette keeps the minimum SWC higher than uncovered soils and maintains it more stable in the time, thanks to its adaptations which reduce the transpiration and EVT rates.
In the wet season, the shrub (Hypericum laricifolium) holds as much water as bare soils due to its low FAI, which affects little the foliar interception, maximizing the effective precipitation, the water inputs in the soil, and keeping the drainage high. In the dry season, the shrub has a more marked effect on reducing the EVT, probably thanks to its tight stomatal control and other adaptations, keeping more water in this ecosystem than rosette and bare soils.
Both life forms have complementary effects on the hydric fluxes. For example, the rosettes, with their high F int, play a crucial role in protecting soil against the rains, thereby reducing erosion. This function becomes even more important with the expected increase in rain intensity due to climate change. Meanwhile, the shrubs promote soil drainage, keeping the subsurface flows and supplying caudal. Finally, both have a significant effect reducing the outputs through EVT in dry environmental conditions, characteristic important to face the increase of temperature and longer drought periods by the global warming, as it is predicted in the Andean ecosystem. Therefore, plants result in a vital ecosystem compartment to maintain the regulation and supplier role of the Andean paramos.
IV. CONCLUSIONS
The effect of life forms on the hydrological fluxes changes marked in the dry and wet seasons; in the wet season, the rosette reduces the soil water content, likely due to its high foliar interception, while the shrub holds as much SWC as the unprotected soils thanks its unimportant foliar interception, while, in the dry season, the WSC was defined by the evapotranspiration rates. The soil water discharge in bs was two times faster than under plant covers. The shrub maintained 120% more water and the rosette a half more than bare soils in the driest month.
The surface runoff was undetectable when comparing the WSC and the saturation point in any plant cover condition. Drainage is an important flux in the paramos, it is few affected by shrubs and slightly reduced by rosettes.
The significant 50% drop in evapotranspiration (EVT) in covered soil and the 31% increase in bare soils during the dry season underscore the crucial role of plants of paramos in regulating their own EVT rates. This regulation effectively reduces the EVT, protecting it against the high demand for evapotranspiration. When both effects are considered, the dominant plants in this ecosystem reduce the output by around 80% through evapotranspiration.
This research presents a preliminary assessment of the effects of plant life forms on hydrological fluxes. However, it is important to note that these findings need to be validated and further explored through other methods to confirm the trends observed. This underscores the need for continued research in this area.
The findings revealed the significant role that each plant species plays in the hydrological function of the Paramo ecosystem. Rosettes and shrubs, in particular, have unique effects on water fluxes, and their biomass and abundance can modify these fluxes, thereby impacting the regulation and water supply of the Paramos. The importance of the Paramos ' function as a water supplier cannot be overstated, underscoring the need to carefully assess and control anthropic activities such as grazing and extractive uses like timber harvest.
Faced with climate change and global warming, plants conform to a crucial and unique ecosystemic compartment, able to adjust to environmental changes and minimize their effects through regulating the EVT, protecting soil, and favouring drainage, among other processes. This reflects the importance of its conservation.
Conflict of Interest
The authors declare no conflict of interest.
Ethical Approval
Not applicable
Data Availability
The datasets used in this study are openly available at [repository link] and the source code is available on GitHub at [GitHub link].
Funding
This work did not receive any external funding.
References
Cite this article
Related Research


Special Issue
Launch a focused special issue to highlight research, emerging trends, and expert insights in your academic field.
