




IntelliPaper
Abstract
Pirate attacks pose one of the most severe challenges to the safety of maritime navigation. Effectively quantifying the risk of pirate attacks and understanding their spatial distribution through historical records is crucial for planning safe shipping routes. Given the diverse data types and multiple factors involved in assessing pirate attacks recorded in the Global Integrated Shipping Information System (GISIS) database, we propose a spatiotemporal influence factor analysis model based on the K-means clustering algorithm. Features are encoded using an Autoencoder, and the evaluation is conducted using the Entropy Weight Method- Technique for Order Preference by Similarity to Ideal Solution (EWM-TOPSIS). The model then simulates and predicts the geographical distribution of pirate risks. The results indicate that the model effectively captures the geographical distribution patterns of pirate attack incidents and successfully predicts the risk distribution across different sea areas. This approach aids in ship route planning and reduces the risk of pirate attacks.
Explore Digital Article Text
I. INTRODUCTION
Maritime transportation plays a pivotal role in the development of the global supply chain. According to the International Maritime Organization (IMO), nearly of the world's trade is conducted by sea [1]. However, the increasing frequency of pirate attacks has become a significant challenge for the maritime industry and one of the most serious and unsettling issues facing the international community [2][3]. Thus, effectively assessing the risk of pirate attacks and predicting the geographical distribution of piracy risk to aid in route planning for ships has become a critical task.
Current research on pirate attacks primarily focuses on three areas: descriptive statistical analysis, analysis of influencing factors, and risk assessment of pirate attacks. In terms of descriptive statistical analysis, Nwalozie analyzed contemporary piracy in Nigeria, the Niger Delta, and the Gulf of Guinea [4]. Denton et al. conducted a statistical analysis of piracy activities in the Gulf of Guinea, showing that stronger and democratic regimes are less likely to encounter piracy [5]. Regan used nonprobability sampling to analyze piracy cases between 1985 and 2018 in 11 countries, based on data from various organizations. Key predictors of piracy frequency were total country population, total fish tonnage, gross domestic product, and government weakness [6].
For analyzing the influencing factors of pirate attacks, Bayesian networks are commonly used for risk assessment and prediction. Jiang et al. utilized a Bayesian network to estimate the likelihood of ships being attacked or hijacked in Southeast Asia, considering the uncertainty of influencing factors . Fan et al. proposed a two-stage technique for order of preference by similarity to an ideal solution (TOPSIS) model based on the Bayesian network. In the first stage, a data-driven Bayesian network identifies causal relationships influencing pirate behaviors. The second stage involves calculating a decision matrix of strategies using TOPSIS, enhancing the strength of risk prediction and dynamic diagnosis by the Bayesian network [8]. Dabrowski et al. presented a novel generative model based on dynamic Bayesian networks (DBN) to simulate maritime vessel behavior, especially in piracy scenarios, allowing for the evaluation and optimization of behavior models through synthetic data generation and analysis [9].
Regarding the risk assessment of pirate attacks, Gong et al. proposed a two-step analytical framework based on a Random Forest (RF) model, Generative Adversarial Nets (GANs), and Matrix Completion (MC) algorithm to assess the risks of successful piracy attacks . Vaněk et al. developed AGENTC, a data-driven agent-based simulation model of maritime traffic that explicitly models pirate activity and countermeasures. This model simulates the behavior and interactions of thousands of vessels, capturing the complex dynamics of the maritime transportation system under piracy threat and assessing various countermeasures . Jin et al. used data on piracy attacks between 1994 and 2017 to estimate the probability of a vessel being attacked and the success rate of these attacks. Their binary logistic regression model showed that smaller vessels and open registry vessels are more likely to be targeted by pirates . Pristrom et al. proposed a flexible model for assessing piracy and robbery risks in merchant ship operations, analyzing incidents based on major influencing factors such as ship characteristics and geographical locations. An analytical model incorporating Bayesian reasoning was proposed to estimate the likelihood of a ship being hijacked in the Western Indian or Eastern African regions .
In summary, current research rarely integrates the spatiotemporal characteristics of pirate attacks, evaluates and analyzes risks, and predicts the geographical distribution of piracy risk. This paper addresses this gap by proposing a novel risk assessment algorithm for pirate attacks that considers spatiotemporal characteristics. Using K-means clustering, Autoencoder, and the Entropy Weight Method-TOPSIS (EWM-TOPSIS), this algorithm can simulate and predict the geographical distribution of piracy risk, providing crucial information for ship route planning and significantly reducing the risk of pirate attacks.
II. MATERIALS AND METHODS
This research begins by extracting pirate attack data from the Global Integrated Shipping Information System (GISIS) database. Using the K-means clustering algorithm, we delineate zones and construct external competition factors, internal attraction factors, quantity factors, and temporal factors. Based on these four related factors, we derive the geographical probability factor. Subsequently, we apply an Autoencoder to encode the features of the four risk impact indicators: geographical probability factor, number of pirates, weapon equipment score, and loss score. Finally, we use the EWM-TOPSIS method to conduct a comprehensive risk assessment and employ the nearest neighbor interpolation method to obtain the simulated and predicted distribution of pirate attack risks across different sea areas. The specific methodology and process flow are illustrated in Figure 1.
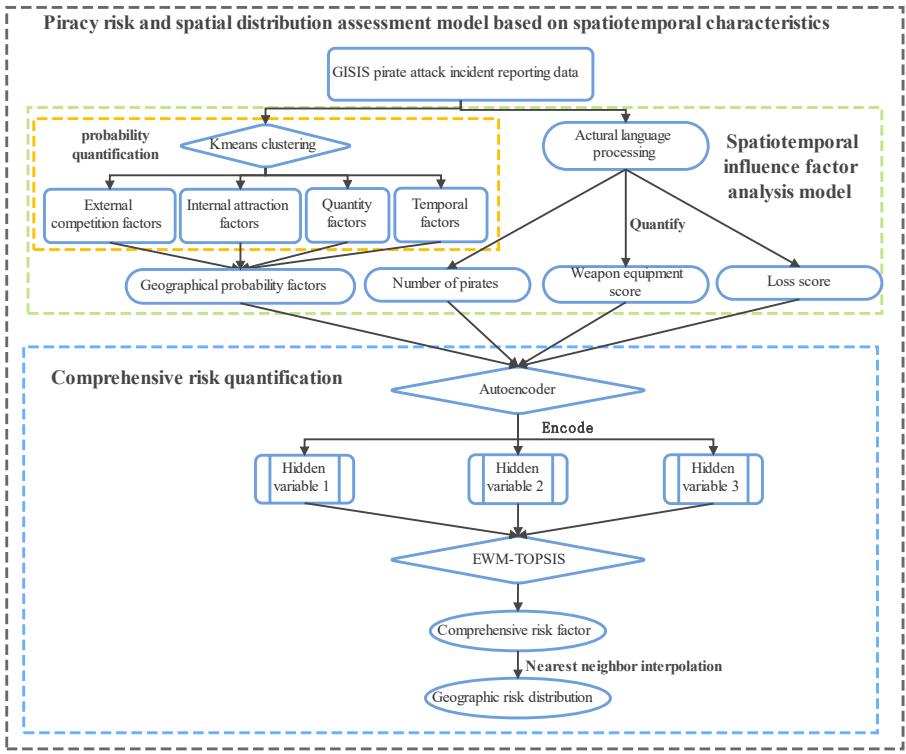 Figure 1: Algorithm flow structure chart
2.1 Analysis of Risk Influencing Factors in Pirate Attack Incidents
The risk of pirate attacks is influenced by several critical factors, including Geographical Probability Factor of Pirate Attacks, Number of Pirates, Weapons, and Losses Caused by the Attacks.
2.1.1 Geographical Probability Factor of Pirate Attacks
Hotspot areas typically indicate a higher density of pirate activities in a specific region during a particular time period, thereby significantly increasing the potential risk of ships encountering pirate attacks in these regions. Additionally, within the same maritime area, multiple types of pirate groups may exist, which can sometimes engage in conflicts or collusion with one another . Therefore, this research constructs a geographical probability factor of pirate attacks to comprehensively quantify these influencing factors.
2.1.2 Number of Pirates
The number of pirates is a crucial factor in assessing the risk of pirate attacks. A larger number of pirates makes it more challenging for ships to effectively defend against attacks, thereby increasing the overall risk. This research incorporates the number of pirates as one of the quantifiable factors in evaluating the risk of pirate attacks, aiming to enhance the accuracy and comprehensiveness of the risk assessment.
2.1.3 Weapons
The type of weapons used by pirates significantly impacts the severity of the risk in pirate attack incidents. Pirates typically employ a variety of weapons, including boats, knives, firearms, and rockets. Both the quantity and technological sophistication of these weapons are critical factors in risk assessment. Therefore, this research constructs a weapon equipment score to comprehensively evaluate the level of pirate armament, thereby providing a more precise quantification of the attack risk.
2.1.4 Losses Caused by Attacks
Pirate attacks can result in various types of losses, including theft of goods, hostage-taking, and casualties. The scale of these losses and the severity of the casualties reflect the increased risk level of pirate attacks. This research constructs a loss score to quantify the extent of damage and casualties caused by pirate attacks, providing a more accurate assessment of the risk.
2.2 Quantification of Pirate Attack Risk Indicators
2.2.1 Geographical Probability Factors
The occurrence of pirate attacks is not a matter of chance. To quantify the probability of pirate incidents at various geographical locations, this research introduces the geographical probability factor.
- Clustering of Pirate Incident Hotspots Based on K-means Algorithm
K-means is a common unsupervised machine learning clustering algorithm aimed at dividing a dataset into k distinct clusters. Each sample belongs to one cluster, ensuring high similarity within the cluster and low similarity between different clusters . In this research, we use the latitude and longitude data of pirate attacks as input to the K-means algorithm to identify regions with frequent pirate activities. Additionally, to set a reasonable number of pirate activity centers within a maritime area, we evaluate the number of clusters using the Sum of Squared Errors (SSE):
Where represents the number of pirate incidents occurring in the i-th pirate activity center area. and respectively denote the longitude and latitude of the j-th pirate incident point belonging to the i-th pirate activity center area. and represent the longitude and latitude of the pirate activity center point.
• Calculation of Geographical Probability Factor
Divide the maritime area into M grid points in an grid. Using the trained K-means clustering model, each grid point is assigned to the nearest pirate activity center region. The closer a grid point is to a pirate activity center, the more frequent the pirate activities. Therefore, the internal attraction factor is derived as follows:
Where represents the number of grid points contained in the i-th pirate activity center area; and respectively denote the longitude and latitude of the j-th grid point belonging to the i-th pirate activity center area; represents the internal attraction factor of the j-th grid point belonging to the i-th pirate activity center area.
There exists a competitive relationship between different pirate groups, making pirate incidents less likely to occur in overlapping areas of influence between two pirate groups. Therefore, the calculation formula for the external competition factor is as follows:
Where represents the Euclidean distance from the i-th pirate activity center point to the j-th pirate activity center point; represents the external competitive factor of the i-th pirate activity center point. By combining the internal attraction factor and the external competition factor, we derive the comprehensive competition factor:
Where represents the comprehensive competitive factor of the j-th grid point belonging to the i-th pirate activity center area.
If a pirate incident has recently occurred in the surrounding area of a grid point, it is likely to face another pirate attack in the near future.
Therefore, this research introduces the quantity factor and the temporal factor . The quantity factor is measured by the total number of pirate incidents occurring within the four adjacent grids connected to each grid point for each year (as shown in Figure 2). Finally, by combining the quantity factor and the temporal factor, we derive the activity factor as follows:
Where and represent the selected starting and ending years of the pirate attack incidents, respectively; represents the quantity factor of the j-th grid point belonging to the i-th pirate activity center area in year q; represents the temporal factor in year q; t represents a time hyperparameter; represents the activity factor of the j-th grid point belonging to the i-th pirate activity center area.
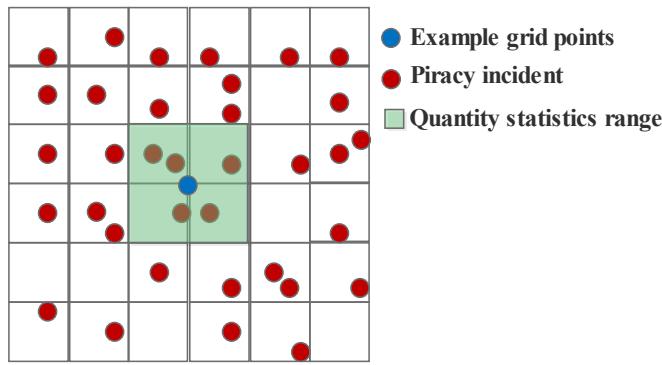 Figure 2: Quantity factor calculation diagram
By combining the comprehensive competition factor and the activity factor, followed by normalization, we obtain the geographical probability factor:
Where represents the geographical probability factor of the j-th grid point belonging to the i-th pirate activity center area.
Finally, the Cubic Spline Interpolation algorithm is used to interpolate the geographical probability factor for each actual pirate incident location:
Where are the coefficients of the interpolation function, obtained by selecting the 8 nearest neighboring grid points including the target point to be interpolated and setting up a linear equation system for solution. and respectively represent the longitude and latitude of the i-th pirate incident location. represents the geographical probability factor of the i-th pirate incident location.
2.2.2 Number of Pirates
Generally, a higher number of pirates indicates a greater risk of pirate attacks. Therefore, this paper uses the number of pirates involved in each incident as one of the key indicators for assessing the risk of pirate attacks.
2.2.3. Weapon Equipment Score
2.2.3. Weapon Equipment Score
Pirates typically use a variety of weapons, including knives, firearms, boats, and rockets. The quantity and technological sophistication of these weapons are critical indicators of the risk posed by pirate attacks. Using the GISIS database, processed through natural language processing, this research extracts relevant descriptions and quantities of weapons from pirate attack reports. We then perform quantitative analysis on this information (as shown in Table 1) and calculate a weapon equipment score for each pirate attack based on the quantity and value of the weapon information:
Where represents the scoring of the j-th weaponry information for the i-th pirate attack incident location; represents the quantity of the j-th weaponry information for the i-th pirate attack incident location; represents the Weapon Equipment Score for the i-th pirate attack incident location.
Table 1: Weapons and Equipment Information Scores
| Weapons and Equipment Information | Score |
| Knives | 1 |
| Guns | 2 |
| Boat | 3 |
| Armed | 3 |
| Rocket | 4 |
2.2.4. Loss Score
The losses incurred from pirate attacks include theft of goods, hostage-taking, and casualties. The extent of these losses is a critical indicator of the risk associated with pirate attacks. Using the same method as for calculating the weapon equipment score, we perform a quantitative analysis of the loss information from pirate attacks (as shown in Table 2). We then compute the loss score for each pirate attack by integrating the quantity and value of the loss information:
Where represents the scoring of the j-th loss information for the i-th pirate attack incident location; represents the quantity of the j-th loss information for the i-th pirate attack incident location; represents the Loss score for the i-th pirate attack incident location.
Table 2: Loss Information Score
| Loss information | Score |
| Stolen | 1 |
| Wounded | 2 |
| Hijacked | 2 |
| Fired | 3 |
| Raft | 4 |
2.3 Feature Encoding Based on Autoencoder
Autoencoder is a type of neural network model commonly used for feature extraction and data dimensionality reduction . Compared to traditional dimensionality reduction algorithms such as Principal Component Analysis and Factor Analysis , autoencoders can capture nonlinear data relationships while performing adaptive feature learning and more effective representation learning. Autoencoders consist of two processes: encoding and decoding. The basic structure includes an input layer, hidden layers, and an output layer (as shown in Figure 3), with the objective of minimizing reconstruction error.
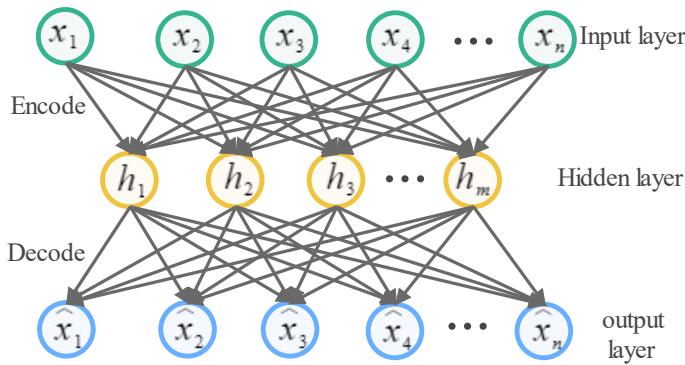 Figure 3: Autoencoder Structure
The first step is to encode the input layer variables into hidden layer variables for dimensionality reduction:
Where represents the weight matrix; represents the bias vector; o represents the activation function; X represents the input layer variables; H represents the hidden layer variables.
Next, the hidden layer variables are decoded back to their original form:
Where represents the weight matrix; represents the bias vector; represents the output layer variables.
The formula for calculating reconstruction error is:
2.4 Evaluation of Comprehensive Risk Factors Based on EWM-TOPSIS
2.4.1 Weight Calculation Using Entropy Weight Method (EWM)
The entropy weight method (EWM) is an objective weighting algorithm based on information entropy theory . It determines the weights of each indicator based on their information content, thereby avoiding the subjective biases present in subjective weighting methods such as the Analytic Hierarchy Process (AHP), and improving the objectivity and authenticity of evaluation results. The specific steps are as follows.
First, perform indicator normalization. Since the encoded hidden risk indicators are all of the "larger-the-better" type, the inherent process is:
Where represents the j-th hidden risk indicator of the i-th sample.
Second, calculate the proportion of the i-th sample value under the j-th hidden risk indicator:
Third, calculate the entropy value of the j-th hidden risk indicator:
Fourth, calculate the coefficient of variation of the j-th hidden risk indicator:
Fifth, calculate the weight of the j-th hidden risk indicator:
2.4.2 Evaluation of Comprehensive Risk Factors using TOPSIS Method
TOPSIS is an objective comprehensive evaluation method that effectively utilizes the information from the original data to reflect the differences between alternative schemes . In this research, we combine the weights calculated using the Entropy Weight Method (EWM) with TOPSIS to obtain the comprehensive risk factors for pirate attacks. The specific calculation steps are as follows:
Next, calculate the positive ideal solution and the negative ideal solution:
Furthermore, calculate the distances from each sample to the positive ideal solution and the negative ideal solution:
Finally, calculate the comprehensive risk factor:
Where represents the comprehensive risk factor of the i-th pirate attack incident.
2.5 Geographical Distribution Simulation and Prediction of Comprehensive Risk Factors Based on Nearest Neighbor Interpolation
Nearest neighbor interpolation is a simple yet effective interpolation algorithm. For a given target location, the algorithm identifies the closest data point from a set of known data points and uses its value as the interpolation result . In this research, we assume the maritime area is divided into grid points, resulting in a total of N grid points. Using the comprehensive risk factors from known pirate attack locations, we estimate the comprehensive risk factors for each grid point through nearest neighbor interpolation. This approach allows us to simulate and predict the geographical distribution of pirate attack risks within the maritime area.
III. RESULTS
3.1 Dataset
The data for this research is sourced from the GISIS pirate attack incident database, which provides statistics on the number of global pirate attacks from 2006 to 2022 (as shown in Figure 4). It is evident that East Africa, West Africa, the Arabian Sea, and the Strait of Malacca are hotspots for pirate attacks. Specifically, there were 283 incidents in East Africa, 647 in West Africa, 910 in the Arabian Sea, and 518 in the Strait of Malacca. Consequently, these four maritime regions were selected as the focus of our research to evaluate the risk of pirate attacks and to simulate and predict their geographical distribution.
Additionally, the original pirate attack data is highly fragmented. Through further data preprocessing and natural language processing (including tokenization, stop word removal, lemmatization, and keyword extraction), we extracted the necessary information such as latitude and longitude, number of pirates, weapon details, and loss data for quantifying the risk indicators of pirate attacks.
3.2 Classification Results of Central Areas
The determination of the number of central areas k is the basis for conducting the K-means clustering algorithm to partition the pirate attack incidents. The variation of the Sum of Squared Errors (SSE) with different numbers of central zones is shown in Figure 5. It can be observed that
SSE decreases as the number of central areas increases. When k exceeds 3, the downward trend of the SSE curve for each region slows down. This point is considered as the "elbow point", indicating the optimal number of clusters. Therefore, in this research, the number of central zones for each maritime areas is set to 3.
After determining the number of central zones for each maritime region, the K-means clustering algorithm is applied to partition each pirate attack incident into the respective pirate activity center zones (as shown in Figure 6). It can be observed that pirate attack incidents exhibit a certain degree of clustering. The majority of pirate attack incident locations are relatively close to their cluster centroids, indicating the effectiveness of clustering to some extent. Subsequently, the maritime regions are divided into a total of 400 grid points (20×20 grid), and each grid point is assigned to its respective pirate activity center zone using the trained K-means clustering model.
3.3 Results of Geographical Probability Factor for Pirate Attack Incidents
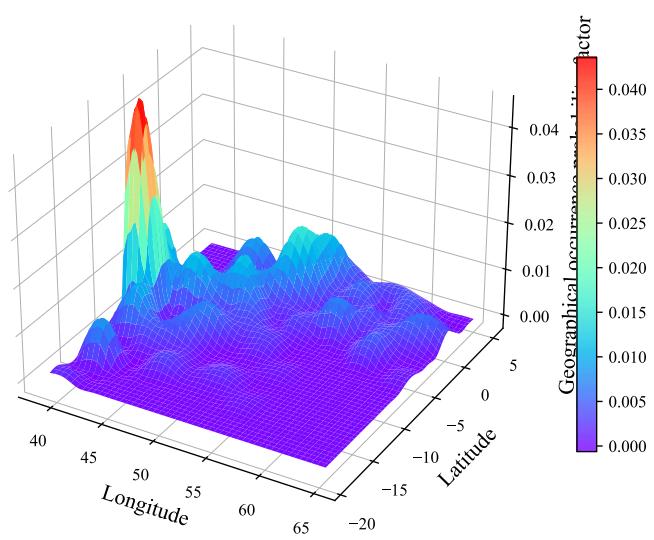
Based on the K-means clustering results and the latitude and longitude information of each pirate attack incident, the time hyperparameter t is set to 0.02. Using the proposed algorithm, we can determine the geographical probability factor for pirate incidents at each grid point across different regions. The results are shown in Figure 7. It demonstrates a significant similarity between the geographical probability factor distribution generated by our algorithm and the actual distribution of pirate attack incident locations. This finding strongly suggests that the proposed algorithm effectively captures and measures the geographical distribution patterns of pirate attack incidents.
3.4 Results of Indicator Encoding
The Autoencoder model constructed in this research has 5 neurons in the input layer, 3 neurons in the hidden layer, and 5 neurons in the output layer, with Leaky ReLU as the activation function. During the training process of the Autoencoder, the Adam optimizer is used, with a first-order momentum hyperparameter of 0.9, a second-order momentum hyperparameter of 0.999, an initial learning rate of 0.001, 100 training epochs, and a batch size of 4. The training results are shown in Figure 8. the reconstruction error continuously decreases during the training process. This indicates that the model progressively extracts key information from the raw data, enabling the hidden layer variables to more effectively capture the features and structure of the data.
Using the Autoencoder, we encode and learn the representations of four risk indicators: the geographical probability factor of pirate incidents, the number of pirates score, the weapon equipment score, and the loss score. The encoded risk indicators' results are shown in Figure 9. It shows that the risk indicators encoded by the
Autoencoder model exhibit more regular distribution characteristics, resembling a step-like distribution. This allows for more effective representation of the risk information associated with each pirate attack incident, facilitating subsequent comprehensive risk evaluation and analysis.
3.5 Comprehensive Risk Factor Evaluation Results and Comparative Analysis
Using the EWM-TOPSIS method, we scored the hidden risk indicators for each pirate attack incident to obtain the final comprehensive risk factors. Additionally, we compared these results with those obtained using the commonly used Entropy Weight Method combined with Grey Relational Evaluation (EWM-GRE) to analyze the differences between the scoring results. As shown in Figure 10, the EWM-TOPSIS method and EWM-GRE present similar results for the comprehensive risk evaluation of the same pirate attack incidents. However, the EWM-TOPSIS method proves to be more effective in distinguishing the differences between the comprehensive risk factors of various pirate attack incidents.
3.6 Simulated Geographical Distribution of Comprehensive Risk Factors
After obtaining the comprehensive risk factors for each pirate attack incident, we further refined the maritime area into a total of 40,000 grid points to achieve more precise geographical risk distribution. Using nearest neighbor interpolation, we simulated and predicted the distribution of comprehensive risk factors across different maritime regions, as shown in Figure 11.
According to the predicted comprehensive risk factor distribution in Figure 11, the risk of pirate attacks is high in the East African region at E- E, S- S. In the West African region, the area between E- E and N- N shows a higher risk of pirate attacks. The Arabian Sea ( E- E, N- N) displays significant risks, characterized by an irregular and highly fragmented risk distribution pattern. The Malacca Strait ( E- E, N- N) has a very high risk of pirate attacks in certain areas.
In summary, the algorithm proposed in this research successfully simulates and predicts the distribution of comprehensive risk factors for pirates in different maritime areas. These results provide valuable reference information for ship route planning, helping to reduce the risk of pirate attacks and offering broad potential and benefits in practical applications.
IV. DISCUSSION
This paper presents a spatiotemporal feature-based pirate attack risk assessment model, which successfully simulates and predicts the comprehensive risk distribution across different maritime regions. First, by incorporating the spatiotemporal distribution characteristics of pirate attacks, we employ the K-means clustering algorithm to delineate key pirate activity center zones. This allows the construction of a geographical probability factor that captures spatiotemporal feature information, serving as a critical indicator for risk assessment. Additionally, natural language processing techniques are used to further extract and quantify three key pirate attack risk indicators: the number of pirates, weaponry score, and loss score.
Subsequently, an Autoencoder is utilized to encode these risk indicators, resulting in a more structured, step-like distribution of the data, which effectively enhances the representation of pirate attack risk information and improves the accuracy of subsequent risk assessments. Finally, a comprehensive evaluation of pirate attack risks is conducted using the Entropy Weight Method (EWM) combined with the Technique for Order Preference by Similarity to Ideal Solution (TOPSIS), allowing for a precise analysis of risk.
The experimental results demonstrate that the proposed model not only accurately captures the geographical distribution patterns of pirate attacks but also effectively differentiates the risk levels across various pirate incidents. Through a comparative analysis with the EWM-GRE model, the EWM-TOPSIS method shows superior performance in distinguishing risk variations among different pirate attacks. Based on these findings, the nearest neighbor interpolation method was applied to simulate and predict the comprehensive risk of pirate attacks in four key maritime regions: East Africa, West Africa, the Arabian Sea, and the Strait of Malacca. These results provide valuable reference points for safe route planning in maritime navigation.
This study proposes a pirate attack risk assessment model based on spatiotemporal feature analysis, providing valuable practical references for maritime route planning. First, the study simulates and predicts the distribution of pirate attack risks in four key maritime regions: East Africa, West Africa, the Arabian Sea, and the Strait of Malacca. Based on these precise risk prediction results, shipping companies and vessels can develop safer routes to avoid high-risk areas, thereby effectively reducing the likelihood of pirate attacks. Additionally, the study integrates four critical risk indicators—geographical probability factor, number of pirates, weaponry score, and loss score—offering a comprehensive evaluation of pirate attack risks. This holistic assessment approach significantly enhances the identification and classification of pirate attack risks, enabling governments and international maritime organizations to formulate more accurate preventive measures. By helping the shipping industry mitigate economic losses and improve maritime safety, this model also contributes to the stability and development of global trade.
This study also has certain limitations. First, due to the constraints of the dataset used, only four pirate attack risk indicators were quantified: the geographical probability factor, the number of pirates, the weaponry score, and the loss score. In the future, the exploration of additional pirate attack datasets could enable the extraction of more potential risk indicators, thereby providing more comprehensive data support for subsequent risk assessments. Second, while current neural network models possess strong feature extraction capabilities, their internal mechanisms remain difficult to interpret. In this study, an Autoencoder was used for feature encoding, resulting in a more orderly step-like distribution of the data. However, this method still falls short in explaining the underlying mechanisms of pirate attack risk information, necessitating further research to validate and improve its effectiveness. Finally, the study employed the Nearest Neighbor Interpolation algorithm to simulate the comprehensive risk distribution of pirate attacks across different maritime regions. While this algorithm offers simplicity and high computational efficiency, particularly in scenarios requiring large-scale, real-time risk prediction, it relies solely on the nearest data point. This can lead to discontinuities or abrupt changes at boundary areas, resulting in unrealistic risk distribution gaps. Additionally, the Nearest Neighbor Interpolation method may overlook the potential spatial gradient of pirate attack risks, thus impacting the smoothness and global consistency of the prediction results.
In future research, we plan to first collect and expand the dataset of pirate attack incidents to extract and quantify additional risk indicators, aiming to achieve a more comprehensive and accurate assessment of pirate attack risks. Second, we will delve deeper into the application mechanisms of Autoencoders in feature encoding, analyzing how they produce more orderly, step-like distribution characteristics in the data to enhance the model's interpretability. Third, we will optimize the current interpolation algorithms, focusing on addressing the issues of smoothness and global consistency that arise from using the Nearest Neighbor Interpolation algorithm in the simulation and prediction of comprehensive pirate attack risks. Finally, based on the simulated and predicted comprehensive risk results, we plan to develop a targeted ship route planning system, providing more scientifically informed guidance for the safe navigation of vessels.
V. CONCLUSIONS
The algorithm proposed in this paper effectively captures and measures the geographical distribution patterns of pirate attacks, demonstrating significant similarity to actual occurrences. The main findings and contributions of this research are summarized as follows:
-
Construction of Spatiotemporal Feature Characteristics: By employing the K-means clustering algorithm and introducing the geographical probability factor, we fully account for the spatiotemporal distribution characteristics of pirate activities, laying a solid foundation for subsequent risk assessment;
-
Enhanced Data Representation: The data processed through the Autoencoder for dimensionality reduction exhibit more structured distribution characteristics, enabling more effective representation of the risk information associated with each pirate attack incident;
-
Effective Risk Assessment: The use of EWM-TOPSIS effectively measures the risk of pirate attacks, facilitating a finer and more accurate differentiation of risk variations between different pirate attack incidents;
-
Geographical Risk Prediction: The algorithm proposed in this paper effectively simulates and predicts the distribution of comprehensive risk factors of piracy across various maritime regions. These simulation results provide crucial reference information for maritime route planning, aiding in the mitigation of piracy attack risks. The prediction of comprehensive risk factors indicates that piracy attack risks are higher in certain areas of the East African maritime region (39°E-42°E, 6°S-8°S) and the Strait of Malacca (103°E-104°E, 1°N-2°N). Additionally, certain areas of the West African maritime region (3°E-5°E, 6°N-15°N) show elevated risks, while the Arabian Sea (45°E-70°E, 5°N-15°N) exhibits significant and irregularly distributed piracy attack risks. This algorithm demonstrates extensive potential and advantages in practical applications.
Funding: This research was funded by Zhejiang Provincial Public Welfare Project of China under Grant No. LGG22E090004, Zhejiang Provincial Natural Science Foundation of China under Grant number LQ21E090006.
Institutional Review Board Statement: Not applicable.
Pirates typically use a variety of weapons, including knives, firearms, boats, and rockets. The quantity and technological sophistication of these weapons are critical indicators of the risk posed {"image_source":{"path":"images/14c717f83322d49d3fc1b10bd7ed9a34ca2ee812a669a1a779a8cdfe633d5c74.jpg"},"content":"","chart_caption":[{"type":"text","content":"Figure 4: Statistics on the Number of Piracy Incidents in Various Sea Areas"}],"chart_footnote":[]}
{"image_source":{"path":"images/1b6bbcef18298d295a2549366613777b73e741927afd9634e235c0285c09a35b.jpg"},"content":"","chart_caption":[{"type":"text","content":"Figure 5: SSE changes in the Number of Central Areas for Different Pirate Attacks"}],"chart_footnote":[]} {"image_source":{"path":"images/817608db1cc78e026864eadfc98af29b8ac350eab62b19af64086250b322c4d7.jpg"},"content":"","chart_caption":[],"chart_footnote":[]}
{"image_source":{"path":"images/73da29a9ca81ba602449797d5057ff2a585361c5df817e57049ec5ae5223a1cc.jpg"},"content":"","chart_caption":[{"type":"text","content":"(a)"},{"type":"text","content":"(c)"}],"chart_footnote":[]} {"image_source":{"path":"images/a6eca91311b9e7ace70d40fc88550535ecdc6c8b9c0ff42437a5e72dea99236c.jpg"},"content":"","chart_caption":[],"chart_footnote":[]}
{"image_source":{"path":"images/9709f0d130feaf86a1b56476de220874585d6df5184d18bf13261392949c22a7.jpg"},"content":"","chart_caption":[{"type":"text","content":"(b)"},{"type":"text","content":"(d)"},{"type":"text","content":"Figure 6: Clustering results of pirate attacks: (a) East Africa, (b) west Africa, (c) Arabian Sea, and (d) Strait of Malacca"}],"chart_footnote":[]} {"image_source":{"path":"images/6fbab8e4eb199df0198292fd21be3105fa7ec69d2f375b6eac86f4c9b3f9f6f8.jpg"},"content":"","chart_caption":[{"type":"text","content":"(b)\nStrait of Malacca"},{"type":"text","content":"(a)\nArabian Sea"}],"chart_footnote":[]}
{"image_source":{"path":"images/403a957b671087b31f6d98b2b43b860f8b6cd2647132f7046af98d3b9e483607.jpg"},"content":"","chart_caption":[],"chart_footnote":[]} {"image_source":{"path":"images/782d493bdd6f739e0880191be6d385c55f415483cf04b373900654bb1906121e.jpg"},"content":"","chart_caption":[{"type":"text","content":"(c)"}],"chart_footnote":[]}
{"image_source":{"path":"images/caabbcc034c8f50c34beb0abbb5f0afbcec27563429ef71aa9ed50745b2b052e.jpg"},"content":"","chart_caption":[{"type":"text","content":"(d)"},{"type":"text","content":"Figure 7: Distribution of geographical probability factors for piracy incidents in various sea areas: (a) East Africa, (b) west Africa, (c) Arabian Sea, and (d) Strait of Malacca"}],"chart_footnote":[]} {"image_source":{"path":"images/b2666976c883cf0540140cbdde2bef3c6d5ec0966d5bea84abea5ee0dc55e175.jpg"},"content":"","chart_caption":[{"type":"text","content":"Figure 8: Reconstruction Error Results of Each Model Training"}],"chart_footnote":[]}
{"image_source":{"path":"images/4652c5c71961b6738d1901e85ab710bdcbcb4e4f78ccb593db7b86d654cbe9d9.jpg"},"content":"","chart_caption":[{"type":"text","content":"(a)"}],"chart_footnote":[]} {"image_source":{"path":"images/3bd4a21ac90e678f9db48c0cd1ff833f840dfddc0b617d9a832ff517ff17eae8.jpg"},"content":"","chart_caption":[{"type":"text","content":"(b)"}],"chart_footnote":[]}
{"image_source":{"path":"images/74a2459685c2290cf740ebbbea86e3a7b8d3c6519847af26d1aa3c0e26a8f8b4.jpg"},"content":"","chart_caption":[{"type":"text","content":"(c)"}],"chart_footnote":[]} {"image_source":{"path":"images/53be5861ddfd98ce5565f18c589e385afb45fcdc3d0f5f7223123c4cbdb7f2bf.jpg"},"content":"","chart_caption":[{"type":"text","content":"(d)"},{"type":"text","content":"Figure 9: Visualization results of hidden variable characteristics in each sea area: (a) East Africa, (b) west Africa, (c) Arabian Sea, and (d) Strait of Malacca"}],"chart_footnote":[]}
{"image_source":{"path":"images/4d305ef066f3cb1144fbfe53d43502e60ce4a18ac21ecaf9adbe1b150c27a2b0.jpg"},"content":"","chart_caption":[{"type":"text","content":"(a)"}],"chart_footnote":[]} {"image_source":{"path":"images/63f7c22c7d4d5215931ac1514d9c201244c81c01d082fe0e551e1c26faabf1ea.jpg"},"content":"","chart_caption":[{"type":"text","content":"(b)"}],"chart_footnote":[]}
{"image_source":{"path":"images/b431fa2a470b1fbf79bd97051fb16194814c37b6195d7715c03e4b1310e503b6.jpg"},"content":"","chart_caption":[{"type":"text","content":"(c)"}],"chart_footnote":[]} {"image_source":{"path":"images/5b4686214debe058ddb7f354f20d18086188ef3621c890736cd3bb06adaa0bcd.jpg"},"content":"","chart_caption":[{"type":"text","content":"(d)"},{"type":"text","content":"Figure 10: Analysis of evaluation results of different models in each sea area: (a) East Africa, (b) west Africa, (c) Arabian Sea, and (d) Strait of Malacca"}],"chart_footnote":[]}
{"image_source":{"path":"images/d70e520913e8a45cdf8ab9833f84a000c76255d899a7d275edcc0b5743284c1e.jpg"},"content":"","chart_caption":[{"type":"text","content":"(a)"}],"chart_footnote":[]} {"image_source":{"path":"images/4122dde166f0b008a42a8ea279b4ff85007245cccd6cc2780b67381159ac22d0.jpg"},"content":"","chart_caption":[{"type":"text","content":"(b)"}],"chart_footnote":[]}
{"image_source":{"path":"images/c505ee8f834d8f76b54189829fdbd833871c17a2bb5ea1bbaeb7ec88374acea5.jpg"},"content":"","chart_caption":[{"type":"text","content":"(c)"}],"chart_footnote":[]} {"image_source":{"path":"images/148c2275340cef3baaf82564953dbbca0fb496251b5338bfe52babc7fe0b0a3d.jpg"},"content":"","chart_caption":[{"type":"text","content":"(d)"},{"type":"text","content":"Figure 11: Simulation prediction results of comprehensive risk factor distribution in each sea area:(a) East Africa, (b) west Africa, (c) Arabian Sea, and (d) Strait of Malacca."}],"chart_footnote":[]}
Informed Consent Statement: Not applicable.
Conflicts of Interest: The authors declare no conflicts of interest.
Conflict of Interest
The authors declare no conflict of interest.
Ethical Approval
Not applicable
Data Availability
The datasets used in this study are openly available at [repository link] and the source code is available on GitHub at [GitHub link].
Funding
This work did not receive any external funding.
References
Cite this article
Related Research



Special Issue
Launch a focused special issue to highlight research, emerging trends, and expert insights in your academic field.
