




IntelliPaper
Abstract
Among the various types of loading to which foundations are subject, one can single out transversal (horizontal) forces. In general terms, we notice a lack of knowledge on the parameters used to design pile foundations with this type of load which will stress surface soil, considering that tropical soils are very often collapsible. Aiming to furnish input for future geotechnical projects, transversal loading tests were performed on a bored pile and a continuous flight auger (CFA) pile, both 12.0 m in length, and 0.40 m in diameter. The loading tests were performed with the soil in its natural condition and by pre-flooding the area, at the UNICAMP Experimental Soil Mechanics and Foundations Field I in Campinas/SP, Brazil, where the unsaturated soil is porous and classified as silty-sandy clay. The edometric tests indicated that is a collapsible soil in the surface bed up to 6.5m, and that the reduction in pre-collapse stress in the flooded condition is of the order of three times that of the natural condition. The load tests indicated that the maximum load in the natural condition is five times higher than in the flooded condition and that the value of n h (horizontal reaction coefficient) reduces substantially with the effect of increasing soil moisture content.
Explore Digital Article Text
I. INTRODUCTION
Horizontal load situations are frequent in foundations, but the technical community is largely unaware of the properties of collapsible tropical soils when it comes to designing piles subjected to this effort (Albuquerque et al., 2019). This paper aims to fill part of the existing gap on this subject by obtaining valid parameters for the tropical collapsible soil common to the city of Campinas and other regions of Brazil, by carrying out horizontal load tests on drilled piles in the soil in the natural and flooded condition. This type of loading, in which the loading are often variable and cyclical, is also combined in some situations with tensile and compressive stresses.
Simplified mathematical models (Miche, 1930; Matlock and Reese, 1961; Broms, 1964; Poulos, 1971; Poulos and Davis 1980;) were created for analysis of transversal loads, since the modeling problems is three-dimensional and conventional solutions for project developers are extremely complex. The best-known and most widely used theory for evaluating these effects is the "horizontal reaction theory of soil", where the factor represents the ratio between the reaction and displacement acting on the soil mass (Terzaghi, 1955; Palmer and Thompson, 1948; Davidson and Gill, 1963; Matlock and Reese, 1960, 1961; Davidson, 1970, Rosendo and Albuquerque, 2021; García et al, 2023). However, it is theoretically difficult to estimate this factor. However, it can be determined by load testing to obtain a reliable value for the transversal resistance of the construction soil.
The presence of collapsible soils is common in many regions of Brazil. Considering that these layers of collapsible soils can reach a depth of several meters and that the topsoil performs an important role in the behavior of transversely loaded piles, it is important to analyze the effect of this characteristic on the behavior of deep foundations. Analysis of the collapse potential is a very important factor to verify, as it most often dictates the behavior of unsaturated soils.
Collapsible soils are characterized by their high porosity and low degree of saturation and, through a process of increasing moisture content, suffer sudden and large additional deformations under constant total stresses.
Jennings and Knight (1957) provide a hypothesis for the phenomenon of collapse: the structure of a collapsible soil, when loaded at its natural moisture content, compresses smoothly, with no appreciable change in volume, resisting the compressive stresses between the grains, with no large relative movements between them. However, when this loaded soil gains moisture and reaches a critical moisture content, the bonds of resistance weaken and the structure collapses.
The grains or micro-aggregations are kept stable by the presence of suction (capillary and adsorption forces) and/or cementing agents (oxides, iron and/or aluminum hydroxides and carbonates). When these soils are moistened, these structure-stabilizing forces lose their intensity, allowing relative displacement between the particles, so that they begin to occupy the empty spaces in the soil structure (Dudley, 1970).
Thus, in order to provide parameters for the geotechnical environment, horizontal load tests were carried out at UNICAMP's Experimental Field of Soil Mechanics and Foundations I with natural and pre-flooded soil, with the aim of verifying the effect of collapsibility on the behavior of drilled piles (bored and CFA).
II. GEOTECHICAL AND GEOLOGICAL CHARACTERISTICS
This research was carried out at the Experimental Field for Soil Mechanics and Foundations I, located on the UNICAMP Campus (coordinates: -22.81937, -47.06047). Various in-situ and laboratory tests were carried out on disturbed and undisturbed samples. According to Carvalho et. al. (2000), the region's subsoil is formed by basic magmatites, with basic intrusive rocks from the Serra Geral Formation (diabase). They make up 98 km2 of the Campinas region, occupying 14% of the total area. The profile of the Experimental Field is made up of diabase soil, with a surface layer 6.5 m thick made up of high-porosity sandy-silty clay followed by a layer of sandy-clay silt up to 17 m. The water table level is found between 13 m and 16 m, depending on the time of year. It can be said that the first layer is made up of mature soil which has undergone an intense weathering process. The phenomenon of leaching may explain the porosity, due to the transport of fines to the deeper horizon. The second layer is formed by a young residual soil, which retains characteristics inherited from the original rock. Figure 1 shows the geotechnical profile obtained from the SPT and CPT tests and Table 2 shows the average parameters obtained from the laboratory tests.
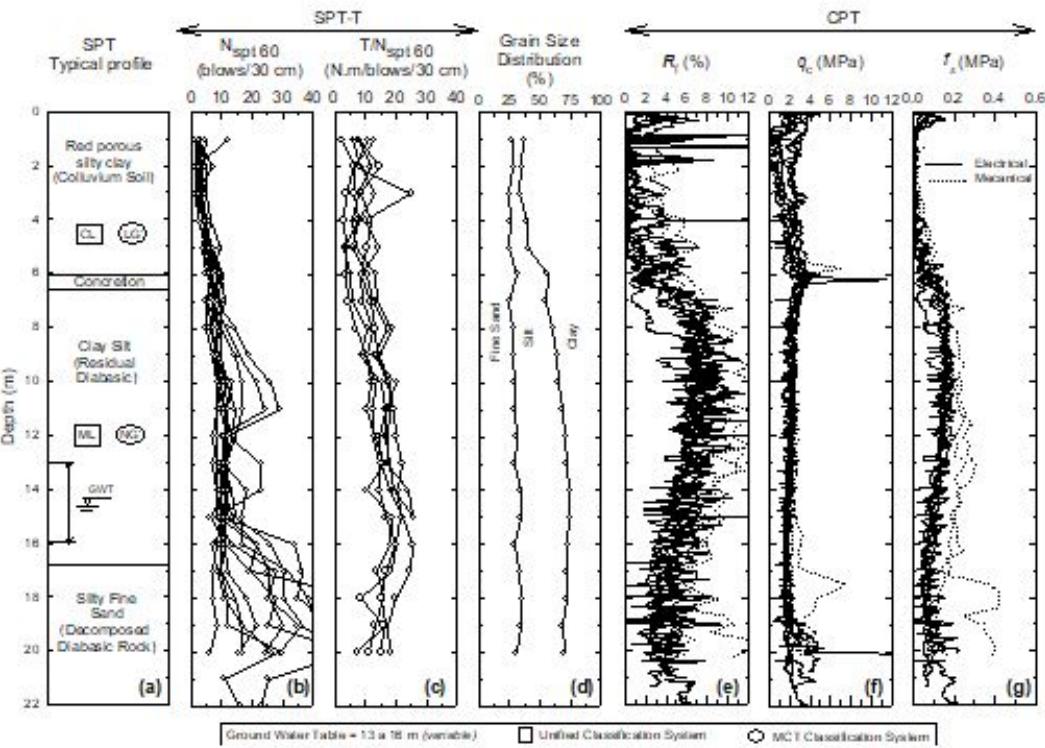 Figure 1: SPT-T and CPT (Electrical) Tests Results (Albuquerque et al, 2011)
Table 1: Average Physical Index Values w: natural soil moisture, e: initial void index, n: porosity, Sr: saturation degree,
| Layer | w (%) | e | n (%) | $S_r$ (%) |
| 0 → 6.5m | 23.8 | 1.72 | 63.1 | 41.4 |
| 6.5 → 14m | 30.3 | 1.52 | 54.6 | 59.6 |
In order to identify the potential for collapse, conventional and simple edometric tests were carried out, without suction control, in accordance with the procedures adopted from ASTM D 2435-04. In order to define the collapsibility of the surface layer, samples were taken at depths between 1.5 m and 6.5 m to be subjected to oedometer tests with and without pre-flooding. The loading stress values adopted were 13 kPa, 25 kPa, 50 kPa, 100 kPa, 200 kPa, 400 kPa, 800 kPa and 1600 kPa. Test specimens were molded from samples collected at depths of 1.5 m, 2.5 m, 4.5 m and 5.5 m.
The criterion adopted to quantify the collapse index ( ) was that of Vargas (1978), according to expression (1). Thee and the soil is considered collapsible when its value is greater than 2%.
where:
: subsidence index;
: void ratio after flooding the test specimen;
: void ratio before flooding the test specimen.
Due to the heterogeneity of the samples, represented by the different initial void ratio values (Table 2).
Table 2: Values of the Void Index
| Sample Depth | ||||
| 1.5 m | 2.5 m | 4.5 m | 5.5 m | |
| $e_o$ | 2.14 | 1.74 | 1.72 | 1.66 |
The results of the tests in saturated and unsaturated conditions are shown in Table 3. Table 3: Pre-Consolidation Stress Values (Natural and Flooded)
| Depth (m) | Pre-Consolidation Stress | $\sigma_{av'flooded} / \sigma_{av'natural}$ | |
| $\sigma_{av}(kPa)$ Flooded | $\sigma_{av}(kPa)$ Natural | ||
| 1.5 | 18 | 63 | 0.29 |
| 2.5 | 30 | 110 | 0.27 |
| 4.5 | 110 | 230 | 0.48 |
| 5.5 | 105 | 300 | 0.35 |
Table 3 shows a reduction in the pre-consolidation stress in the flooded condition, with the reduction varying from 1/3 to 1/2 of the value of the stress in the natural condition. This behavior is related to the influence of the soil's initial moisture conditions, which in turn are closely linked to the suction values. When moistened, these soils lose the resistance between grains or micro-aggregates given by matric suction, as well as having their bonds due to cementation weakened by the increase in moisture and, jointly, with the application and magnitude of the load.
Figure 2 shows that the samples presented collapsible behavior, with collapse index values greater than 2% at all flood loads (except for sample 4.5 m flooded at load 50 kPa). The values practically increase with the increase in loading, but tend to stabilize as the depth increases.
{"image_source":{"path":"images/220db517b3e6d934a6daffa047cd7913767f1adc40a443f90f2369edba8edc03.jpg"},"content":"","chart_caption":[{"type":"text","content":"Figure 2: Collapse Index vs Logo"}],"chart_footnote":[]}
The values in Tables 2 and 3 and the collapse index ( ), as a function of flood stress, shown in Figure 2, the relationship between the values of pre-consolidation stress (virtual or yield) and is striking. In other words, as the values of this stress increase, the collapse index values decrease and tend to stabilize.
Overall, the information obtained from CPTu and SPT-T tests, regarding soil type and resistance parameters in unsaturated conditions, allows to state that the soil in the experimental field is of low resistance and high collapsibility.
III. PILE CONSTRUCTION AND LOAD TESTS
The study used a bored pile with a diameter of 0.40 m and a depth of 12 m, and a continuous flight auger (CFA) pile with the same dimensions.
The longitudinal reinforcement of the piles consisted of 16.0mm ( 8 cm ), 6 m long and stirrups of , every 20 cm (CA-50 steel).
For the bored piles, the concrete fck (slump 70mm) was around 15 MPa, using gravel and sand. The concrete used in the continuous auger pile (pumpable, slump 240mm) consumed cement at a rate of 400 kg/m and aggregates (sand and gravel). The CFA pile was drilled using the MAIT HR-200 drill rig, which can drill diameters of up to 1200 mm and depths of up to
32m. The piles followed a predefined alignment and the spacing between them was 2.4m (6φ).
The following elements were used to carry out the load tests: a 100 kN hydraulic jack, a 100 kN load cell, two deflectometers with a precision of 0.01 mm and a kneecap. All these elements were hollow and to prevent the system from becoming unstable during the tests, a steel bar was passed between them and fitted into two recesses made in the piles (Figures 3 and 4).
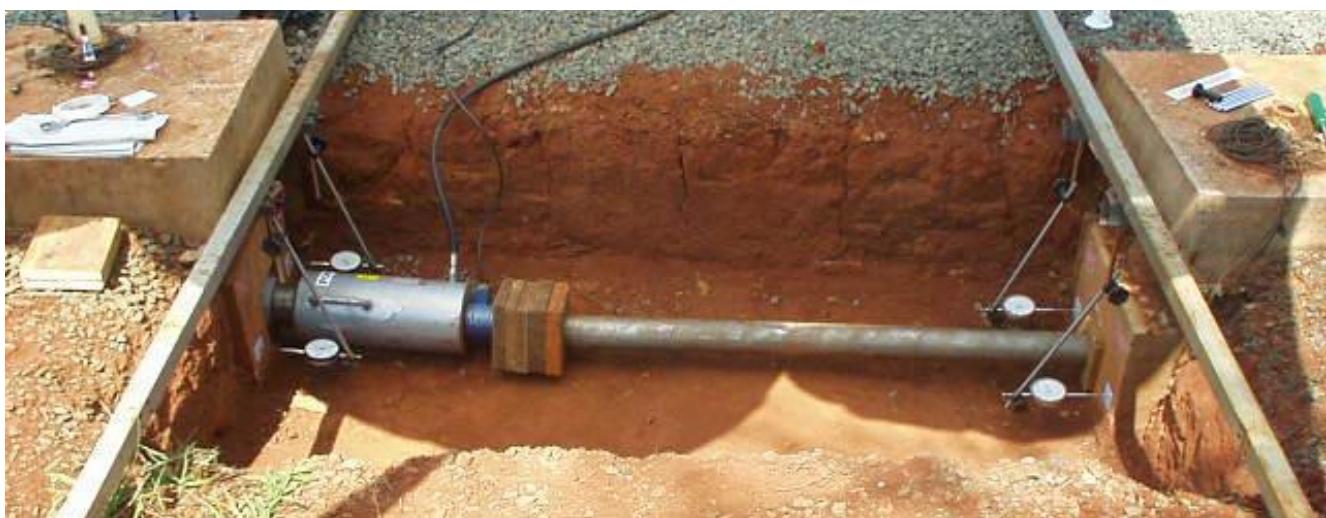
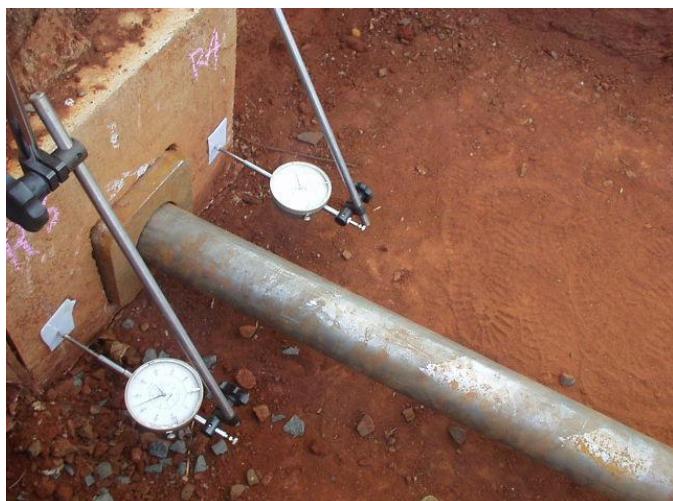 Figure 3: View of the Load Test Assembly Figure 4: Assembly Detail
The load tests were of the quick maintained load (QML), following the requirements of NBR 12.131/1991. The load increments were 3 kN for the load test with natural soil and 2 kN for the pre-flooded situation. Unloading was carried out at predetermined intervals. Two loading and unloading cycles were carried out.
VI. RESULTS AND ANALYZES
The results obtained from the load tests are presented below, two (first and second) with the soil in its natural condition and the third after pre-flooding the ground for a period of 72 hours. Table 4 shows a summary of the results of the load tests carried out.
Table 4: Load and Displacement Maximum Values
| Pile | Condition | Load (kN) | Displacement (mm) |
| Bored | Natural – 1st | 54.0 | 7.82 |
| Natural – 2nd | 67.5 | 21.20 | |
| Flooded | 13.0 | 13.66 | |
| CFA | Natural – 1st | 54.5 | 11.02 |
| Natural – 2nd | 67.5 | 33.76 | |
| Flooded | 13.0 | 30,26 |
The figures 5a and 5b show the load vs. displacement curves, with the first and second cycles and with pre-flooding of the ground. Using the methodology proposed by Matlock and Reese (1961), figures 6a and 6b show the horizontal reaction curves of the soil ( ) vs. displacement of the pile on the ground surface ( ), obtained from the results of the tests carried out with the soil in its natural and flooded condition, assuming that the horizontal reaction modulus of the soil varies linearly with depth. For the case of the piles under analysis, was defined. for the 6.0 to 12.0mm range (Table 4).
{"image_source":{"path":"images/4f61737e45849309d9f63a3d912d470c6fa79e398b76fc0b746dac35682c285e.jpg"},"content":"","chart_caption":[{"type":"text","content":"a) CFA Pile"}],"chart_footnote":[]} {"image_source":{"path":"images/2ae39da1f221cc3c0d8025d5ef26f3b18c87f97cb997f42993cca6fd2dac4b8b.jpg"},"content":"","chart_caption":[{"type":"text","content":"b) Bored Pile"},{"type":"text","content":"Figure 5: Load vs. Displacement Curve"}],"chart_footnote":[{"type":"text","content":"capacity of the soil of 85% in the third loading, with the soil pre-flooded."}]}
The Figures 5a and 5b show that the pre-flooding of the soil caused a pronounced increase in the displacements for the same load applied in the tests with natural soil. The results proved that the pre-flooding caused a reduction of the applied load by 2.5 to 3.0 times when compared to the natural ultimate load. These results demonstrate the intensity of the effect of the variation of the soil moisture on the horizontal displacement characteristics of the pile.
In the third loading, with the soil already flooded, there is a large loss of bearing capacity of the pile, showing the effect of the collapsible characteristic of the soil in this type of loading. For the same value of maximum displacement as the second loading, there is a reduction in the bearing {"image_source":{"path":"images/c4e19d1c8f1b412f0e5e27b38c951ee92f6577aa68e3afcdf3a9eb744d8da539.jpg"},"content":"","chart_caption":[{"type":"text","content":"a) Natural"}],"chart_footnote":[]}
{"image_source":{"path":"images/d5f8e17edaa2683b53a00af2dbbe55647093318a0b55821533df0c459b0da046.jpg"},"content":"","chart_caption":[{"type":"text","content":"b) Flooded"},{"type":"text","content":"Figure 6: "},{"type":"equationinline","content":"n\{h}"},{"type":"text","content":" vs "},{"type":"equationinline","content":"y\{o}"},{"type":"text","content":" Curves– Natural and Flooded"}],"chart_footnote":[]}
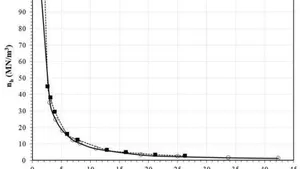
It can be seen in Figure 6a that the behavior of the vs curves were very similar for the two types of pile, showing that the soil reaction did not vary, even though they were two different types of pile construction processes. The horizontal reaction coefficient (natural moisture) for the bored pile was 11.8 MN/m and for the CFA pile 10.3MN/m . Note that the values in the pre-flooded situation practically do not vary, which demonstrates a resistance loss of the soil from the beginning of loading (Figure 6b).
The values of the horizontal soil reaction coefficient , obtained for displacements of 6 to 12mm, are shown in Table 5.
Table 5: values
| Pile | Condition | $n_h (MN/m^3)$ | Condition | $n_h (MN/m^3)$ |
| Bored | Natural | 11.8 | Flooded | 0.58 |
| CFA | Natural | 10.3 | Flooded | 0.24 |
The values for the horizontal reaction coefficients obtained in the literature for different types of deep foundations built on soil with similar behavior to the one from the present study (under natural and pre-flooded conditions) (Kassouf, Carvalho and Albuquerque, 2016; Barbosa et al., 2023)
IIV. CONCLUSIONS
-
The oedometer tests showed that the deformations in the samples after being subjected to the tests were characterized, firstly, by the closure of the pores, and then by the sliding of the microaggregates (lumps), in this case, under the tension of 800kPa.
-
Since the first meter of soil has a strong influence on horizontal loading, proper geotechnical characterization in terms of porosity, resistance and collapsibility is important. Laboratory and field tests indicate that soils are highly porous, low resistance collapsible soils, making it possible to predict the large effects of low values and changes in soil moisture content.
-
It has been observed that loads on pre-flooded soils are on average three times lower than soils with natural moisture content until a certain level of displacement is reached. For the soil horizontal reaction coefficient, the pre-flooded values are about 50% lower than those for the natural moisture content of the soil.
-
The average horizontal reaction coefficient obtained for soils at natural moisture content is , which is higher compared to the literature for high porosity soils, where the recommended value is , emphasizing the importance of its determination for each soil type, to avoid generalizations. In the flooded condition, the soil horizontal reaction coefficient showed an average reduction of approximately 96% when compared to the natural condition.
-
The results indicate that, after loading, there is little recovery of the displacement occurred by the pile during unloading. In a second loading, until the maximum load of the first loading is reached, the pile suffers little displacement. From this maximum load onwards, in the second loading, the curve takes on the continuity of the curve from the first loading, as can be seen in figure 5.
ACKNOWLEDGMENTS
The authors gratefully acknowledge to the support of the Universidade Estadual de Campinas (UNICAMP).
Conflict of Interest
The authors declare no conflict of interest.
Ethical Approval
Not applicable
Data Availability
The datasets used in this study are openly available at [repository link] and the source code is available on GitHub at [GitHub link].
Funding
This work did not receive any external funding.
References
Cite this article
Related Research


Special Issue
Launch a focused special issue to highlight research, emerging trends, and expert insights in your academic field.
