



IntelliPaper
Abstract
A simple, precise, accurate, and economical UV visible spectrophotometric method has been developed for estimation of Perindopril erbumine & Indapamide drug by AUC method. Quantitative determination of the drug was performed at wavelength range 208-214 nm and 239-244 nm for Perindopril erbumine & Indapamide respectively. The linearity was established over the concentration range of 10-50 µg/ml for Perindopril erbumine and 1-5 µg/ml for Indapamide with correlation coefficient value of 0.999 for both the drugs. Precision studies showed that % relative standard deviation was within range of acceptable limits. The recovery study was found to be within range of 99-101%. The proposed method has been validated as per ICH guidelines.
Explore Digital Article Text
I. INTRODUCTION
Perindopril erbumine (2S,3aS,7aS)-1- hexahydro-2-indoline carboxylic acid 1-ethyl ester, is one of the non-peptide Angiotensin II receptor antagonists, and is used for the treatment of patients with hypertension and symptomatic heart failure . Indapamide3-(aminosulfonyl)-4-chloro-N-(2,3-di hidro-2-methyl-1H-indol-1-yl) benzamide, is a diuretic of the class of Benzothiadiazines. The combined oral administration of perindopril with indapamide has been found to be more effective than either of the drugs alone in the treatment of hyperten-sion . Structures of Perindopril erbumine and Indapamide are shown in Fig. 1,2
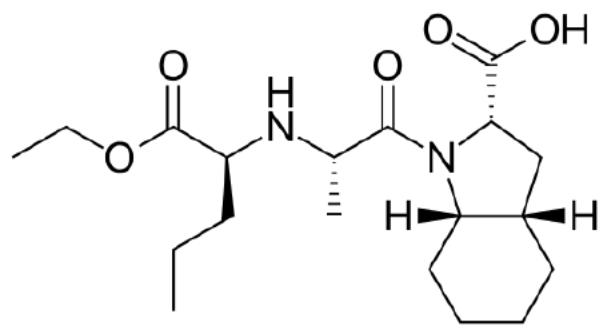 Fig 1: Chemical structure of Perindopril
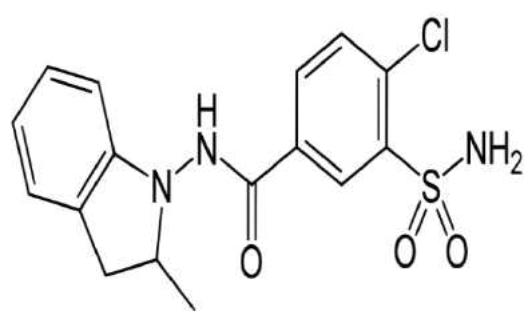 Fig 2: Chemical structure of Indapamide Erbumine
II MATERIALS AND METHODS
2.1 Apparatus and instrumentation
A shimadzu 1800 UV/VIS double beam spectrophotometer with 1cm matched quartz cells was used for all spectral measurements. Single Pan Electronic balance (CONTECH, CA 223, India) was used for weighing purpose. Sonication of the solutions was carried out using an Ultrasonic Cleaning Bath (Spectra lab UCB 40, India). Calibrated volumetric glassware (Borosil®) was used for the validation study.
2.2 Materials
Reference standard of Perindopril erbumine & Indapamide API was supplied as gift sample by Marksan Pharmaceutical Ltd., Verna, Goa. Tablet sample with label claim Perindopril Erbumine 4mg and Indapamide 1.25mg per tablet (coversyl plus tablet) were purchased from local market Mumbai.
2.3 Method development
2.3.1 Preparation of standard solution
The standard stock solution of Perindopril erbumine & Indapamide was prepared by accurately weighing & transferring, 10 mg of API to 100 ml of volumetric flask. The drug was dissolved with sonication in 50 ml of methanol and volume was made up to the mark by using methanol. Then take from that 1ml and add to 10ml volumetric flask and make up with to methanol get final standard stock solution (10 g/ml) and take 0.1ml to get 1 g/ml and were further diluted with methanol to obtain 10-50 g/ml Perindopril erbumine & 1-5 g/ml Indapamide solutions.
2.3.2 Determination of Wavelength Range
For the selection of analytical wavelength range for area under curve method, 10 g/ml solution of Perindopril erbumine & Indapamide were scanned in the spectrum mode from 400 nm to 200 nm against methanol as blank.
Wavelength range were selected around wavelength maxima 210 nm and 241 nm for Perindopril erbumine & Indapamide respectively. Different working standards were prepared between 10-50 g/ml and 1-5 g/ml for Perindopril erbumine & Indapamide respectively. Various wavelength range were tried and final wavelength range between 208-214 nm for Perindopril erbumine and 239-244nm for Indapamide were selected on the basis of linear relationship between area and corresponding concentration (Figure 3,4,5).
{"image_source":{"path":"images/974b1d2cf5a8cc4021a1c70e646331d85a636da336d87fd2c67031ddf1045f45.jpg"},"content":"","chart_caption":[],"chart_footnote":[]} {"image_source":{"path":"images/e309f9757209ab6e8d650b6c4bd893968fe97e4eaeb3fb52b7d309b468de8404.jpg"},"content":"","chart_caption":[{"type":"text","content":"Fig. 3: UV AUC spectrum of Perindopril erbumine (50 "},{"type":"equation_inline","content":"\mu"},{"type":"text","content":" g/ml)"}],"chart_footnote":[]}
{"image_source":{"path":"images/3816fd4dbd04ef107daaa5500ac65437db7b63d2b7201ff021d16c7e2c03b0cc.jpg"},"content":"","chart_caption":[{"type":"text","content":"Fig. 4: UV AUC spectrum of Indapamide (5 "},{"type":"equation_inline","content":"\mu"},{"type":"text","content":" g/ml)"},{"type":"text","content":"Fig. 5: UV AUC spectrum of Perindopril Erbumine & Indapamide Tablet"}],"chart_footnote":[]}
2.4 Area under curve (Area calculation)
Area under curve method involves the calculation of integrated value of absorbance with respect to the wavelength between two selected wavelengths such as and representing start and end point of curve region. The area under curve between and was calculated using UV probe software. In this study area were integrated between wavelength ranges from 208 to 212 nm and 239-244 nm for Perindopril Erbumine & Indapamide respectively (Fig. 6,7).
Where, is area of portion bounded by curve data and a straight line connecting the start and end point, is the area of portion bounded by a straight line connecting the start and end point on curve data and horizontal axis, and are wavelength range start and end point of curve region
{"image_source":{"path":"images/dc145976deb542212441a29e127927b18234582f49aad393b395c494f549d889.jpg"},"content":"","chart_caption":[],"chart_footnote":[]} {"image_source":{"path":"images/98f9fca5ab3f97458940bd544a0e38528ef117dd8f892a5c1e5ce6b50f7117d1.jpg"},"content":"","chart_caption":[{"type":"text","content":"Fig. 6: Overlay of Perindopril Erbumine spectra at diff. Concentration"},{"type":"text","content":"Fig. 7: Overlay of Indapamide spectra at diff. Concentration"}],"chart_footnote":[]}
2.5 Calibration curve for Perindopril erbumine & Indapamide
The dilutions were made and scanned from 400 to 200 nm and area under curve (AUC) values {"image_source":{"path":"images/c5e396ce84a4ce30b76e3eb432ebdd673962bc53ce348c66927d5adee6ea1102.jpg"},"content":"","chart_caption":[{"type":"text","content":"Fig. 8: Linearity of Perindopril Erbumine"}],"chart_footnote":[]}
2.6 Assay of tablet formulation
Twenty tablets each containing 4mg of Perindopril erbumine & 1.25mg of Indapamide were weighed, crushed to powder and average weight was calculated. Powder equivalent to 10 were integrated in the range of 208-214 nm for Perindopril Erbumine and 239-244nm for Indapamide. The calibration curve were plotted between areas under curve values against concentration (Fig. 8,9).
{"image_source":{"path":"images/c5510418d494e0fce4b2ab28bdbbd7bb73f9d6da61995448059d33228a3439f7.jpg"},"content":"","chart_caption":[{"type":"text","content":"Fig. 9: Linearity of Indapamide"}],"chart_footnote":[]} mg of Indapamide was transferred in 100 ml of volumetric flask and further diluted to obtain 5 g/mL solution with water, subjected for UV analysis using methanol as blank. This procedure was repeated three times (Table 1)
Table 1: Assay of tablet dosage form ±SD = Standard Deviation,% RSD =% Relative Standard Deviation
| Sr. No. | Label claim (mg) | Drug content (%) | ± SD | %RSD | |
| Perindopril Erbumine | Indapa mide | ||||
| 1 | 4 | 1.25 | 100.01 | ||
| 2 | 4 | 1.25 | 98.21 | 0.7584 | 0.7045 |
| 3 | 4 | 1.25 | 99.75 | ||
2.8 Method validation .
The above method was validated for various parameters such as Accuracy, Linearity, Precision, Limit of detection (LOD) and Limit of Quantitation (LOQ) according to ICH guideline.
2.9 Accuracy
determinations at each level were performed and% RSD was calculated for each level.
The accuracy for the analytical method was evaluated at three different levels and results were obtained in terms of percent recovery. Three
Table 2: Accuracy results for Perindopril erbumine & Indapamide
| Level of Recovery% Amount | Amount Present (μg/ml) | % Recovery | % RSD | |
| 50% | Perindopril Erbumine | 10 | 101.4 | 0.7548 |
| Indapamide | 5 | 98.86 | 0.5514 | |
| 100% | Perindopril Erbumine | 10 | 99.38 | 1.0125 |
| Indapamide | 5 | 99.64 | 0.8954 | |
| 150% | Perindopril Erbumine | 10 | 99.50 | 0.4956 |
| Indapamide | 5 | 99.83 | 0.3254 | |
2.10 Precision
The precision of an analytical procedure expresses the closeness of an agreement (degree of scatter) between a series of measurements obtained from multiple sampling of the same homogeneous sample under the prescribed conditions intra-day precision was studied by integrating area of standard solution of concentration at six independent series in the same day. Inter-day precision studies were performed by integrating area of standard solution of concentration on three consequent days. The%RSD Was calculated.
Table 3: Precision results for Perindopril erbumine & Indapamide
| Parameter | Intra day | Inter-day | ||
| Perindopril erbumine | Indapamide | Perindopril erbumine | Indapamide | |
| Sample sol conc (ug/ml) | 30 | 03 | 30 | 03 |
| AUC (mean) | 0.2733 | 0.1351 | 0.2758 | 0.1356 |
| %RSD | 1.849669 | 0.448046 | 1.607084 | 1.17214 |
2.11 Limit of Detection and Limit of Quantification
The Limit of Detection (LOD) is the smallest concentration of the analyte that gives the measurable response. LOD was calculated using the following formula
The Limit of Quantification (LOQ) is the smallest concentration of the analyte, which gives response that can be accurately quantified. LOQ was calculated using the following formula
Where, is standard deviation of the response and
S is the slope of the calibration curve
LOD of Perindopril erbumine & Indapamide were found to be 1.991272μg/ml & 0.090534μg/ml respectively and LOQ of Perindopril erbumine & Indapamide were found to be 6.034157 g/ml & 0.274643 g/ml respectively.
Three sets of known concentrations were prepared and scanned. By using these spectras, regression equations were obtained. By taking average of slopes and standard deviation of y-intercept, LOD and LOQ were calculated.
III. RESULTS AND DISCUSSION
The UV visible spectroscopic method for the Perindopril erbumine & Indapamide by area under curve was found to be simple, accurate, economical and reproducible. The drug concentrations were found to be linear in the range of 10-50 g/ml & 1-5ug/ml and the correlation coefficient value of 0.999 & 0.999 of
Perindopril erbumine & Indapamide respectively, indicates that developed method was linear. The accuracy of the method was assessed by recovery studies at three different levels i.e. 50%, 100%, 150%. The values of standard deviation were satisfactory and the recovery studies were close to 100%. The% RSD value is ≤ 2 indicates the accuracy of the method. The Limit of Detection and Limit of Quantitation values were found to be within limit. The result of the analysis for pharmaceutical formulation by the developed method was consistent with the label claim, highly reproducible and reliable. The method can be used for routine quality control analysis of Perindopril erbumine & Indapamide in bulk and pharmaceutical formulations.
IV. CONCLUSION
The UV spectroscopic AUC method for the analysis of Perindopril erbumine & Indapamide was found to be simple, precise, and accurate, can be used for assay of bulk drug and pharmaceutical dosage formulations.
ACKNOWLEDGEMENT
The authors sincerely thanks to Sahyadri College of Pharmacy, Methwade, Sangola, Solapur, Maharashtra, India for providing experimental facilities to carry out this work.
Conflict of Interest
The authors declare no conflict of interest.
Ethical Approval
Not applicable
Data Availability
The datasets used in this study are openly available at [repository link] and the source code is available on GitHub at [GitHub link].
Funding
This work did not receive any external funding.
References
Cite this article
Related Research




Special Issue
Launch a focused special issue to highlight research, emerging trends, and expert insights in your academic field.
