



IntelliPaper
Abstract
In this study, an attempt is made to understand the performance of dimple textured uncoated carbide cutting tool during turning of AISI H11 hot die steel in dry environment. Response surface methodology (RSM) was adopted to evaluate the effect of turning process parameters (cutting speed 80-120 m/min, feed rate 0.16-0.32 mm/rev and depth of cut 0.2 -0.5 mm) on tool flank wear (VB) and surface roughness (Ra). The results of the experimental runs are examined using ANOVA and variable interaction plots. Flank wear initially less at lower cutting speed of 80 m/min but as the speed increases wear on flank increases with same trends of feed rate. At low feed rate of 0.16 mm/rev surface roughness is low at all cutting speeds, whereas with increase in feed rate deteriorate the surface quality. Similarly, with 0.2 mm depth of cut Ra is 2.23 µm and with increase in depth of cut value Ra approaches 2.98 µm. Optimization and modelling was conducted to minimize wear and roughness using 5% error. Confirmation of the test runs shows 3.84% and 4.47% error between predicted and experimental values of VB and Ra.
Explore Digital Article Text
I. INTRODUCTION
Developments in the metal cutting industry are driven by the manufacturer's need to expand the performance of parts used for various applications by maintaining the environmental legislation.
Extreme heat develops at cutting edge while machining "difficult-to-cut" materials, which is carried out by workpiece, tool, and coolant/lubricants. Traditionally, to dissipate heat large quantity of coolants (flooded coolants) is used to minimize friction and heat, which create difficulties in procurement, dumping, storage, and preservation. However, some disadvantages like cost, environmental impact, safety, and health hazards limit the use of flood cooling which compels industries to minimize or eliminate its use and encourage the development of new cooling/lubricating options. "Dry machining" is oldest, most environmentally friendly options, but absence of cutting fluid leads to heat generation, adhesion, poor chip evacuation, and increase friction at the cutting zone. Dry machining is found to lead to poor results with rough surface on products, whereas flood cooling leads to economic, environmental, and health challenges.
Worldwide manufacturers are actively seeking cost-effective alternatives to produce satisfactory quality components which are accepted globally.
To promote the metal cutting industry and creating new opportunities, technology plays an important role. Turning at one time is based on the skills of the operator and still important, so to be competitive it is necessary to adopt and implement modern and cost-efficient manufacturing techniques (Soroka, 2003).
Materials used extensively in aerospace, food, and the nuclear industry have great-strength and wear-resistance are "difficult-to-machine" due to thermo-physical stresses at the edge of cutting tool (Sharma, Dogra and Suri, 2008). The degradation of the surface finish is closely associated with wear growth. Different researchers working on enhancing tool life during conventional turning; otherwise, tool failure refers to the damage that is so severe to remove material from the workpiece due to its vulnerability to changes in cutting conditions (Sharma, Dogra and Suri, 2009). Tool-workpiece friction and heat generation at cutting area are prevalent challenges in turning, reducing life of tool and compromising the quality of surface during turning operation.
Due to unusual properties of "difficult-to-machine" materials, such as low conductivity to heat, great-strength at eminent temperatures, and wear-resistance and corrosion generate heat and produce negative effects (Zhang, Li and Wang, 2012). Enormous generation of heat (indicated in Fig. 1.1) at the cutting zone while turning "difficult-to-cut" materials, is due to plastic deformation because of chip formation and friction between the tool-work-piece and tool-chip. Dissipation of heat is dependent on geometry of tool, its heat conductivity, and cooling techniques (Shokrani, Dhokia and Newman, 2012).
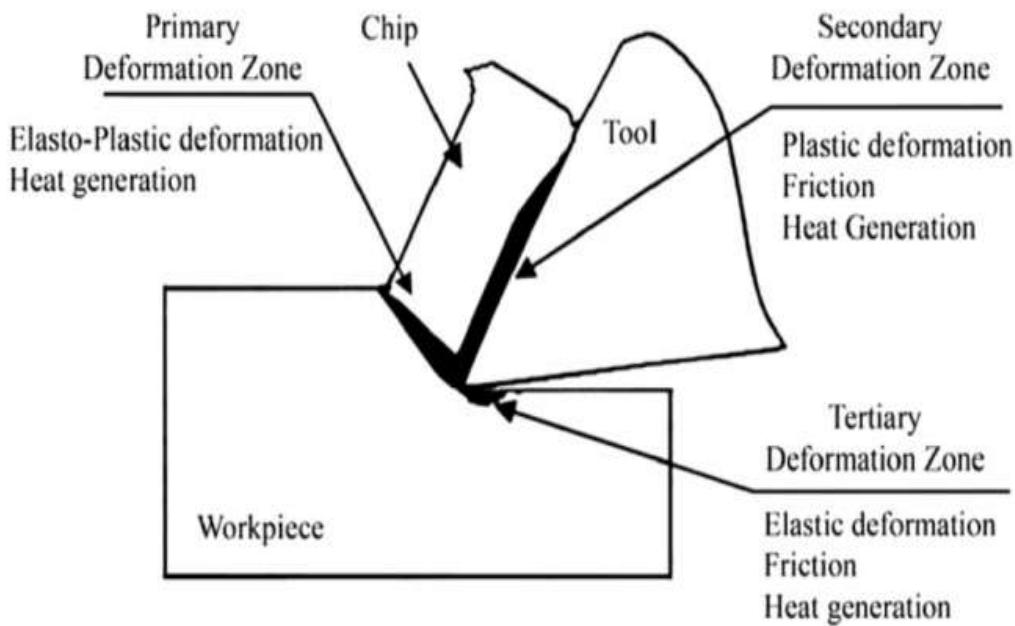
Figure 1.1: Heat generation at cutting zone (Abukhshim, Mativenga and Sheikh, 2006)
Surface topography moderation of cutting tools using textures has been an innovative/ecological method, which helps to improve tribological conditions of sliding surfaces relative to each other, and the addition of solid lubricant in the pockets generated on the tool makes dry machining environmental friendly (Sharma and Pandey, 2016).
Dry machining with surface texturing tends to be the most suitable solution for sustainable machining. But for hard materials, high-temperature gradient at cutting zone necessitates the use of traditional flood cooling, which makes the process harmful for ecological considerations (Mosarof et al., 2016).
1.1 Dry Machining
Dry machining is an eco-friendly approach and it will be mandatory for the industries in the coming future to enforce regulations of environment sustainability for occupational safety and health standards (Klocke, F., & Eisenblätter, 1997).
Dry turning/machining offers pollution-free atmosphere (or water); no swarf residues that are measured by decreased disposal and cleaning costs; no health hazards; no skin and allergy (Sreejith and Ngoi, 2000). Dry machining helps to create an environmentally friendly image, reduce costs, and improve work satisfaction in workers (Figure 1.2).
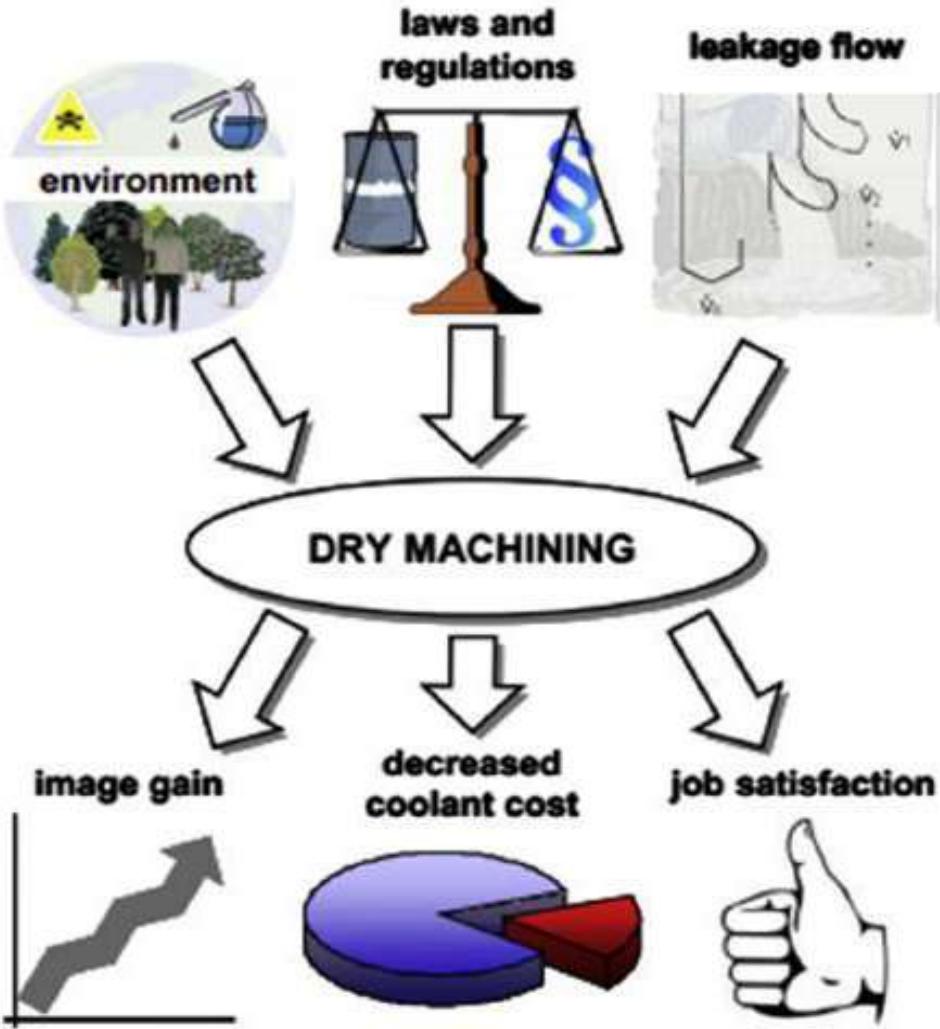
Figure 1.2: Dry Machining Advantages (Ghosh and Rao, 2015)
The major issues during dry machining include overheating, enhanced abrasion, diffusion and oxidation of the tool material. However, a significant amount of heat inhibits near tolerances and its surface is subjected to metallurgical damage (Debnath, Reddy and Yi, 2014).
Dry hard turning of difficult-to-machine materials would not be feasible without the selection of appropriate tool material. Costly, CBN (cubic boron nitride) tools are widely applied to machine high hardness and thermal conductivity materials, since these are second toughest tool material after diamond. Various merits or demerits of dry hard turning are discussed in Table 1.1. The cost of the CBN tool is high, but tool wear is low in comparison to other tool materials (Kundrák et al., 2006). Cemented carbide tools have been developed over time and still to be primarily used to machine Ni-alloys, particularly Inconel-718.
Conversely, with the increase demand for high MRR and higher surface quality, machining at high speed was adopted and usage of cemented carbide tools became more complex (Dudzinski et al., 2004). For dry turning of Inconel-718, cutting tool material must meet the following requirements (Dudzinski et al., 2004):
1. Adequate stability at high temperatures
2. Superior thermal shock resistance
3. Superior strength and toughness
4. High hot hardness
5. Excellent resistance to wear
Table 1.1: Merits and Demerits of Dry Hard Turning
| Merits | Demerits |
| Non-pollution of the environment or water, thereby reducing the health risk, especially to the skin and respiratory systemNo lubricant stain on machined parts that reduces or avoids the cost of cleaning and energy consumption.No lubricant residue on extracted chips reduces the cost of disposal and energy consumption associated | Overheating of cutting toolHigh friction due to softening of tool base material.Rapid tool wear due to abrasion, diffusion, and oxidation.Damage workpiece surface due to a large amount of heat accumulated in cutting area.Formation of chip, deteriorate surface quality |
1.2 Textures Engraved on Tool Surface
"Surface structuring or surface texturing on the cutting tool is an innovative strategy for sustainable metal cutting. Surface texturing is a term that refers to the process of altering the topography of a surface to enhance tribological efficiency of contact surfaces"(Fatima and Mativenga, 2013; Ghosh and Rao, 2015). In the last decade, textures on surface has been the feasible option in surface engineering, leading to considerable increments in load carrying capacity, wear, strength, friction coefficient, etc. of tribo-mechanical components (Etsion, 2005). The surface texture reduces the friction coefficient, cutting forces and sticking between the tool-chip interface (Jianxin et al., 2012). Different researchers have graved various textures for this reason on tool inserts (Ghosh and Rao, 2015).
Metal cutting processes are now carried out at high speeds to ensure optimum efficiency, thanks to the advancement of modern engineering technologies. In the era of automation, long continuous chips produced at high cutting rates have become a challenge for industry. Textures on tool surface helps to control contact because their length of contact is shorter than conventional contact length of chip (Chao and Trigger, 1959).
Surface textures are generated by a variety of advanced manufacturing techniques, which include; micro-wire cut "electron discharge machining" (EDM), "Focused ion beam" (FIB) machining (Tseng, 2004), and photolithography, "reactive ion etching" method (RIE), laser technology, and so forth (Pettersson and Jacobson, 2003). Texture geometries such as micro-holes, linear, circular, square, and wavy indentations, were developed on tool surfaces and its application improves the cutting tool tribological performance (Etsion, 2005).
Nowadays, the tendency is toward high-quality, cheap, and small-batch sizes. To compete with countries having structure of low-wage in manufacturing industry, it is vital to innovate techniques that contribute to the improvement of the manufacturing sector's level, with a beginning to witness technical improvements in the field of hard turning (Soroka, 2003). Generally, when the hardness of material is more than 45 HRC, then it is called hard turning (Pavel et al., no date). While it may not remove the requirement of grinding, it may relieve the load on costly grinders for the specified application (König, Berktold and Koch, 1993; Chou, Evans and Barash, 2003).
During cutting of metal, there is maximum conversion of energy into heat. Friction inside tool-chip interface and in the workpiece-tool interaction zone generates extra heat at cutting region. The temperature due to friction and plastic deformation at the cutting zone is reached up to C. During machining 10-20% heat is taken up by tool and rest of 80-90% is transferred to chip (Budak et al., 2010). Heating the tool and workpiece is excessive and also raises their temperature and distortion in the cutting tool (Motorcu et al., 2016).
To overcome these problems of dry machining, sustainable techniques are developed like; a new class of tools, texturing on rake surface of tool, improved tool geometry, and coatings are applied on tools. From all of the above, surface texturing is an environment-friendly method for tribological characteristics improvement.
"Tribology is the study of friction, wear and lubrication of the surfaces in relative motion" (Ian Hutchings, 2017). Lubrication/Cooling capabilities and tribological properties are improved as observed from literature with the help of micro-scale surface textures on cutting tools which also helps to reduce adhesion (Pettersson and Jacobson, 2003; Wakuda et al., 2003; Etsion, 2005; Kovalchenko et al., 2005).
Therefore, cutting tool surface texturing is a method that improves friction and lubrication during the interaction of tool and chip. Surface texture minimizes the friction by shortening the duration of contact of chip with tool (Enomoto and Sugihara, 2010; Chang et al., 2011; Enomotoa and Sugihara, 2011). When texture surface chip-tool friction is reduced and the wear debris that forms from this is confined in the cavity owing to textures on the surface (Blatter et al., 1999; Costa and Hutchings, 2009). During the turning of materials hard to machine, a comparative examination of textured and conventional cutting tools was done. Textured tools utilized in the turning process, helps to reduce friction, heat generation, and thus wear, which helps to improve energy efficiency, product quality, and tool life (Ling et al., 2013)
The textures orientation at the cutting edge has been demonstrated to increase or decrease cutting performance, several studies have examined this in terms of sliding contacts. The tribological performance of parallel direction, perpendicular direction, and at a angle to the sliding direction was tested (Pettersson and Jacobson, 2004); and found that orientation modification helps pressure accumulation due to textures; which disrupt surface roughness.
It is observed that perpendicular texture displayed more extraordinary film thickness under higher loads, whereas narrower parallel grooves exhibited a flow-direction because the lubricant may be directed away from contact in a parallel groove and so reduces the thickness of the film and tribology (Costa and Hutchings, 2007). The angle of textures was essential since they alter the lubricant's capacity to capture wear particles (Zhan and Yang, 2012). The foregoing tests show that textures must be oriented towards the sliding direction since it has a direct effect on the texture mechanism which promotes the tribological performance on a contact surfaces. For the building grooves in parallel on the rake tool face (known as textured tool), EDM has been used (Kim et al., 2015) and evaluated its influence on the cuts in comparison with conventional tool.
Some researchers have discriminate textures (Fig. 2.1, showing perpendicular shape, parallel shape, and cross patterns) to chip flow direction using femtosecond laser on WC inserts (Kawasegi et al., 2009).
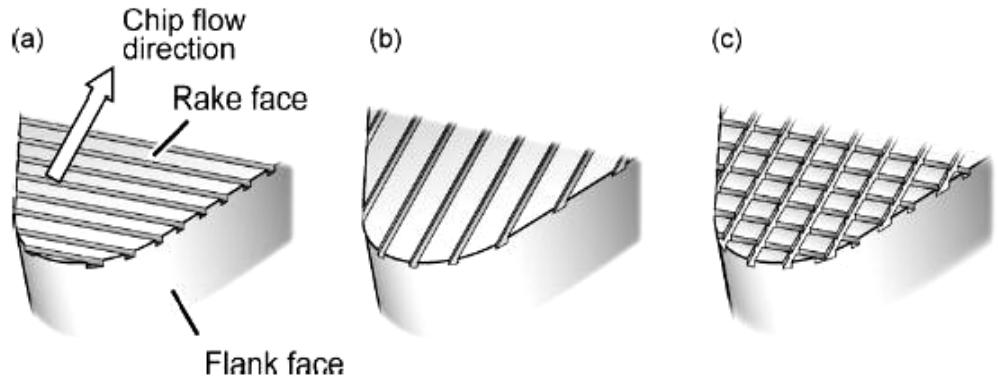
Figure 2.1: Texture on Cutting Tool According to Direction of Chip Flow (A) Perpendicular Shape (B) Parallel Shape (C) Cross Texture (Kawasegi Et al., 2009)
Wear resistance of tool is found to increased greatly in comparison to conventional insert while machining carbon steel with four kinds of textured tool because this micro-grooved surface collects the wear particles created by wear mechanisms (Enomoto and Sugihara, 2010).
Four varieties (perpendicular, parallel, square-shaped pits and dots) as depicted in Fig.
2.2 were produced in the same way. Micro-scale textures in orthogonal and diagonal sites showing that using rake and flank face grooves decreases tool wear as compared with ordinary tools (Xie et al., 2012). Diagonal micro-sites reduce wear of tool by 6.7% and increase heat dissipation rate in the cutting are due to texture orientation to the chip flow direction.
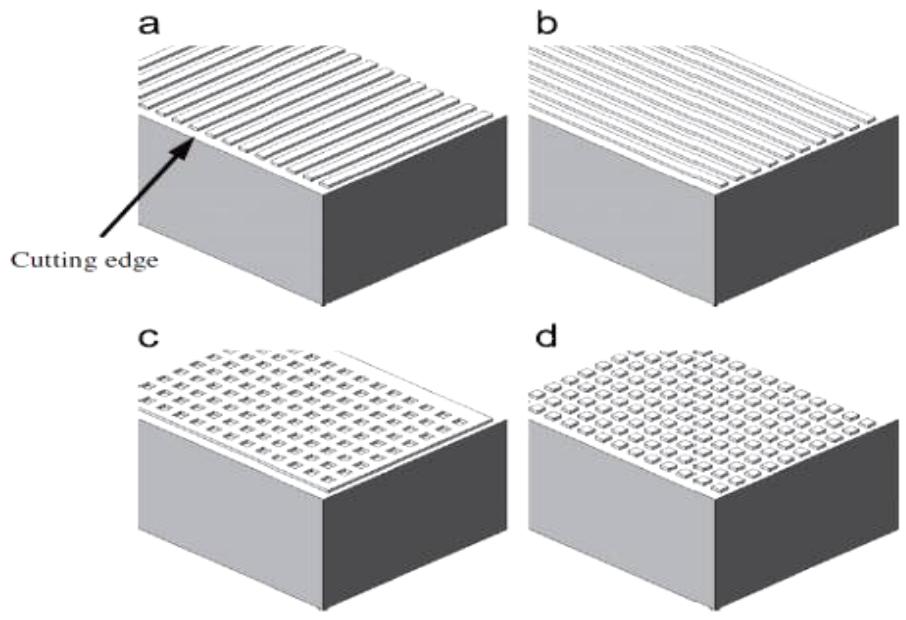
Figure 2.2: Texture Types on Tool Rake Surface (A) Perpendicular Type (B) Parallel Type (C) Pit Type and (D) Dot Type. (Obikawa Et al., 2011)
Advantages of micro/ nano-textures
-
Textures on the cutting tool help to improve machinability by lowering friction, but it depends upon the shape and size of the textures. Reduction in friction is achieved by micro/nano-scale textures as reported with the literature.
-
Reduced friction results in decreased wear, cutting forces, and chip adhesion during the cutting action.
-
Cutting tool textures aid in the retention of coolant/lubricant at the tool-chip contact, providing lubricating and cooling benefits.
-
It also reduces plowing wear by removing wear debris, which causes abrasive wear.
-
Textures serve as reservoirs for both liquid and solid lubricants, resulting in the formation of a self-lubricating barrier at the tool-chip interface. This technique is advantageous for solid lubricants because it extends the tool life and improves the surface quality of textured tools.
III. EXPERIMENTAL SETUP
3.1 Work Piece Material
Commercially available, round bars of AISI H11-hot die steel (with axial cutting length 200 mm and diameter 22 mm) were selected as workpiece materials for tuning tests material. Composition and mechanical characteristics of AISI H11 hot die steel are given in Table 3.1 and Table 3.2.
Table 3.1: Chemical Composition of AISI-H11 (Hot Die Steel) in Wt.%
| C | Si | Mn | P | S | Cr | Mo | V |
| 0.33 | 0.9 | 0.29 | 0.03 | 0.02 | 5.1 | 1.2 | 0.34 |
Table 3.2: Mechanical Characteristics of AISI-H11 (Hot Die Steel) at Nominal Ambient-Temperature
| Tesile Strength (MPa) | Yield Strength (MPa) | Young modulus (MPa) | Density (g/cm3) | Melting Range (°C) | Hardness, Brinell HB | Thermal Conductivity (W/mK) |
| 1590 | 1380 | 215 × 103 | 8.19 | 1345-1427 | 195 | 42.2 |
3.2 Cutting Tool Material
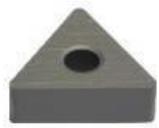
Cutting tool material selected for the turning tests was uncoated cemented carbide tool; ISO designation - TNMA 160408-THMF (provided by
M/s Kennametal India Limited) having specifications shown in Table 3.3. The name of the tool holder was WTJNR1616H16. It was used to rigidly mount the tool mentioned above and had a tool cutting edge angle of .
Table 3.3: Cutting Insert Specifications
| Cutting insert | Type | Insert Geometry | Insert dimensions (mm) | No. of Edges | |||
| L | IC | $R_e$ | S | ||||
 | TNMA | 16.50 | 9.52 | 0.80 | 4.76 | 6 | |
Uncoated cemented carbide tool with texture on the rake face is utilized in comparison to costly CBN tools for turning "difficult-to-machine" materials. The tool holder (WTJNR1616H16) and cutting insert on clamping, gave approach angle (93°), clearance angle (6°), rake angle (-6°) and nose radius (0.80 mm). The dimensions of tool holder (in mm) are given in Table 3.4.
Table 3.4: Tool Holder Dimensions
| Tool Holder | Dimensions (in mm) | |||||
| WTJNR1616 | H | B | LF | LH | HF | WF |
| H16 | 20 | 20 | 125 | 125 | 25 | 25 |
3.3 Fabrication of Surface Texture on Rake Face (Dimple Shape)
In general, the several "micro-machining" techniques for removing materials, such as 'micro-grinding', 'micro-EDM', 'femtosecond laser' and 'fibre laser' have been used.
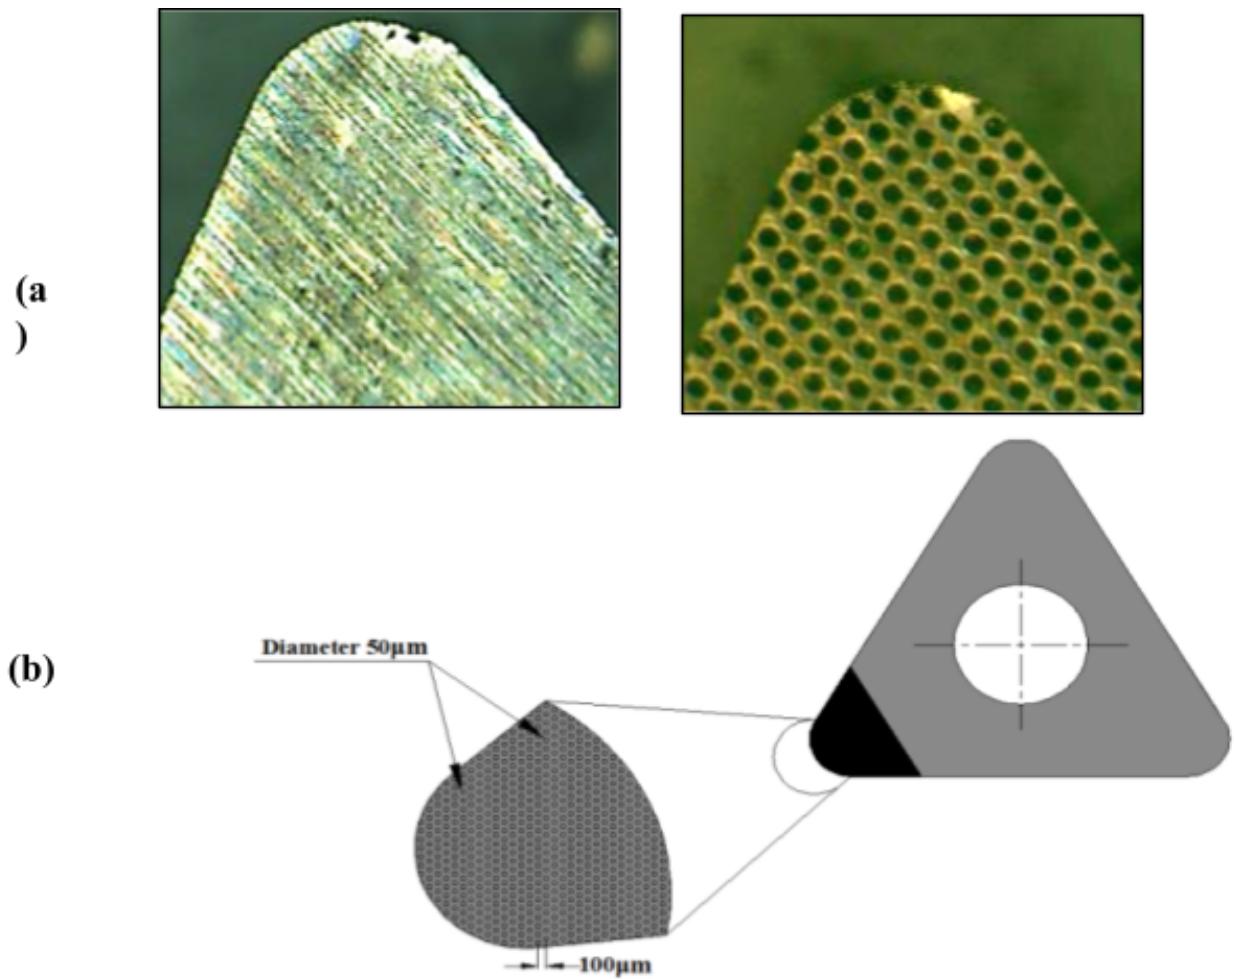
Figure STYLEREF 1 \s 3.1 Optical microscope image of (a) Non-textured (NT) tool and textured tool (TT) (b) CAD model textured tool
Dimple-shaped texture with 50 m diameter and 100 m special distance, as illustrated in Fig. 3.1 a,b, is taken into consideration and is modelled using CAD software. The CAD model was then exported to appropriate interface for fabricating texture on tool rake surface. A "multidiode pump fibre laser" (LM-487-A-22-SD6-UX-M30-M) was applied on uncoated carbide tool's rake surface, the array of dimple texture is taken zigzag and the direction parallel to cutting edge was fabricated.
The conventional insert with non-textured and dimple-textured pictures was measured by optical microscope and is displayed in Fig. 3.1 a, b.
3.4 Machine and Measuring Equipment
The turning runs were conducted on convention lathe HMT, India, model: high-speed precision lathe NH 22 and for tool flank wear and surface roughness measurement Metzer toolmaker's microscope Surf Test SJ-201 analyzer are utilized.
To measure the cutting forces during cutting, a strain gauge-based digital lathe dynamometer supplied by RMS Controls, India, was used during experimentation. The specifications of the cutting force dynamometer are given in Table 3.5. Scanning electron microscopy (SEM) was used to characterize the wear of worn-out cutting inserts.
The SEM/EDAX equipment is shown in Figure 3.6 with the following specifications, associated with two computer interface for wear and elemental analysis, respectively.
Table 3.5: Specifications of Digital Lathe Dynamometer
| Make | RMS Controls, India |
| Axis | 3 axis- X, Y, Z |
| Sensor | 500.0 kgf |
| Range | 0.1 kgf |
| Resolution | 0.05% Full scale |
| Accuracy | 0.05% |
| Linearity | Front side push button switch |
| Zero/Tare | 230 V AC |
| Power supply | Table |
| Model | Top |
Table 3.6: Specification of "Scanning Electron Microscope" (SEM)
| Make | JEOL, Japan |
| Model | JSM-6510LV |
| Maximum magnification | 5X to 300,000X |
| Resolution | 3 nm |
| Operating voltage | 0.5 KV to 30 KV |
| Maximum specimen | 150 mm diameter |
| Objective lens | Super conical |
IV. MODELING OF FLANK WEAR AND SURFACE ROUGHNESS
To generate models for response factors, i.e., tool flank wear and surface roughness, an entire set of 20 experiments obtained through RSM based on CCFC (central composite face-centered) design have been conducted. The input turning parameters viz. cutting speed, feed rate, and depth of cut were varied over 3 levels, whereas the tool geometry and texture on the rake surface were kept constant for each experiment. The new cutting edge of the insert was used to conduct each turning test. CCFC experimental layout, along with results obtained for output responses, i.e., tool flank wear (VB) and surface roughness (Ra), is shown in Table 4.1.
In order to build their respective models in terms of input factors, the output responses were examined using RSM. The quadratic model was presented the best fit for both output factors, whereas cubic models had been aliased, in Table 4.2 and Table 4.3.
The recommended quadratic models' R-Squared values were the greatest (except the aliased one), while their associated PRESS values remain lowest, indicating quadratic model's superiority over other source models.
Table 4.1: CCFC Experimental Layout with Results
| Exp. No | Cutting speed: Vc (m/min.) | Feed rate: f (mm/rev) | Depth of cut: d (mm) | Flank wear: VB (mm) | Surface roughness: Ra (μm) |
| 1 | 130 | 0.24 | 0.35 | 2.81 | 1.84 |
| 2 | 180 | 0.16 | 0.2 | 2.65 | 1.78 |
| 3 | 180 | 0.32 | 0.2 | 3.11 | 2.12 |
| 4 | 80 | 0.16 | 0.2 | 1.74 | 1.86 |
| 5 | 80 | 0.32 | 0.2 | 2.19 | 2.6 |
| 6 | 80 | 0.16 | 0.5 | 1.81 | 2.23 |
| 7 | 80 | 0.24 | 0.35 | 2 | 2.34 |
| 8 | 80 | 0.32 | 0.5 | 2.21 | 2.98 |
| 9 | 130 | 0.24 | 0.35 | 2.54 | 2.02 |
| 10 | 130 | 0.24 | 0.5 | 2.65 | 2.21 |
| 11 | 130 | 0.24 | 0.35 | 2.77 | 1.99 |
| 12 | 130 | 0.24 | 0.35 | 2.54 | 2.18 |
| 13 | 130 | 0.24 | 0.2 | 2.64 | 1.87 |
| 14 | 130 | 0.32 | 0.35 | 2.64 | 2.24 |
| 15 | 180 | 0.16 | 0.5 | 2.97 | 2.04 |
| 16 | 130 | 0.24 | 0.35 | 2.74 | 1.94 |
| 17 | 180 | 0.24 | 0.35 | 3.07 | 2.18 |
| 18 | 130 | 0.16 | 0.35 | 2.3 | 1.78 |
| 19 | 130 | 0.24 | 0.35 | 2.62 | 1.96 |
| 20 | 180 | 0.32 | 0.5 | 3.33 | 2.44 |
Table 4.2: Comparison Models for Tool Flank Wear (VB)
| Source models | R2 | PRESS values | Remarks |
| Linear | 0.9281 | 0.3621 | |
| 2FI | 0.9364 | 0.6941 | |
| Quadratic | 0.9707 | 0.2568 | Suggested |
| Cubic | 0.9743 | 19.70 | Aliased |
Table 4.3: Comparison Models for Surface Roughness (Ra)
| Source models | R2 | PRESS values | Remarks |
| Linear | 0.7169 | 0.8139 | |
| 2FI | 0.7610 | 2.06 | |
| Quadratic | 0.9099 | 0.2107 | Suggested |
| Cubic | 0.9613 | 3.27 | Aliased |
4.1 ANOVA Analysis
The ANOVA test was used to determine the statistical significance of models and input variables produced by RSM. Findings through ANOVA for VB and Ra models are shown in Table 4.4 and Table 4.6 respectively. The importance of RSM models and input variables may be determined by examining their associated p-value (Prob>F). If the p-value < 0.05 (Prob>F, at 95% confidence level), the contribution of parameters is considered significant. Using the ANOVA test, it was determined that models for VB and Ra are fitted and significant statistically. ANOVA findings indicate that A, B, C, AB, AC, BC, , , and , are all statistically significant variables for both output responses. Lack of fit: F-test was used to determine how well the generated response models fit the input data. F-values (i.e., the ratio between mean square lack of fit and pure error mean square) for lack of fit test were found as 0.3969, and 0.2749 for VB and Ra models, respectively and their associated p-values (>0.05) representing lack of fitness, as strongly sought model adequacy, are statistical insignificant compared to pure error. The variation coefficient (C.V. = (Std. Dev. / mean) × 100) provides an estimate of the pure error of the models' VB and Ra. The summary of model statistics for output response models (Table 4.5 and Table 4.7), indicating a strong signal for dependability of machine and accuracy of the model, indicate a low value of C.V. for both models (<10%).
Likewise,; or R-squared = 1- (residual sum of squares/total sum of squares) was higher than
0.85, for both models, which confirmed furthermore the accuracy of the models that were fitted with regard to the projection of capability of response parameters. The values of output responses that are predicted by the adjusted and indicate excellent interactions. In addition, adequate precision (AP: signal/noise ratio) > 4, shows the validity of the models for future predictions for both models. Furthermore, the lowest press values (predicted residuals error sum of squares): 0.2568 and 0.2107, shows quadratic models for output responses are best fit models for the test findings.
Table 4.4: ANOVA Results for Tool Flank Wear (VB)
| Source | Sum of Squares | DF* | Mean Square | F value | p-value Prob>F | Remarks |
| Model | 3.27 | 9 | 0.3635 | 36.76 | < 0.0001 | significant |
| A-Cutting speed (Vc) | 2.68 | 1 | 2.68 | 271.31 | < 0.0001 | |
| B-Feed rate (f) | 0.404 | 1 | 0.404 | 40.85 | < 0.0001 | |
| C-Depth of cut (d) | 0.041 | 1 | 0.041 | 4.14 | 0.0692 | |
| AB | 0.0001 | 1 | 0.0001 | 0.0114 | 0.9172 | |
| AC | 0.0253 | 1 | 0.0253 | 2.56 | 0.1407 | |
| BC | 0.0028 | 1 | 0.0028 | 0.2844 | 0.6055 | |
| $A^2$ | 0.0118 | 1 | 0.0118 | 1.19 | 0.3007 | |
| $B^2$ | 0.0468 | 1 | 0.0468 | 4.73 | 0.0547 | |
| $C^2$ | 0.0055 | 1 | 0.0055 | 0.5517 | 0.4747 | |
| Residual | 0.0989 | 10 | 0.0099 | |||
| Lack of Fit | 0.0281 | 5 | 0.0056 | 0.3969 | 0.8333 | not significant |
| Pure Error | 0.0708 | 5 | 0.0142 | |||
| Cor Total | 3.37 | 19 |
Table 4.5: Tool Flank Wear- VB Model Statistics
| Std. Deviation | 0.0994 | $R^2$ | 0.9707 | |
| Mean | 2.57 | Adjusted $R^2$ | 0.9443 | |
| C.V.% | 3.87 | Predicted $R^2$ | 0.9238 | |
| PRESS | 0.2568 | Adeq Precision | 22.2693 |
Table 4.6: ANOVA Results for Surface Roughness (Ra)
| Source | Sum of Squares | DF* | Mean Square | F value | p-value Prob>F | Remarks |
| Model | 1.61142 | 9 | 0.179 | 22.332 | 0.00002 | significant |
| A-Cutting speed (Vc) | 0.21025 | 1 | 0.210 | 26.224 | 0.00045 | |
| B-Feed rate (f) | 0.72361 | 1 | 0.724 | 90.253 | 0.00000 | |
| C-Depth of cut (d) | 0.27889 | 1 | 0.279 | 34.785 | 0.00015 | |
| AB | 0.07031 | 1 | 0.070 | 8.770 | 0.01425 | |
| AC | 0.00361 | 1 | 0.004 | 0.451 | 0.51727 | |
| BC | 0.00061 | 1 | 0.001 | 0.076 | 0.78787 | |
| $A^2$ | 0.16324 | 1 | 0.163 | 20.360 | 0.00112 | |
| $B^2$ | 0.00011 | 1 | 0.000 | 0.014 | 0.90852 | |
| $C^2$ | 0.00154 | 1 | 0.002 | 0.192 | 0.67087 | |
| Residual | 0.08018 | 10 | 0.008 | |||
| Lack of Fit | 0.01729 | 5 | 0.003 | 0.275 | 0.90858 | not significant |
| Pure Error | 0.06288 | 5 | 0.013 | |||
| Cor Total | 1.69160 | 19 |
Table 4.7: Surface Roughness- Ra Model Statistics
| Std. Deviation | 0.0895 | $R^2$ | 0.9526 | |
| Mean | 2.13 | Adjusted $R^2$ | 0.9099 | |
| C.V.% | 4.20 | Predicted $R^2$ | 0.8755 | |
| PRESS | 0.2107 | Adeq Precision | 19.6007 |
To create a connection between response variables and input turning factors, multiple regression analysis was used to produce output response (VB and Ra) mathematical models. Table 4.8 lists empirical models for output responses.
Table 4.8: Empirical Model Equations
| Sr. No. | Response Factors | Empirical Model Equations (In Terms of Actual Factors) |
| 1 | VB | -0.650240 + 0.014767 * Vc + 12.96534 * f - 1.55919 * d - 0.000938 * Vc * f + 0.007500 * Vc * d - 1.56250 * f * d - 0.000026 * (Vc)2 - 20.38352 * (f)2 + 1.97980 * (d)2 |
| 2 | Ra | 2.09936 - 0.021622 * Vc + 6.63144 * f + 0.571313 * d - 0.023438 * Vc * f - 0.002833 * Vc * d + 0.729167 * f * d + 0.000097 * (Vc)2 - 0.994318 * (f)2 + 1.05051 * (d)2 |
To check the accuracy of developed models for VB and Ra, shown in Table 8.8, the values of VB and Ra have been calculated from these regression equations for a different combination of input parameters, as reported in Table 4.1. The anticipated model values (for VB and Ra) are compared with the experimentally examined values. Figures 4.1 and 4.2 demonstrate that the anticipated and empirically observed values (for VB and Ra) are very congruent.
{"image_source":{"path":"images/39efaf0dcf6a4e114a9035700c484319d6b32a4df543725d549c172cfd7b38b5.jpg"},"content":"","chart_caption":[],"chart_footnote":[]} {"image_source":{"path":"images/00bdf20ba80a4e992725f397a504f44351f0dfe18e0b05a30076a731a1fefc10.jpg"},"content":"","chart_caption":[{"type":"text","content":"Figure 4.1: Predicted and Actual Comparative Values of VB"},{"type":"text","content":"Figure 4.2: Predicted and Actual Comparative Values of Ra"}],"chart_footnote":[]}
4.2 Influence of Input Parameters on Tool Wear and Surface Roughness
A statistically significant model consisting of the feed rate and cutting speed-depth of cut interaction for flank wear of tool was used. Flank wear (VB) has been significantly varied with a change of speed. However, as is apparent from Fig 4.3, the wear of tool somewhat changes with feed rate.
{"image_source":{"path":"images/22301974b34d6bd531f08a81211bd34fd37737afa5f391f30f98ede5e42a0796.jpg"},"content":"","chart_caption":[{"type":"text","content":"Figure 4.3: Effect of Feed Rate and Cutting Speed on VB"}],"chart_footnote":[]}
Wear at tool is minimal at lower cutting speed, but rises with cutting speed increases, for all feed rate range from minimum 80 m/min., and then increases quickly with an increase in cutting speed. On the other side, tool wear is less at low feed rates, but as feed rate rises, tool wear increases somewhat. Less tool wears initially with increased cutting speed and feed rate is attributable to the attachment of workpiece-chip material on flank face, as illustrated in SEM pictures of the worn-out tool for Exp. No. 9 (Fig. 4.4-b). Fig. 4.3 showed high speed and lower feed rates, accelerate wear of tool beyond the mean value would influence turning conditions, which would increase the temperature of the area to be cut and soften the adherement layer, which is detached as shown in SEM image for Exp. No. 2 (Fig 4.4-a).
Fig. 4.3 reported high wear at flan with higher feed rate/ speed. Initially, the tool edge was protected by hard particle and rake face textures, which limits chip tool contact, resulting in less tool flank wear, as the speed and feed rate rises, temperature between tool-chip interfaces becomes dominating factor. At high speed cutting, the friction rises due to uneven contact with a chip-tool, which causes the protective layer to be removed, i.e. adhesive wear. Furthermore, due to the high temperature during cutting, the bonds between tool particles are weakened by the severe diffusion between the work material and tool. The hard particles are thus removed from the tool and wear is thereby enhanced. The tool flank wear (VB) rises with an increase in feed rate, but above the mean value, the VB increases quickly. A reduction in tool flank wear was seen with a combination of low cutting speed and low feed.
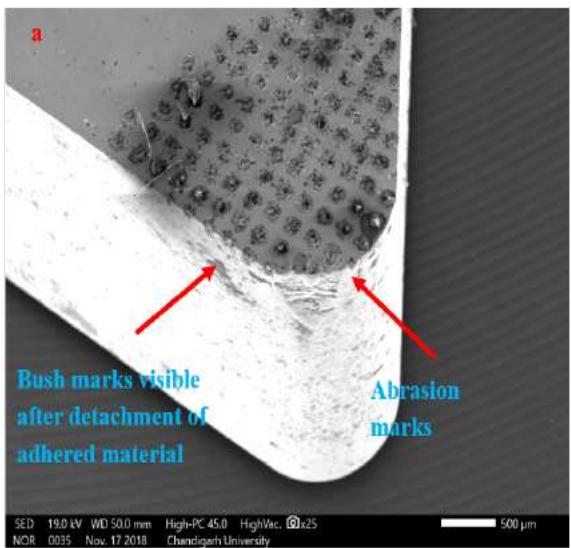
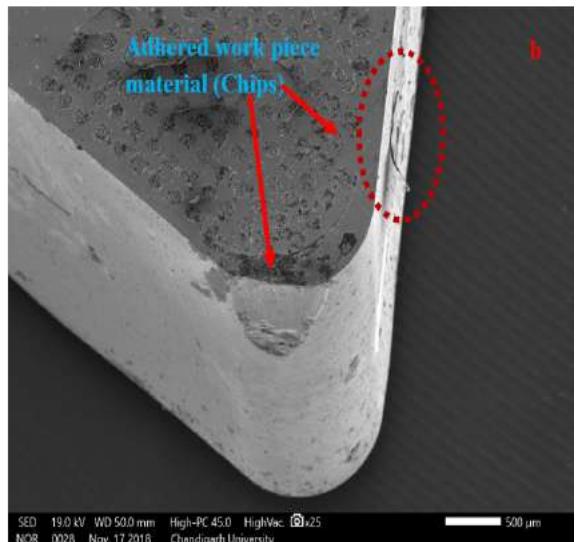
Figure 4.4: SEM Images of Worn-Out Cutting Inserts
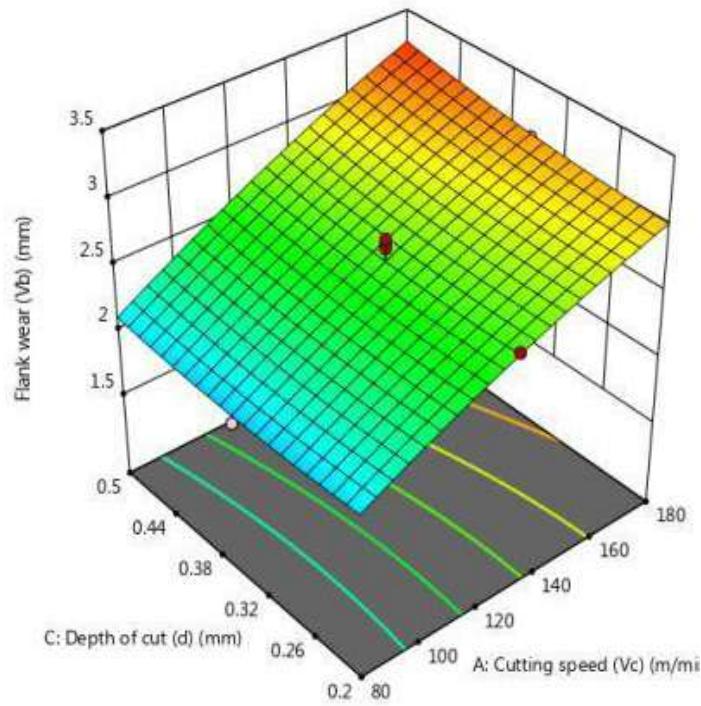
Figure 4.5: Effect of Cutting Speed and Depth of Cut on VB
The wear at the tool flank (VB) changes significantly when the depth cuts and speed range are low to moderate. However, the wear increases rapidly, as seen in Fig. 4.5. Fig. 4.5 showed depth cuts has marginal impact on wear of tool.
{"image_source":{"path":"images/f9fff326a007d32ed0d062592ebbdbf786789bebe23f8ad50d79872a42534349.jpg"},"content":"","chart_caption":[{"type":"text","content":"Figure 4.6: Effect of Feed Rate and Cutting Speed on Ra"}],"chart_footnote":[]} {"image_source":{"path":"images/e167a5729c0fbb339780cec6ac216ecf6285ccebfa0cb5aa4dbb98fddb61de0c.jpg"},"content":"","chart_caption":[{"type":"text","content":"Figure 4.6 illustrates the feed rate-cutting speed impact roughness (Ra), roughness of surface reduces at low feed rate, i.e., 0.16 mm/rev., with a cutting speed increase of 80 m/min.-180 m/min."},{"type":"text","content":"Figure 4.7: Effect of Depth of Cut and Cutting Speed on Ra"}],"chart_footnote":[]}
But, roughness of surface rises to 2.7 m at high level of feed rate (0.32 mm/rev.). At a cutting speed of 80 m/min., roughness of surface (Ra) value is greater, but at 130 m/min., it drops to 1.78 m, followed by a little higher cutting speed.
The impact of speed and cuts depth on Ra is shown in Figure 4.7. The impact was comparable to the effects of feed rate, as, at lower speed of cutting, Ra is higher, and as the speed increases, up to 130 m/min. values of Ra decreases. But with the further increment of speed of cutting does not have a noteworthy effect on Ra.
Whereas on other hand, the cuts depth has a significant influence on roughness (Ra). At lower depth of cut (0.2 mm), surface roughness is nearly 2.23 m, while with rise in cuts depth, roughness increases up to 2.98 m. As illustrated in Fig. 4.7, the lowest roughness of surface was achieved by low depth of cut and speed of cutting.
4.3 Multi-Response Optimization of Turning Parameters
For optimizing turning variables for AISI H11 multi-response optimization using desirability function was employed with uncoated carbide tool to achieve minimal tool flank wear (VB) and surface roughness (Ra) using textured tools. The numerical optimization algorithm seeks a set of factors levels that simultaneously satisfies the criteria placed on each response factor with highest combined desirability. The various constraints applied throughout the optimization process are described in Table 4.9.
Table 4.9: Constraints Applied for Optimization of Turning Parameters The cutting parameters were determined to be optimal as: cutting speed (Vc = 86.61 m/min.), feed rate (f = 0.16 mm/rev.) and depth of cut (d = 0.2 mm) with projected optimum value of VB = 1.82 m and Ra = 1.79 m at a desirability level of 0.967 (Table 4.10; Solution no.1).
| Constraints | Goal | Lower Limit | Upper Limit |
| Cutting Speed (m/min.) | is in range | 80 | 180 |
| Feed rate (mm/rev.) | is in range | 0.16 | 0.32 |
| Depth of cut (mm) | is in range | 0.2 | 0.5 |
| Flank wear, VB (μm) | minimize | 1.74 | 3.33 |
| Surface roughness, Ra (μm) | minimize | 1.78 | 2.98 |
Table 4.10: Optimization Solutions
| S No. | Cutting Speed (m/min.) | Feed rate (mm/rev.) | Depth of cut (mm) | VB (μm) | Ra (μm) | Desirability | Remarks |
| 1 | 86.616 | 0.160 | 0.200 | 1.820 | 1.799 | 0.967 | Selected |
| 2 | 87.054 | 0.160 | 0.200 | 1.824 | 1.795 | 0.967 | |
| 3 | 87.573 | 0.160 | 0.200 | 1.830 | 1.790 | 0.967 | |
| 4 | 85.628 | 0.160 | 0.200 | 1.808 | 1.808 | 0.967 | |
| 5 | 88.012 | 0.160 | 0.200 | 1.835 | 1.787 | 0.967 |
4.4 Confirmation Tests
Confirmation tests (replicated thrice) have been carried out under the same experimental settings and tooling circumstances, with suggested optimal levels of machining variables. Table 4.11 demonstrates the error between the expected response and the experimental results from validating the precision of the mathematical model created for both VB and Ra during the confirmatory tests within the 95% prediction range, illustrated in Table 4.11.
Table 4.11: Results of Confirmation Tests
| Response factor | Results obtained at machining parameters (86.6 m/min., 0.16mm/rev. and 0.2 mm) | ||
| RSM Predicted value | Experimentally observed value | Error (%) | |
| Tool flank wear (μm) | 1.82 | 1.89 | 3.84% |
| Surface roughness (μm) | 1.79 | 1.87 | 4.47% |
V. CONCLUSION
In this study mathematical models has been developed for turning AISI H11 steel using uncoated carbide textured (dimple shape) tool to analyse the effect of variation of i.e. cutting speed , feed rate and cutting depth on output responses viz. tool flank wear (VB) and surface roughness (Ra) using RSM. The following conclusions are derived:
a) ANOVA results reveals A, B, C, AB, AC, BC, A2, B2, and C2, are the statistically significant parameters for both output responses i.e. tool flank wear (VB) and roughness of surface (Ra).
b) Wear of tool initially decreases to some extent with rise in cutting speed at all feed rate range at about 80 m/min., and increases quickly with cutting speed rise. Wear of tool shows similar behaviour with change in feed rate from 0.16-0.32 mm/rev. for all speed range for cutting. Maximum wear on flank of tool occurs at maximum cutting speed of 180 m/min. and maximum feed rate of 0.32 mm/rev. Wear at the tool flank (VB) significantly rises with rise in cutting depth i.e. from 0.2-0.5 mm and speed range i.e. from 80-180 m/min..
c) At low level of feed rate i.e. at 0.16 mm/rev., roughness of surface (Ra) decreases with rise in cutting speed from 80-180 m/min. However, at high value of feed rate (0.32 mm/rev.), Ra is high at low cutting speed i.e. 80 m/min., but as the speed of cutting rises roughness of surface become stable. The value of Ra increases significantly with change in feed rate from 0.16 to 0.32 mm/rev, at range of speed. Cutting depth also significantly affect Ra, at low cutting depth i. e. 0.2mm, Ra is 2.23 m, whereas increase in cuts depth it rises to 2.98 m.
d) Best value of surface quality is achieved corresponding to combination of lowest feed rate and cutting depth with highest speed of cutting.
e) The optimized machining parameters for minimizing wear of tool and roughness of surface are approaching: cutting speed ( ), feed rate (f = 0.16 mm/rev.) and cutting depth (d = 0.2 mm) with predicted optimum value of VB = 1.82 m and Ra = 1.79 m at desirability level of 0.967.
f) Confirmation tests validate accuracy of the RSM generated models. The results show 3.84% and 4.47% error between predicted and experimental observed values of VB and Ra, respectively.
Conflict of Interest
The authors declare no conflict of interest.
Ethical Approval
Not applicable
Data Availability
The datasets used in this study are openly available at [repository link] and the source code is available on GitHub at [GitHub link].
Funding
This work did not receive any external funding.
References
Cite this article
Related Research




Special Issue
Launch a focused special issue to highlight research, emerging trends, and expert insights in your academic field.
