


IntelliPaper
Abstract
Background: Sunflower (Helianthus annuus L.) is a vital oilseed crop known for its adaptability to diverse agro-climatic conditions. Drought stress, however, significantly limits its productivity. Previous studies have highlighted the importance of biomass partitioning and root traits in enhancing drought tolerance. Yet, comparative performance across different genetic groups-cytoplasmic male sterile (CMS) lines, restorer (R) lines, inbreds, hybrids, and varieties-remains underexplored.
Objective: This study aimed to evaluate the drought tolerance potential of 48 sunflower genotypes, hypothesizing that hybrids and select parental lines exhibit superior root and biomass traits under water-limited conditions. The goal was to identify promising genotypes for breeding climate-resilient cultivars.
Methods: A randomized complete block design (RCBD) was employed under controlled drought stress conditions. Eleven morphological and physiological traits were assessed, including root volume, root dry weight, root length, total dry matter (TDM), and specific leaf area (SLA). Statistical analyses included ANOVA for significance testing (P < 0.05), principal component analysis (PCA) to identify trait contributions, and biplot analysis for genotype clustering.
Results: Significant genotypic variation was observed across all traits. Hybrids consistently outperformed other groups, particularly in TDM and root biomass. CMS-2B, CMS-104A, and IB-80 emerged as top-performing non-hybrids with robust root systems. Hybrids RSFH-1, KBSH-44, and KBSH-55 showed superior drought resilience. PCA revealed that PC1 accounted for 60% of the variance, dominated by TDM, root traits, and plant height, indicating overall plant vigor. PC2 (13.7%) captured the trade-off between leaf efficiency (SLA, SCMR) and structural resilience. Biplot analysis effectively grouped genotypes and highlighted promising paternal lines for drought-prone environments.
Conclusions: The study underscores the value of multivariate analysis in identifying drought-tolerant sunflower genotypes. Hybrids demonstrated superior performance, while select CMS and inbred lines showed potential as breeding resources. These findings contribute to strategic cultivar development for water-limited regions, enhancing sunflower resilience and productivity.
Explore Digital Article Text
I. INTRODUCTION
Sunflower (Helianthus annus L.) is one of the most important vegetable oilseed crop and is native to southern parts of the USA and Mexico. It is popular due to its high-quality edible oil which is a rich source of edible oil (30-50%), protein (20-30%), tocopherols (vitamin E), and fatty acids. The edible oil contains a good composition of 90% unsaturated fatty acids with linoleic acid (Rauf, 2019). In India, 95 per cent of the total area under sunflower cultivation is confined to rainfed ecosystem during south west monsoon. Among the nine oilseed crops, sunflower stand in front line for cultivation in farming community due to its outstanding characters viz., wider adaptability to different agro-climatic zones and soil types, easy crop management, photo-insensitivity, short duration, high seed multiplication ratio and higher oil per cent in the seed. However, the productivity is highly depending on the genetic character of the crop with high phenotypic, genotypic and physiological functions apart from crop production technologies. The major environmental limitation that limits the overall production is inadequate soil moisture. Most of the studies are pertaining to above ground parameters such as physiology of leaf and biochemical composition of leaves, but not the root traits. A few studies available on root studies were mostly confined to early stages (seedling stage and laboratory conditions using small containers).
Physiological attributes of plants depend on improving the drought resistance of crop cultivar that have maximum seed yield, maximum head diameter, maximum physiological adaptability, and high growth rate (Hossain et al., 2010). For obtaining higher productivity in sunflower, selection of suitable lines with desirable growth, yield and physiological attributes CMS-lines, R-lines, inbreds, hybrids and varieties of sunflower needs to be evaluated and selected for breeding programme. Most of the studies related to screening of sunflower for drought stress, included one or two varieties or germplasm accessions (Razzaq et al., 2017). There is no information on growth, yield and physiological attributes of sunflower genotypes. Therefore, present study emphasis on understanding the physiological mechanism of various sunflower genotypes in field condition.
II. MATERIAL AND METHODS
2.1 Experimental Design and Planting Material
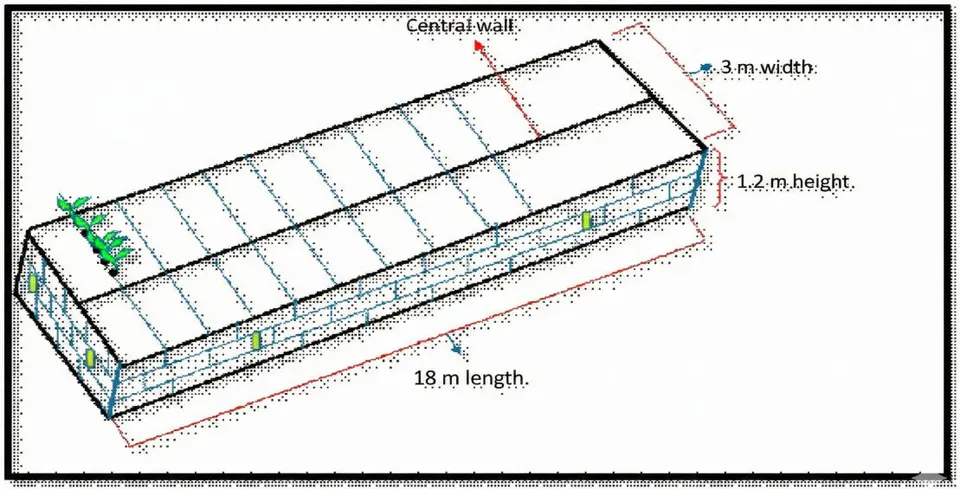
The field experiment was conducted during kharif and rabi seasons of 2022–2023 at Zonal Agricultural Research Station, UAS, Bangalore, using root structures filled with red lateritic soil (pH 6.86; medium N, P, K). A randomized complete block design with three replications was adopted, involving 49 sunflower genotypes including CMS lines, restorers, inbreds, varieties, and hybrids. Farmyard manure (10 t/ha) was incorporated 15 days before sowing. Fertilizer management included 50% N and full and as basal (urea, SSP, MOP), with the remaining 50% N top-dressed at 30 DAS during earthing up. The crop was sown in late July and harvested at physiological maturity when capitula were fully dried. Seeds were evaluated under controlled conditions to impose moderate drought stress by withholding irrigation at the vegetative stage. Standard agronomic practices were followed, and data on growth and yield attributes were recorded to assess genotypic performance.
2.2 Trait Measurement
At the flowering stage, plants were carefully uprooted and washed to record root and shoot traits. The root traits included root volume (displacement method, cc plant ), root dry weight (g plant ), and root length (cm). Total dry matter (TDM; g plant ) was determined after oven-drying samples at 70 °C to constant weight. The plant height (cm), leaf area (cm ) measured using a leaf area meter, and specific leaf area (SLA; cm g ).
2.3 Statistical Analysis
Descriptive statistics and analysis of variance (ANOVA) were performed to detect significant genotypic differences. To compare groups differing in root length and biomass allocation, Welch's t-test (parametric) and the Mann–Whitney U test (non-parametric) were applied. Effect sizes were calculated using Cohen's d to determine the magnitude of genotypic differences.
2.4 Principal Component Analysis (PCA) and Biplot Visualization
To identify the most influential traits contributing to drought resilience, principal component analysis (PCA) was performed on 10 morpho-physiological variables using the correlation matrix. Eigenvalues greater than one were considered significant, and the first two principal components (PC1 and PC2) were retained for interpretation. Trait-genotype relationships were visualized using biplots, allowing clustering of genotypes based on root and biomass attributes. Genotypes positioned on the positive axis of PC1 and PC2 were considered superior for drought adaptation.
2.5 Statistical Analysis and Software
All statistical analyses were conducted using R software (version 4.1.0), and figures (biplots, scree plots, and trait comparisons) were generated using the ggplot2 package.
III. RESULTS AND DISCUSSION
3.1 Screening of Sunflower Lines for Morpho-Physiological Traits
The studied sunflower genotypes showed clear variation in biomass parameters and root architecture. Key traits such as root volume, root dry weight, root length, and TDM were strongly associated with drought adaptation. Among CMS lines, CMS-2B exhibited the highest root dry weight (28 g pl ) and root volume (100 cc pl ), while CMS-104A and CMS-89A also showed strong root biomass (Andrianasolo et al., 2016). CMS-103A and CMS-851A balanced root development with TDM. IB-80, with 100 cc pl root volume, 23.84 g pl root dry weight, and 138.18 g pl TDM, emerged as a strong inbred pre-breeding choice, whereas TNASF-239 and CSF1-99, despite average roots, were efficient in biomass allocation (Umar & Siddiqui, 2018).
Hybrids consistently outperformed other groups in biomass accumulation, reflecting heterosis (Tariq et al., 2018). RSFH-1 showed the highest TDM (249.49 g pl ) with 137.5 cm pl root volume and 40.32 g pl root dry weight, while NDSH-1 and SVSH-402 also displayed strong biomass and root traits, making them suitable for drought-resilient breeding (Sarvari et al., 2017).
CMS lines generally recorded the highest mean plant height, leaf area, and TDM, while inbreds had the lowest values; R-lines were intermediate except for root volume, which peaked in this group (67.8 cc pl ) (Abdel et al., 2021). Variance across CMS, R-lines, and inbreds confirmed distinct genetic potentials, aligning with root volume and weight as indicators of resource allocation under stress (Killi et al., 2017), with strong clustering on PC1 in the biplot (Sacramento et al., 2018).
Group 1 genotypes (high root length and high TDM) significantly outperformed Group 2, with large effect sizes (Cohen's d = 4.46 for root length, 2.16 for TDM) and highly significant differences (p<0.001). Results were validated by Welch's t-test and Mann–Whitney U tests, confirming Group 1's superior growth and biomass traits (Tables S1–S3; Figure 1).
| Variable | Group 1 (n=10)Mean ± SD | Group 2 (n=7)Mean ± SD | Welch t-testp-value | Mann-Whitney Up-value | Cohen's d[95% CI] | Effect Size |
| Root Length(cm pl-1) | 50.04 ± 4.59 | 23.51 ± 7.55 | 0.000015 | 0.000743 | 4.456[2.518, 6.394] | Large |
| TDM (g pl-1) | 141.54 ± 55.04 | 48.54 ± 9.07 | 0.000419 | 0.000755 | 2.162[0.847, 3.476] | Large |
{"image_source":{"path":"images/dbde195294b5ab12a13f2579572d1e902e499cef8847d2ffecf8c822c9b9ef0b.jpg"},"content":"","chart_caption":[{"type":"text","content":"Figure 1: Bargraph showing differences in root dry weight and total dry matter between low and high performing sunflower lines."}],"chart_footnote":[]}
3.2 Principle Component Analysis
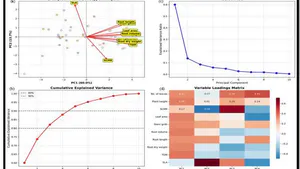
Principal Component Analysis (PCA) of 48 plant genotypes revealed that PC1 captured 60.0% of the variance, while PC2 explained 13.7%, together accounting for 73.7%. The scree plot confirmed PC1's dominance, indicating a strong underlying factor driving plant variation. PC1, representing general plant vigor, was positively loaded by Total Dry Matter (0.376), Plant Height (0.361), Root Volume (0.356), Leaf Area (0.353), and Root Dry Weight (0.348), while SLA loaded negatively (-0.099). Thus, higher PC1 scores reflected larger, more robust plants with thicker leaves.
PC2 represented leaf efficiency and resource allocation (Sadras & Villalobos, 2021). It showed the strongest positive loading for SLA (0.714) and negative loading for SCMR (-0.497). High PC2 genotypes favored light capture via thin, broad leaves but with lower chlorophyll content (Hussain et al., 2018), whereas low PC2 genotypes emphasized photosynthetic intensity through denser, chlorophyll-rich leaves (Figures 2a–d).
3.3 Biplot Visualization of Root and Leaf Trait Relationships
Significant variability (P < 0.05) was observed across genotypes for all recorded traits. High coefficients of variation were noted for root-related traits and TDM, indicating strong genotypic diversity. Among the CMS lines, CMS-2B emerged as a superior genotype with the highest root volume (100 cc pl ), a root dry weight of 28 g pl , and a root length of 41.17 cm, while CMS-104A also exhibited notable root traits with a root volume of 91.67 cc pl and a root dry weight of 20.67 g pl . CMS-89A and CMS-851A further demonstrated a substantial investment in root dry matter, reinforcing their potential under drought conditions (Zamani et al., 2020). Among the inbred lines, IB-80 stood out with a robust root system (root volume: 100 cc pl ; root dry weight: 23.84 g pl ), making it a valuable candidate for pre-breeding (Soleymani, 2017). The two primary axes of variation in plant genotypes overall plant vigor and leaf resource allocation strategy are successfully identified by this PCA analysis, offering important information for plant breeding programs and a better understanding of the basic trade-offs in plant development strategies (Figure. 2a) (Hussain et al., 2025).
3.4 PCA-Guided Selection of Superior Genotypes for Drought Adaptation
The study revealed significant genotype-to-genotype variability (P < 0.05), with high coefficients of variation for TDM and root traits. Among CMS lines, CMS-2B was superior (root volume: 100 cc pl ; root dry weight: 28 g pl ; root length: 41.17 cm), followed by CMS-104A (91.67 cc pl ; 20.67 g pl ). CMS-89A and CMS-851A also showed strong root investment under drought (Sarwar & Shahbaz, 2020). IB-80, with 100 cc pl root volume and 23.84 g pl root dry weight, stood out among inbreds as a promising pre-breeding line. PCA indicated that root volume, root dry weight, and TDM were major contributors to PC1, with key genotypes (KBSH-44, RSFH-1, CMS-2B) clustering positively on PC1 and PC2, reflecting co-expression of drought-adaptive traits (Debaeke et al., 2017).
IV. CONCLUSION
This study comprehensively evaluated 48 sunflower genotypes—including CMS lines, restorers, inbreds, hybrids, and varieties—under drought stress across 11 morpho-physiological traits. The findings confirmed that hybrids consistently outperformed other genetic groups in total dry matter (TDM) and root biomass, validating the role of heterosis in drought adaptation. Notably, CMS-2B, CMS-104A, and IB-80 emerged as promising non-hybrid candidates due to their robust root systems, while RSFH-1, KBSH-44, and KBSH-55 stood out as superior hybrids with enhanced TDM and root traits. Principal Component Analysis revealed that PC1, accounting for 60% of the total variance, was driven by plant vigor traits such as TDM, root characteristics, and plant height. PC2 (13.7% variance) highlighted a trade-off between leaf efficiency (SLA) and structural resilience (SCMR, root biomass), offering insights into genotype adaptability. Biplot analysis effectively clustered genotypes and identified potential parental lines suitable for drought-prone environments. Overall, the study demonstrated the effectiveness of multivariate analytical approaches in screening and selecting climate-resilient sunflower cultivars. These insights provide a valuable foundation for breeding programs aimed at enhancing drought tolerance and ensuring sustainable sunflower production under water-limited conditions.
Conflict of Interest statement
The authors declare no conflict of interest
Declaration
Generative AI used only to improve the readability of the text
Funding statement
The study has received funding from RKVY project. Number: ABAC8692
Conflict of interest statement and source of funding
Authors declare no conflict of interest. The study has received funding from RKVY project
Kothathi Shivanna Somashekar, Agronomist, AICRP on Sunflower, University of Agricultural Sciences, GKVK, Bangalore India- 560065
Supplementary tables
Table S1: Performance of CMS-lines, R-lines, inbreds, varieties and hybrids of sunflower genotypes for drought tolerant traits.
| Sl.no. | Genotypes | No. of leaves | Plant height (cm plant-1) | SCMR | Leaf area (cm2plant-1) | Stem girth (cm plant-1) | Root volume (cc plant-1) | Root length (cm plant-1) | Root dry weight (gplant-1) | TDM (g pl-1) | SLA (cm2g-1) |
| CMS-LINES | |||||||||||
| 1 | CMS-2A | 17 | 104.5 | 32.93 | 4343 | 1.68 | 69.17 | 36.00 | 11.50 | 55.51 | 321.65 |
| 2 | CMS- 10 A | 25 | 138.1 | 29.20 | 5819 | 1.85 | 54.17 | 36.17 | 07.49 | 55.84 | 459.28 |
| 3 | CMS-2B | 22 | 141.5 | 33.30 | 5882 | 2.28 | 100.00 | 41.17 | 28.00 | 92.67 | 405.57 |
| 4 | CMS- 10B | 24 | 143.5 | 32.83 | 2716 | 1.08 | 12.02 | 14.33 | 03.83 | 39.17 | 150.89 |
| 5 | CMS-9B | 22 | 144.0 | 32.05 | 7676 | 2.27 | 91.67 | 47.67 | 13.97 | 87.67 | 313.34 |
| 6 | NDCMS-1A | 24 | 143.0 | 42.68 | 8548 | 2.18 | 81.25 | 43.50 | 12.17 | 92.17 | 420.36 |
| 7 | CMS- 17 A | 30 | 167.0 | 38.02 | 6492 | 2.48 | 87.50 | 37.67 | 17.84 | 116.09 | 198.72 |
| 8 | CMS-17B | 09 | 59.0 | 39.60 | 1689 | 0.80 | 25.00 | 12.50 | 05.00 | 52.50 | 46.92 |
| 9 | COSF-1B | 20 | 127.83 | 31.72 | 4684 | 1.40 | 29.17 | 27.67 | 03.84 | 49.67 | 453.26 |
| 10 | CMS-234A | 30 | 153.67 | 33.77 | 4270 | 2.22 | 66.67 | 40.33 | 20.17 | 85.34 | 261.4 |
| 11 | CMS-851A | 26 | 127.5 | 35.60 | 4639 | 2.00 | 87.50 | 49.33 | 21.14 | 67.83 | 309.27 |
| 12 | CMS 335A | 20 | 136.25 | 33.30 | 6253 | 2.43 | 43.75 | 34.25 | 05.17 | 32.09 | 646.71 |
| 13 | CMS-103A | 26 | 127.83 | 37.47 | 7954 | 2.08 | 82.50 | 45.67 | 13.84 | 113.67 | 156.48 |
| 14 | CMS-104A | 32 | 160.17 | 37.78 | 7893 | 2.33 | 91.67 | 41.83 | 20.67 | 105.00 | 197.33 |
| 15 | CMS -135A | 24 | 127.5 | 31.67 | 3216 | 2.00 | 41.67 | 29.83 | 06.17 | 59.17 | 283.75 |
| 16 | CMS 89A | 25 | 137.33 | 32.72 | 7784 | 2.43 | 95.83 | 54.67 | 20.67 | 73.17 | 440.53 |
| 17 | CMS-103B | 20 | 88.83 | 35.87 | 5618 | 1.73 | 53.33 | 30.17 | 08.34 | 68.84 | 244.24 |
| 18 | CMS-104B | 29 | 156.67 | 40.02 | 4366 | 1.80 | 51.67 | 37.00 | 09.17 | 66.17 | 174.65 |
| R-LINES | |||||||||||
| 19 | R-64 | 18 | 100.00 | 31.75 | 5442 | 1.62 | 61.67 | 39.83 | 07.84 | 61.84 | 217.71 |
| 20 | RCR-1296 | 20 | 122.17 | 34.63 | 5395 | 1.72 | 78.33 | 30.83 | 11.00 | 72.34 | 283.89 |
| 21 | NDR-2 | 22 | 130.00 | 37.72 | 5432 | 1.57 | 62.50 | 30.17 | 08.34 | 79.00 | 250.77 |
| 22 | RES-834-1 | 28 | 155.17 | 37.52 | 5342 | 2.20 | 62.50 | 39.83 | 11.67 | 75.51 | 352.19 |
| 23 | RHA-95-C-1 | 21 | 119.50 | 32.35 | 3724 | 2.07 | 45.83 | 41.33 | 04.49 | 49.91 | 210.76 |
| 24 | RHA-6D-1 | 24 | 123.00 | 34.38 | 5841 | 2.32 | 100.00 | 50.00 | 14.67 | 105.00 | 208.63 |
| 25 | R-64NB | 20 | 121.50 | 30.68 | 5308 | 2.40 | 61.67 | 43.67 | 06.51 | 63.34 | 279.31 |
| 26 | R-630 | 22 | 119.67 | 36.47 | 5006 | 2.42 | 79.17 | 38.00 | 09.17 | 81.01 | 224.12 |
| 27 | GKVK-2 | 15 | 93.67 | 25.55 | 2005 | 1.68 | 45.83 | 41..00 | 03.64 | 42.97 | 240.63 |
| 28 | RHA-23 | 20 | 131.83 | 28.98 | 5399 | 1.68 | 45.83 | 38.00 | 04.67 | 52.84 | 548.77 |
| 29 | AKSF-I-R-6 | 19 | 116.83 | 35.08 | 5030 | 1.67 | 70.83 | 35.00 | 08.17 | 58.34 | 443.84 |
| INBREDS | |||||||||||
| 30 | IB-80 | 27 | 134.67 | 29.8 | 6901 | 2.13 | 100 | 42.67 | 23.84 | 138.18 | 161.12 |
| 31 | TNASF-239 | 16 | 105.17 | 34.00 | 4979 | 1.50 | 65.83 | 36.33 | 09.00 | 66.50 | 321.28 |
| 32 | CSF1-99 | 18 | 125.83 | 33.07 | 4939 | 1.98 | 70.83 | 37.67 | 05.67 | 69.09 | 271.84 |
| VARIETIES | |||||||||||
| 33 | RSFV-901 | 43 | 197.67 | 40.90 | 7664 | 2.17 | 90.00 | 50.00 | 21.64 | 150.47 | 190.79 |
| 34 | CO-4 | 27 | 174.50 | 35.83 | 9718 | 2.10 | 112.50 | 37.83 | 55.34 | 229.51 | 190.55 |
| 35 | COSFV-5 | 18 | 144.00 | 32.93 | 5574 | 1.82 | 75.00 | 39.17 | 09.84 | 73.18 | 352.03 |
| HYBRIDS | |||||||||||
| 36 | KBSH 1 | 29 | 191.00 | 38.97 | 7469 | 2.95 | 91.67 | 46.67 | 22.99 | 133.99 | 257.52 |
| 37 | KBSH- 41 | 32 | 208.33 | 38.7 | 9048 | 2.47 | 133.33 | 56.33 | 20.67 | 170.67 | 303.28 |
| 38 | KBSH-44 | 33 | 195.00 | 37.68 | 10443 | 2.78 | 133.33 | 49.00 | 34.84 | 214.17 | 173.09 |
| 39 | KBSH- 53 | 32 | 197.50 | 33.82 | 10402 | 2.15 | 141.67 | 56.17 | 39.17 | 181.84 | 195.64 |
| 40 | KBSH- 55 | 31 | 198.50 | 37.3 | 8540 | 2.45 | 125 | 52.83 | 48.99 | 218.15 | 199.39 |
| 41 | KBSH-58 | 28 | 176.17 | 32.13 | 6862 | 2.48 | 129.17 | 47.33 | 25.17 | 154.51 | 267.34 |
| 42 | TCSH-1 | 26 | 151.50 | 39.6 | 6484 | 2.22 | 129.17 | 38.33 | 22.50 | 147.34 | 214.92 |
| 43 | TNAUSF-CO2 | 22 | 152.83 | 34.55 | 7130 | 2.28 | 87.5 | 37.17 | 27.51 | 147.76 | 259.24 |
| 44 | RSFH-130 | 24 | 164.17 | 38.48 | 8383 | 2.28 | 141.67 | 49.33 | 33.34 | 172.68 | 180.94 |
| 45 | Phule Raviraj | 24 | 161.67 | 35 | 10681 | 2.37 | 104.17 | 41.83 | 29.65 | 153.49 | 333.74 |
| 46 | SVSH-402 | 29 | 176.50 | 36.85 | 6494 | 2.83 | 95.83 | 59.00 | 37.84 | 188.5 | 163.02 |
| 47 | NDSH-1 | 31 | 177.17 | 34.87 | 8233 | 2.60 | 195.83 | 52.50 | 23.64 | 156.81 | 308.71 |
| 48 | PKSVSH-952 | 25 | 154.33 | 32.73 | 7286 | 2.50 | 129.17 | 41.33 | 42.50 | 167.67 | 231.32 |
| 49 | RSFH-1 | 22 | 140.83 | 35.28 | 11002 | 2.72 | 137.5 | 47.17 | 40.32 | 249.49 | 126.22 |
| SEm± | 0.99 | 5.84 | 2.81 | 946 | 0.19 | 15.94 | 3.33 | 2.16 | 11.06 | 18.70 | |
| CD@5% | 2.81 | 16.52 | 7.96 | 2679 | 0.56 | 45.11 | 9.44 | 6.10 | 31.30 | 52.92 | |
| CV (%) | 5.26 | 5.27 | 11.4 | 19.88 | 12.19 | 26.03 | 10.31 | 17.56 | 14.64 | 17.16 | |
Table S2: The range and mean values for CMS lines, R-lines and inbreds.
| Traits | CMS -Lines | R -Lines | Inbreds | |||
| Range | Mean | Range | Mean | Range | Mean | |
| No. of leaves plant-1 | 9.0-32.0 | 23.0 | 15-28 | 20.00 | 14-27 | 18.00 |
| Plant height (cm plant-1) | 59-167 | 132.5 | 93.7-155.2 | 119.90 | 97-134.7 | 115.67 |
| Leaf area (cm2 plant-1) | 1689.1-8548.1 | 5547.2 | 2005.6-58 41.7 | 4902.80 | 4939.4-6901.6 | 5606.94 |
| SLA (cm2 plant-1) | 46.9-646.71 | 304.6 | 208.6-548.7 | 296.40 | 161.10-321.30 | 251.41 |
| SCMR | 29.2-42.7 | 35.0 | 25.5-37.7 | 33.50 | 18.50-34.00 | 28.80 |
| Stem girth (cm plant-1) | 0.8-2.48 | 1.95 | 1.48-2.42 | 1.90 | 1.38-2.10 | 1.75 |
| Root volume (cc plant-1) | 25-100 | 67.8 | 40.83-100 | 62.92 | 57.50-100 | 73.50 |
| Root length (cm plant-1) | 12.5-54.7 | 36.65 | 21.17-50 | 37.40 | 29.30-42.70 | 36.50 |
| Root dry weight (g plant-1) | 3.8-28.0 | 12.72 | 3.64-14.67 | 7.87 | 4.80-23.80 | 10.80 |
| Total dry matter (g plant-1) | 32.1-116.1 | 109.5 | 37.2-105.0 | 64.95 | 42.84-138.18 | 79.15 |
Table S3: Classification of genotypes based on TDM and root length as high and low types.
| High root length with high TDM | Low root length with low TDM | ||||
| Genotypes | Root length (cm plant-1) | TDM (g plant-1) | Genotypes | Root length (cm plant-1) | TDM (g plant-1) |
| CMS-851A | 49.3 | 67.8 | CMS-10B | 14.3 | 39.2 |
| CMS-103A | 45.7 | 113.7 | CMS-17B | 12.5 | 52.5 |
| CMS-89A | 54.7 | 73.2 | RHA-272 | 21.2 | 37.2 |
| RHA-6D-1 | 50.0 | 105.0 | CMS-135A | 29.8 | 59.2 |
| IB-80 | 42.7 | 138.2 | M-100 | 29.3 | 42.8 |
| RSFV-901 | 50.0 | 150.5 | COSF-1 | 27.7 | 49.7 |
| RSFH-130 | 49.3 | 172.7 | CMS-135A | 29.8 | 59.2 |
| SVSH-402 | 59.0 | 188.5 | |||
| NDSH-1 | 52.5 | 156.8 | |||
| RSFH-1 | 47.2 | 249.0 | |||
Conflict of Interest
The authors declare no conflict of interest.
Ethical Approval
Not applicable
Data Availability
The datasets used in this study are openly available at [repository link] and the source code is available on GitHub at [GitHub link].
Funding
This work did not receive any external funding.
References
Cite this article
Related Research


Special Issue
Launch a focused special issue to highlight research, emerging trends, and expert insights in your academic field.