



IntelliPaper
Abstract
In the early XX century, physicists accepted that Einstein's photoelectric equation was a profound move toward the quantum mechanical description of energy and matter and it is one of the critical equations leading us to quantum physics and mechanics. But looking today the photoelectric effect couldn't be formulated perfectly because the proportionality constant h/e in the equation is linear regression in the very short interval of frequency. Of course, at that time it was. Even now, not only the photoelectric effect but many phenomena haven’t been explained in the aspectof classical physics because of that they are not linear, but cyclical. The photoelectric effect hasn’t been possible to describe precisely without the open hysteresis of the magnetism. In this paper, the open hysteresis of the photoelectric effect, the Fermi-Dirac distribution, the intensity of the quantum photoelectric effect, the saturation, the influences of the various materials on it, and the area of the hysteresis loop are presented. I examine models that can be solved exactly with the tools of mathematics so that neither approximations nor computer simulations are required.
Explore Digital Article Text
I. INTRODUCTION
The photoelectric effect was discovered in 1887 by the German physicist Heinrich Rudolf Hertz. Further research showed that the photoelectric effect represents an interaction between wave and particle that cannot be explained by classical physics, which describes light as an electromagnetic wave. One inexplicable observation was that the maximum kinetic energy of the released electrons did not vary with the intensity of the light, as expected according to the wave theory, but was proportional instead to the frequency of the light. What the light intensity did determine was the number of electrons released from the metal (measured as an electric current). Another puzzling observation was that there was virtually no time lag between the arrival of radiation and the emission of electrons. [1] [2] The photon produces the photoelectric effect. The energy resource of the photon is described by the Planck relation. The Planck relation [3][4](referred to as Planck's energy–frequency relation, [5] the Planck relation, [6] Planck equation, [7] and Planck formula, [8] though the latter might also refer to Planck's law [9]) is a fundamental equation in quantum mechanics which states that E, known as photon energy, is proportional to its frequency, v:
Equation (1) is defined as (1)
Where is Planck's constant
Do the photon's energy and photoelectric effect have this simple relationship? I doubt it. It is imperfect because the Planck relation and photoelectric effect must not be linear but cyclical. This is where problems begin. Planck himself had suspected Formula (1) is linear. So, he developed the nonlinear law of the spectral density of electromagnetic radiation emitted by a black body. But Planck's theory is flawed. [10] Whereas Einstein wasn't hesitated by Formula (1). Consequently, Einstein's law of the photoelectric effect is also incorrect.
The research aims to present a new description of the photoelectric effect, Fermi-Dirac distribution, the intensity, saturation, area (total energy) of the photoelectric effect, and the influences of various materials on it. Since 2018, in the frame of the project Supreme Theory of Everything (hereafter STE) we have been able to publish some articles concerning open hysteresis, Newton's and Planck's laws, climate change, the fate of the Universe, moreover, Early Mongolian calculus, problems in complex number, and so on.
We scour cooperation and financial support for this perspective project.
II. DISTRIBUTION OF ELECTRONS DURING THE PHOTOELECTRIC EFFECT
2.1 Fermi-Dirac Distribution for The Photoelectrons
There are two methods to determine the distribution of the photoelectrons: Fermi-Dirac statistics and open hysteresis. The open hysteresis is written in Section 3.
The Fermi-Dirac distribution applies to fermions, particles with half-integer spin which must obey the Pauli exclusion principle. [11] Energy distribution in the atom is described by Fermi–Dirac statistics [12], which was first published in 1926 by Enrico Fermi [13] and Paul Dirac. [14] According to Max Born, Pascual Jordan developed 1925 the same statistics, which he called Pauli statistics, but it was not published on time. [15] [16] [17] According to Dirac, it was first studied by Fermi, and Dirac called it "Fermi statistics" and the corresponding particles "fermions". [18] F–D statistics was applied in 1926 by Ralph Fowler to describe the collapse of a star to a white dwarf. [19]. In 1927 Arnold Sommerfeld applied it to electrons in metals and developed the free electron model, [20], and in 1928 Fowler and Lothar Nordheim applied it to field electron emission from metals. [21] Fermi–Dirac statistics continues to be an important part of physics.
Electrons are fermions. Therefore, the Fermi function provides the probability that an energy level at the atom, E, in thermal equilibrium with an extensive system, is occupied by an electron.
Let's look closely at how physics describes this probability because of that we can never count electrons. So, Fermi-Dirac statistics gives us the probability of electrons or fermions in some energy levels. The system is characterized by its temperature, , and its Fermi energy, . [22]
The Fermi function is given by
Where is Fermi level, and T is Kelvin temperature.
Equation (2) is the Fermi-Dirac distribution function at various temperatures in semiconductor physics.
-
. Its probability of finding the electron is 1 or 100%.
-
It shows the probability of o above the Fermi level. It means there are no electrons above the Fermi level.
-
; . The probability is .
is undefined mathematically. But according to Early Mongolian calculus, it is equal to o (Table 1) [23]:
Table 1: Division by zero in Early Mongolian calculus
| Number of cutting | Slice | Comment |
| 10/0 | 10 | There is no action of division. So, the numbers are unchanged. |
| 1/0 | 1 | |
| 0/0 | 0 | |
| -1/0 | -1 | |
| -10/0 | -10 |
{"image_source":{"path":"images/5e70640770e6fb6659d89e53e1669ff2c19ea81808e8779bf83e7f415abca91d.jpg"},"content":"","chart_caption":[{"type":"text","content":"Figure 1: Plot Fermi-Dirac distribution function [24]"}],"chart_footnote":[]}
Figure 1 shows that electron distribution has saturations and energy distribution increases by the temperature or intensity. It is a good method. The results of our method are the same Fermi-Dirac distribution as shown in Subsection 3.2.
2.2 Einstein's Photoelectric Effect
Albert Einstein formulated in 1905 a new corpuscular theory of light in which each particle of light, or photon, contains a fixed amount of energy, or quantum, that depends on the light's frequency. [1][2] He also used Equation (1) to describe the law of the photoelectric effect, but it remained linear. Second, both Planck's and Einstein's theories have no derivations. I have heard somewhere that a law of physics without some form of formula extraction, is not a law of physics, just some magic.
And the logic is also weak: How difficult is it to derive a simple linear law of the form expressing an energy balance of energy in and energy out? Is it impossible to derive the law using a wave model of light? [25] The photoelectric effect is a phenomenon in which electrically charged particles are released from a material when it absorbs electromagnetic radiation. The effect is often defined as the ejection of electrons from a metal plate when light falls on it. In a broader definition, the radiant energy may be infrared, visible, or ultraviolet light, X-rays, or gamma rays; the material may be a solid, liquid, or gas; and the released particles may be ions (electrically charged atoms or molecules) as well as electrons. [1] The photoelectric effect refers to the change of electrical conduction properties in matter induced by light and other forms of electromagnetic radiation. To induce this effect, the absorption of incident light by matter should cause a generation of charged carriers, such as conduction electrons and positive holes in the case of a semiconductor, or free electrons (photoelectrons) emitted from a metal surface with immobile positive ions left behind. These two phenomena are called the internal photoelectric effect and the external photoelectric effect, respectively, the mathematical concept was referred to as Einstein's Photoelectric Equation. [26] [27].
Equation (3) was referred to as Einstein's law of the photoelectric effect. According to this equation, maximum kinetic energy depends linearly on v and is independent of the intensity of radiation.
 Since
Since
cannot be negative hv greater than or writing the equation in terms of stopping potential ( ).
6)
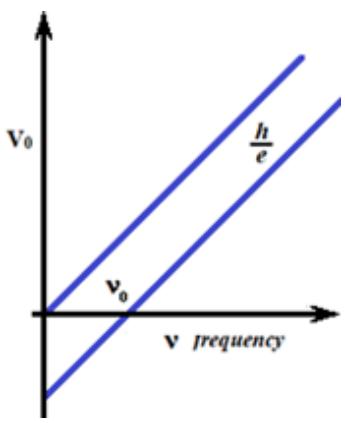
The graph of versus v is a straight line with a slope equal to h/e and intercept on X - axis .
Figure 2: The proportionality constant [28-31]
Einstein's law of the photoelectric effect didn't reflect the Fermi-Dirac distribution.
III. A NEW DESCRIPTION OF THE PHOTOELECTRIC EFFECT IN THE SUPREME THEORY OF EVERYTHING
3.1 A New Formula of the Open Hysteresis
Fermi-Dirac distribution is a statistical method for the calculation of unaccountable electrons. We have processed newly formula based on the hysteresis of the electromagnetic phenomenon (Formula (7)). It is the Formula of open hysteresis including the Fermi-Dirac distribution. [32] [33] [34]
According to the STE the amplitude or intensity of the photoelectrons is determined by different intensities (temperatures):
Where t is the intensity of the photon energy or amplitude of the function or the thickness of a flat slab through which passes the light, is the incident angle of the photon and x denotes the degrees of a circle. denotes the external influence or applied energy, or force.
Equation (7) may be written by the degree of a circle, but it is expressed by frequency (Equation (8)) as next:
Where is the frequency of the incident photon, is the frequency of the refraction ray to the electron, and T is the period of a circle.
The calculation results display in Figure 3.
3.2 Intensity of The Photoelectric Effect and Fermi-Dirac Distribution
To simplify the understanding of photoelectric effect we use Equation (7) without the external forcing shown in Subsection 3.2 and Subsection 3.3. In the photoemission process, when an electron within some material absorbs the energy of a photon and acquires more energy than its binding energy, it is likely to be ejected. If the photon energy is too low, the electron is unable to escape the material. Since an increase in the intensity of low-frequency light will only increase the number of low-energy photons, this change in intensity will not create any single photon with enough energy to dislodge an electron. Moreover, the energy of the emitted electrons will not depend on the intensity of the incoming light of a given frequency, but only on the energy of the individual photons. Part of the acquired energy is used to liberate the electron from its atomic binding, and the rest contributes to the electron's kinetic energy as a free particle. [35][36] Because electrons in a material occupy many different states with different binding energies, and because they can sustain energy losses on their way out of the material, the emitted electrons will have a range of kinetic energies. The electrons from the highest occupied states will have the highest kinetic energy. In metals, those electrons will be emitted from the Fermi level. [1] The intensity is the same as the temperature (H). Equation (8) exhibits the different intensity of the electron ejected and their Fermi-Dirac distributions (Figure 3)
{"image_source":{"path":"images/db1f4ebad650bbde0c25f183b94cab098464b3b47a1eddaf2ca28ab7a3d8547c.jpg"},"content":"","chart_caption":[{"type":"text","content":"Figure 3: Intensities of the incident quantum energy of a photon or Fermi-Dirac distribution of electron energy"}],"chart_footnote":[]}
The electrical current saturation doesn't change by the intensity of photon energy. The intensity of the light increases between the angle of and decreases from to . However, the high intensity is higher between to and lower between , contrary, the low intensity is lower between and , and higher between and .
More specifically, Figure (3) exhibits the Fermi-Dirac distribution described by Equations (7-9) and it locates between and .
Fermi function is a sigmoid function which is a mathematical function having a characteristic "S"-shaped curve or sigmoid curve. [37]
Another calculation result is plotted in Figure 4. The curve illustrates beautiful real data which proves the nature of the photoelectric effect. There isn't a discrepancy or any regression.
The curve (denoted by red dots) reveals not only the real principle of the Fermi-Dirac function but open hysteresis of the photoelectric effect.
We see that the regression on any graph eliminates the live behavior of nature. It is a poor method of statistics.
{"image_source":{"path":"images/96e2daa36de6421bc8b3e1f2a5d50e304705eddb2c30d3b4a20d6e8a7cd2cc07.jpg"},"content":"","chart_caption":[{"type":"text","content":"Figure 4: The Fermi function at three different frequencies [38]."}],"chart_footnote":[]}
This is a nice diagram from [38] that demonstrates how STE works.
3.3 The Saturations of Photocurrent in the Photoelectric Effect
the frequencies or wavelengths. The trigonometric phase displacements in Formula (10) exhibit the saturation of current as shown in Figure 5.
From Figure 3 we can see the saturation of the current lies at 90, 270, and 450 degrees, which are
{"image_source":{"path":"images/ac0b806abbdd3a570eb0007abbe96ba0b02d39c72e49fd65f985d1f4ac1284bb.jpg"},"content":"","chart_caption":[{"type":"text","content":"Figure 5: Influences of the phase displacement on the saturation of the electric currents"}],"chart_footnote":[]} From Figure 5 the phase changes are 2 times (a1(x)), 4 times (a2(x)), and 8 times (a3(x))
shorter than . The values of the phase decide the material quality of the magnetic materials. A (x) and a1(x) illustrate the hard magnetic material, and a2(x) and a3(x) indicate the soft magnetic, respectively.
3.4 The Influences of the Various Materials on the Photoelectric Effect
Let the external forcing is active. Equation (7) and Equation (8) are expressing not only a cyclic, periodic nature with memory, saturations, and singularities (Figure 3). But it exhibits the impacts of the material quality on the photoelectric effect (Figure (6)).
The photon has gone already on the surface of the metal and gives constant kinetic energy to electrons (yellow zone). But the frequency further increases, and the working function of the electron increases (Figure 6). In other words, photon energy expends only for the working function of the electron eject.
We see the emitted electron's working function and kinetic energy exist simultaneously at a given frequency.
Because of that, the photoelectric effect consists of working energy and kinetic energy simultaneously at every frequency. We experience no time lag between the arrival of radiation and the emission of electrons. Second, light, particle, or wave, still needs no pre-existing medium. [35] What it means is that the photoelectric effect needs no pre-existing medium.
One inexplicable observation of the photoelectric effect is the high influences of the different materials which are described by Equation (11) and Equation (12). It is also Fermi level exhibits shown in Figure 7 and Figure 8.
Where b is the energy state which differs in various materials.
{"image_source":{"path":"images/bc562315c6fc9a5d8157c8ec90a3d1d9211af70c97a39cde4ba4f5a3e73008ae.jpg"},"content":"","chart_caption":[{"type":"text","content":"Figure 6: Working function (light blue color) and kinetic energy (yellow) of an electron at a frequency in the open hysteresis"},{"type":"text","content":"Term b is nothing more than the influences of different materials over the Fermi level."}],"chart_footnote":[]} When the photoelectrons are produced, however, their number is proportional to the intensity of light. [39] [40]
There is a cut off frequency, but neither proportionality constant h/e, nor a Planck constant anywhere.
{"image_source":{"path":"images/be8d23bfaa80cad6fe01ab219fa155a24cb7e420b3dfabd1a09ba32fbc928505.jpg"},"content":"","chart_caption":[{"type":"text","content":"Figure 7: Fermi-Dirac distributions of the photoelectric effects in the different materials (blue lines are the proportionality constant (h/e) as in Einstein's equation)"}],"chart_footnote":[]} {"image_source":{"path":"images/829e1514568bec95bb795ec14d67ab772782d0cfec76571ba95b292f27dd7526.jpg"},"content":"","chart_caption":[{"type":"text","content":"Figure 8: Threshold frequencies of the various materials in the photoelectric effect"}],"chart_footnote":[]}
Figure 7 and Figure 8 illustrate that there is a definite cut-off frequency below which electron cannot be ejected by any substance. The kinetic energy of emitted electrons depends on the frequency of incident light on the substance. There is no stopping potential because it determines by the eigenvalue of a circle.
Einstein's approach is a linear regression (blue) for the photoelectric effect. and showed in Equation (11) change for different materials (Figure 9).
And the horizontal axis is the Fermi level.
The value of (our symbol is ) depends on the type of metal used. Figure 8 illustrates the present scientific concept. [30] [31] [40-42] As shown in Figure 7 the high-intensity purple light will eject many high-energy electrons. The low-energy red light hits the metal as low-energy photons. These photons "bump" low-energy electrons off of the metal. If the intensity of the light increases, then more low-energy photons hit the plate and more low-energy photons are ejected. By shining the high-energy blue light on the plate, high-energy photons hit the plate and energetic electrons are knocked off. [38]
See the following Subsections for why open hysteresis is the basis of the photoelectric effect.
3.5 Area of the Hysteresis Loop
The area of the hysteresis loop indicates the total energy of the photoelectric effect. The calculation of the hysteresis loop area was impossible. How can we calculate the area enclosed by the hysteresis loop? It has not been resolved until now without opening the hysteresis. Multitude theories and models were born for clarifying the hysteresis problem for a long time. Finally, the hysteresis loop opened in 2018. [32]-[34] [43-47] Its Formula has displayed in Equation (7) and Equation 8).
If we are interested in the spin-up, and spin-down electrons their open hysteresis is written by the STE by Equation (13) (Figure 9) as follows:
Where is Fermi energy, is the phase displacement
Formula (13) itself includes the spin-up and spin-down energies selectively by frequency (Figures 9a and 9b). If the influences of the materials on the photoelectric effect are important that b parameter is inserted into the total energy formula.
Hence, the total energy of the electron ejected is described by the area of the hysteresis loop (Figure 9c) as follows:
Where b is the material constants {"image_source":{"path":"images/4bb3f968a76aa3bd74677bee3e74daafc8f3a1932c589bd4692112542e8ac28f.jpg"},"content":"","chart_caption":[],"chart_footnote":[]}
{"image_source":{"path":"images/2001aeaa6f7c0dcc37f765c407971fbbb8ecf5e0b511b9b3b67ba8a7e26127d8.jpg"},"content":"","chart_caption":[],"chart_footnote":[]} {"image_source":{"path":"images/f9691e6de23a4cfc296e96ce105644f4f70344720352d46b95349d76f3befbc9.jpg"},"content":"","chart_caption":[{"type":"text","content":"a) Left reverse hysteresis and b) right reverse hysteresis and"},{"type":"text","content":"c) open hysteresis of the right reverse transition [10] [32]-[34] [43]-[47]"}],"chart_footnote":[]}
The area of hysteresis gives the amount of energy lost in applying the external magnetic field. Large the area, the more energy is lost. The lesser the area, the least energy is lost. Depending upon the amount of area of the curve, the magnetic materials are classified into two types: Soft magnetic materials, and hard magnetic materials.
The area under the hysteresis curve gives us the energy loss or work done in magnetizing and demagnetizing a ferromagnetic substance up to several teslas to determine its coercivity and retentivity. [48].
IV. CONCLUSION
Based on the above materials we conclude as next:
i. The ultimate formula of the photoelectric effect is:
ii. The energy of the photon is constant during the photoelectric effect which is not linear but it changes cyclically.
iii. The intensity of the electron differs in every quarter of a circle. For example, the intensity of the electron increases between the angles of and decreases from to . But we see that the high intensity of the electron is higher than the lower intensity from to , and is lower than the low intensity of the electron from to ( ).
iv. There is a definite cut-off value of frequency below which electrons cannot be ejected. Every material has its cutting frequency.
v. There is no stopping potential in the photoelectric offset.
vi. The working energy of emitted electrons depends on the frequency of incident light (photon).
vii. The energy of the photon or kinetic energy of the ejected electrons is described by the area of the hysteresis loop.
viii. The open hysteresis of the photoelectric effect has a memory and saturation limit of frequency.
Conflict of Interest
The authors declare no conflict of interest.
Ethical Approval
Not applicable
Data Availability
The datasets used in this study are openly available at [repository link] and the source code is available on GitHub at [GitHub link].
Funding
This work did not receive any external funding.
References
Cite this article
Related Research




Special Issue
Launch a focused special issue to highlight research, emerging trends, and expert insights in your academic field.
