




IntelliPaper
Abstract
This research paper aims to develop a mathematical model that employs Extreme Value Theory (EVT) and Risk Measures to estimate and forecast significant fire insurance claims. The primary goal is to provide insurance companies with a more accurate understanding of the potential risks associated with substantial fire-related losses.
The study incorporates a three-parameter Generalized Pareto Distribution (GPD) within the EVT framework to assess insurer risk concerning catastrophic fire events. The importance of evaluating fire-related financial losses for insurers is emphasized, especially given the impact of infrequent yet impactful extreme events on overall loss trends.
By applying EVT techniques, including the GPD and Peaks Over Threshold (POT) method, to a historical dataset of fire insurance claims, the study effectively models the tail behavior of large losses. Parameters obtained from these models facilitate the calculation of probabilities for extreme loss occurrences, thereby enhancing risk management and pricing strategies for insurance firms. The results demonstrate the EVT approach’s effectiveness in accurately modeling and estimating the risk associated with significant fire insurance claims. This research contributes to the insurance domain by presenting an enhanced mathematical and statistical framework for modeling substantial fire insurance claims. Such an approach enables insurers to better comprehend the potential financial implications of rare fire incidents, leading to more informed risk evaluation and resource allocation.
Explore Digital Article Text
I. INTRODUCTION
In the course of a lifetime, exceptional occurrences can emerge that are entirely unprecedented. These occurrences are unexpected and are likely to repeat in the future. For instance, we can consider the historical China floods of 1931 or the 2004 Indian Ocean disaster, along with the recurring catastrophic floods in the lower Shire region of Malawi and the devastating effects of Cyclone Fredd in 2023 where lives and properties where lost. Such events lead to significant infrastructural harm, including damage to buildings, roads, bridges, and power lines. This brings about disruptions in essential services such as transportation, communication, and utilities, coupled with the unfortunate loss of numerous lives. These rare events do not only cause great damage and loss of lives but also their effects are widespread throughout all sectors of the economy including the financial sector of which insurance companies are of great concern [19]. Hence, modelling the behaviour and the distribution pattern of these extreme and unusual events is of great importance in electing early warning systems and risk management applications. Extreme events such as catastrophic floods, fires and disease outbreaks do not occur frequently. However, their occurrence result in huge losses and since they rarely occur, many people do not take time to insure against them. A couple of studies and insurance companies have over the years tried to compile and analyze data to enable them handle these catastrophic events [3, 16, 7, 18]. Yet, they have challenges in putting necessary reserves and appropriate level of reinsurance which could later on lead many insurers insolvent when catastrophic losses reoccur. Inadequate loss reserves often stand out as a frequent cause of insolvency [5]. A number of researchers have modelled the impact of surgency of insurance claims on the operation of insurance companies. For instance, the work of [2] modelled catastrophe claims with left truncated severity distributions and modelled event frequency with a non-homogeneous poissoin process and later used the model for forecasting. Similarly, [10] studied claim severity of extreme fire insurance claims for tariffication using extreme value theory (EVT) and generalised linear models (GLM). They then suggested that GLM do not work adequately for extreme claims and revealed that peaks over threshold methodology from extreme value theory (EVT) using a two-parameter generalised pareto distribution (GPD) as an accurate distribution for large insurance claims. On modelling rare and catastrophic events and their impacts in finance and insurance applications, many studies have achieved promising results by using different approaches. For instance, in a study by [20], large motor insurance claims in Kenya was modelled using the extreme value theory. Their study concentrated on the right tails of the underlying distribution (extremely large observations) and they fitted a generalised pareto distribution (GPD) which is a family distribution in EVT. Their empirical findings revealed that modelling extreme outcomes under EVT theory outweighs other methods of estimation such as econometric methods, as EVT is known for its ability to model the tail area of the distribution where extreme outcomes are located much better. Similar results were obtained by [11] who tried to investigate the tail behaviour of the extreme outcomes in the US stock market using EVT. The study concluded that, S&P 500 daily return data can also be characterized by GPD. However, the commonality in these above studies is that they all used two parameter GPD in modelling the extreme outcomes. Likewise, [13] modelled large flood insurance claims in Zimbabwe using frequency and severity models, their study presented a framework for choosing the most suitable probability distribution which they later fitted it to the past claims data and the parameters were estimated using maximum likelihood method (MLE). According to their findings, Pareto and Negative Binomial model provided the best fit to claims severity and frequency respectively. In the same pursuit, [15] estimated the risks of extremely large fire insurance claims using a Markov Chain monte Carlo approach. They proposed a Bayesian method using Markov Chain Monte Carlo techniques to calculate probabilities of large fire losses and demonstrated its potential advantages for actuarial and risk evaluations. Amongst emerging researchers, [14] modelled the frequency and severity of auto insurance claims using statistical distributions. Their paper presented a methodical framework for choosing a suitable probability model that best describes automobile claim frequency and loss severity as well as their application in risk management. Their findings from empirical analysis indicated that claims severity distribution is more accurately modeled by a skewed and heavy-tailed distribution. In a recent investigation conducted by [8], an examination was carried out on the behavior of extreme returns within the South African Industrial Index (J520) spanning the years 1995 to 2018. The study leveraged the Generalized Extreme Value Distribution (GEVD) to assess and estimate extreme risk measures. Their research outcomes revealed that across distinct quarterly return periods (8, 20, and 40 quarters), the approximated values for extreme losses were , , and respectively, whereas the potential levels of extreme gains during these same periods were noted as , , and .
Due to increasingly severe world catastrophes in the last two decades the property insurance industry has paid out over $125 billion in losses [17]. In 2004, property insured losses resulting from natural catastrophes and man made disasters, excluding the tragic tsunami of December 26, amounted to $42 billion, of which 95% was caused by natural disasters and 5% by man-made incidents such as fire. These huge billion-dollar figures call for very accurate models of catastrophe losses. Even small discrepancies in model parameters can result in underestimation of risk leading to billion-dollar losses to either insurer or the reinsurer. Therefore, employing suitable mathematical and statistical models, along with a thorough analysis of catastrophic data and precise estimation of claim frequency and severity distributions, holds the essential solution for accurately assessing costs and the probability of financial distress for insurers . Even though the methods used in existing literature are helpful, there has been no studies on linking a three-parameter GPD under EVT and measures of risk such as Value at Risk (VaR) and expected shortfall (ES) for estimating probabilities and magnitude of large event outcomes in Malawian Insurance industry. Hence, the motivation behind this investigation lies in the need to comprehend and analyze the patterns underlying the severity of fire-related losses arising from significant insurance claims. The primary objective is to develop a robust model that captures the intricate dynamics of such losses and further assesses the potential for encountering exceedingly rare and severe fire-related losses. The pursuit of this research stems from its potential to equip insurance firms with valuable insights. Specifically, this inquiry can empower insurance companies to predict the potential magnitude of losses that might be incurred across a specific customer base within a defined timeframe. These predictions hold substantial value in guiding the processes of pricing and risk management for insurance firms operating in the non-life sector.
In this paper we present a modelling framework for insurance losses resulting from catastrophic fires in the property insurance industry, which will aid in forecasting insurance risk and liabilities. By doing this, we also seek to derive distribution model of fire loss under EVT, fit fire claims to the loss distribution model for estimating probabilities and magnitude of large fire loss and then forecast expected insurance loss due to risk of fire loss. The results of this study will provide academicians and other researchers with a strong foundation in a wide range of mathematical and probabilistic methods for risk modelling in general insurance, model-based pricing, risk sharing, ruin theory and credibility. Insurance regulators around the world, like the Reserve Bank of Malawi through Insurance Act 2017, requires that every commercial building be insured against collapse, fire, earthquake, storm and flood. Henceforth, Modelling fire loss severity will help insurance companies to make a framework for new product development and make data-driven projections of future fire losses. The rest of the study is organized as follows: chapter two explains the Methodology adopted in the study. Chapter three gives the Empirical Results and Discussions. Finally chapter four gives Conclusions and Recommendations of the study.
II. MATERIALS AND METHODS
The research relied on fire loss data, encompassing claim amounts, extracted from Reserve Bank of Malawi (RBM) and NICO General Insurance. NICO was chosen due to its prominence as the largest General Insurer in Malawi based on market capitalization. The Reserve Bank of Malawi (www.rbm.mw) served as the regulatory authority for the country's insurance sector. Our focus centered on fire insurance claim data, specifically examining claim amounts disbursed (referred to as claim-size). The data collection period spanned from January 2005 to December 2021. The modeling process centered on a 10-year dataset spanning 2011 to 2021. Data organization and analysis were conducted using Microsoft Excel and the R programming package.
2.1 Model Specification
[20] used Extreme Value Theory(peaks over threshold modelling) for modelling large motor insurance losses due to accident claims of Kenindia Insurance Company in Kenya. They fitted a two-parameter GPD under EVT and revealed that it gives a more satisfactory fit to large motor insurance claims. The purpose of this study is to model the risk of large losses in an insurance portfolio due fire damage in commercial property. In light with this, the study adopted and refined the Extreme Values Model used by [20]) by extending the model to a three-parameter GPD. The two-parameter GPD model used by [20] is specified as the function defined as follows:
where:
is the scale parameter
is the shape parameter
X represents the motor claim amount.
In EVT we consider a random variable say X and fix a threshold u and focus on the positive part of X - u (since we are focusing on the upper tail, where large outcomes are located). This distribution—that is, in EVT theory is given by;
The key result in EVT is that as the threshold converges to GPD, ;
where is the scale parameter; and when and
In the present study the model was re-specified by using a three-parameter GPD under EVT framework and incorporating risk measures such as value at Risk and Expected Shortfall for estimating risk of extreme fire loss in an insurance portfolio. This will enhance the accuracy of the estimates as compared to 2 parameter GPD, with the added location parameter. The three-parameter GPD in this study is specified as follows;
where X = claim amount or fire loss random variable, u = location parameter = scale parameter = shape parameter
The generalized Pareto distribution (GPD) approach is based on the idea that EVT holds sufficiently far out in the tails such that we can obtain the distribution not only of the maxima but also of other extremely large observations . Nevertheless, this theorem fits our study since we are attempting to analyze rare and large event outcomes, which in this case are catastrophic fires leading to huge insurance loss. Extreme Value Theory (EVT) is concerned with the mathematical and statistical analysis of extreme events hence a perfect fit to the present study.
2.2 Parameter Estimation and Derivation of Three-Parameter GPD
In this study the derivation of the parameters of GDP loss distribution will be done using the maximum likelihood estimation (MLE). MLE is commonly applied for estimation in a variety of problems. According to , MLE yields better estimates as compared to other methods like, least squares technique and methods of moments. They argued further that MLE method fully utilizes all information about parameters contained in the data.
Suppose random variables (fire claim amounts) X{1}, X{2}, \ldots, X{n} form a random sample from a pdf f(x|\theta). We define the joint density function f(x{1}, x{2}, \ldots, x{n}|\theta) as the likelihood function. The likelihood function depends on the unknown parameter \theta (or a vector of parameters), is always denoted as L(\theta);
The goal of maximum likelihood estimation (MLE) is to find the values of the model parameters that maximizes log likelihood function over the parameter space. Thus, estimating parameter with MLE principle gives;
The density function for the three-parameter Generalized Pareto Distribution (GPD) is given by:
Here, the tail index is denoted as , and the study focuses on the case where .
The transformation used is or . This leads to the expression , with a Jacobian of for . Consequently, the density of the transformed variable follows a Pareto distribution with density for and .
The Type I Pareto distribution is defined as for and , where is the shape parameter and is the scale parameter.
The log-likelihood function for Maximum Likelihood Estimation (MLE) is given by:
Maximizing the log-likelihood function entails adjusting to , ensuring that is not larger than the smallest value of x in the dataset.
The parameter estimate for is determined by equating the derivative of the log-likelihood function to zero, yielding:
This results in the expression:
For a Generalized Pareto Distribution estimated from a Type I Pareto distribution, the Maximum Likelihood Estimators (MLE) for and are:
Whare the mean and variance of GPD estimated from these parameters are:
Mean for
Variance =
2.3 Determination of Threshold (u)
Several methods have been proposed to determine the optimal threshold. The most common approach is the eyeball method where we look for a region where the tail index seems to be stable. More formal methods are based on minimizing the mean squared error (MSE) of the Hill estimator (i.e., finding the optimal point), but such methods are not easy to implement . Hence, a more easier and reflective method to determine u, is the mean excess loss function , defied as the average excess of the random variable X over the threshold u . Hence, this study will employ mean excess plot to determine threshold. Here we shall plot the mean excess function (MEF) defined as;
where u is the threshold value, and denotes total number of values that which exceed the threshold in the same line of thought, [6] argued that the mean excess function of the GPD is a linear function of threshold u, they further claimed that the reasonable way to determine the threshold u, is to find values over which the sample mean excess function is approximately linear.
2.4 Generalized Pareto Distribution (GPD) and Risk Measures Estimation
The distribution function of the three-parameter GPD is expressed as:
Let , which represents the excess loss over the threshold . The probability that the random variable exceeds the threshold is given by , and the probability that given that is . Therefore, the unconditional probability that will be obtained by:
According to Lee (2012), can be estimated by the empirical estimator , where n is the total number of observations and k is the number of observations exceeding the threshold value u. Hence, the probability will be given by:
This can be further simplified to:
Such that the tail estimator for the distribution function will be given by:
Value at Risk (VaR) is the 100th percentile of a of an insurance portfolio due to the risk of fire loss distribution (Klugman, 2013). It is defined as the will be calculated as follows:
Therefore,
2.4.2 Expected Shortfall (ES) on GPD
Expected Shortfall (ES), also known as Tail Value at Risk (TVaR), is an extension of VaR. It captures the average loss given that the loss is greater than VaR (Klugman, 2013). At p% level, it may be defined as the expected loss in the worst p% cases. For instance, is the expectation of the worst 10 cases out of 100 cases (Lee, 2012). Mathematically, the expected shortfall of an insurance portfolio due to the risk of fire loss in this study will be calculated as follows:
If X is continuous at , then:
For the GPD case, the expected shortfall will be estimated as follows:
Therefore,
2.4.3 Study Assumptions
The study assumptions encompass three key aspects: firstly, the continuous and independently identically distributed nature of claim amounts ; secondly, the absence of claim handling expenses in the data, focusing solely on paid fire losses; and thirdly, the adherence to extreme value theory (EVT) principles, indicating that the data is not normally distributed. In accordance with this theory, we therefore tested normality of data, and we found out that our data was indeed not normally distributed hence consistent for modelling.
III. EMPIRICAL RESULTS AND DISCUSSIONS
This section presents and discusses the empirical findings of the analysis and modelling of large fire insurance claims and estimation of risk measures based on three parameter GPD under extreme value theory. For analysis of the modelling procedure the study used quantitative claim size data collected from RBM and NICO ranging from 2011 to 2021. Some basic data cleaning was applied using Ms Excel where claim records with missing values and duplicates were removed. The data obtained were exported to R statistical package for further analysis.
3.1 Exploratory Data Analysis
Descriptive analyses are important since they provide the foundation upon which correlation and experimental studies emerge. They also provide clues regarding the issues that should be focused on to help for further studies . Therefore, the descriptive statistics of the data used in this study is calculated to get a fair idea about the data before the analysis. Table 1 presents the Number of Observations, Mean, Kurtosis, Skewness, Minimum and Maximum Values of claim amounts paid. There are 846 observations of the variable claim amount. The average claim payment is MK2,168,100. Minimum and Maximum observations are MK25,000 and MK59,113,780 respectively. The value of the Skewness is greater than zero, this indicates the existence of fat tails/heavy tails in the data. There exist large observations (outliers) in the right tail of the distribution curve which is consistent with the underlying assumption of Extreme Value Theory (EVT). Likewise, Kurtosis is greater than 3, this means data is not normally distributed hence we can proceed for analysis based on the assumptions of the EVT. 13
Table 1: Descriptive Statistics
| Mean | 2168.10 |
| Standard error | 117.95 |
| Median | 1060.46 |
| Mode | 2500.00 |
| Standard deviation | 3430.77 |
| Sample variance | 11770205.49 |
| Kurtosis | 96.94 |
| Skewness | 7.31 |
| Range | 59088.78 |
| Minimum | 25.00 |
| Maximum | 59113.78 |
| Count | 846.00 |
Besides noting that our data is not normally distributed from descriptive statistics, we further tested for normality using a diagnostic test, Pearson chi-square test for normality at 5% significance level. We therefore obtained a p-value less than the significance level leading to rejecting null hypothesis. The test revealed that our data was indeed not normally distributed and inline with EVT assumption as shown in Table 2 below.
| Test | Hypothesis | Alternative Hypothesis | Test Statistic | P-Values |
| Pearson Chi-square | Data is Normal | Data not Normal | 1623.9 | $2.2 \times 10^{-16}$ |
In Figure 1, we observe that fire loss data is skewed to the right and uneven variability of claim observations as seen on x-axis,(that is, data being heteroskedastic). This gives the insurance company a hard time to predict expected losses and returns as they are operating on extreme values of making a profit or loss hence more risky in case of huge fire loss. We also observe that the distribution of claims is positively skewed, suggesting that small fire losses occur quite frequently and very large losses occur less frequently but they are catastrophic.
According to , a more useful visualization of data can be obtained using logarithmic scale for the x-axis (or even both axes). This is performed by plotting the Empirical Complementary Cumulative Distribution Function (ccdf), that is, the empirical probability of the claims exceeding any given threshold, sometimes also referred to as the Survival function as shown in Figure 2. This (Figure 2) shows the empirical distribution of claim settlements. The tails are nonlinear implying the Pareto behaviour (power law) and extreme value theory can be confirmed. Extreme Value Models are known to be heavy tailed. According to EVT theory, extreme observations in a given sample data follow the tail of an EVT distribution called Generalized Pareto Distribution GPD. Hence, there is a possibility that our data of large fire insurance claims follow the tail of a GPD as evidenced by the Pareto behaviour in the data.
{"image_source":{"path":"images/66e7ae26412d4ac26679b075b1bd52c00794001e574e4ebbead5364ce22fa1a9.jpg"},"content":"","chart_caption":[{"type":"text","content":"Histogram of Fire_Claims$Claim_Size"},{"type":"text","content":"Figure 1: Histogram of Fire Losses"}],"chart_footnote":[]}
3.2 The Mean Excess Function and the Determination of the Threshold
Now that we established that the data is fat-tailed and follows a power law, we turn to fitting a GPD distribution to the threshold exceedances. However, before performing that we need to determine an appropriate threshold (a starting point where we shall assume any claim beyond it as being extreme/large). In the figure 3 below, we plotted Mean Excess Function to confirm convergence of
GPD to any given threshold. The resulting plot looks fairly linear across the whole spectrum of losses. Nonetheless, a small kink just below MK5,000,000 is observed indicating that smaller losses follow a somewhat different law/distribution. A fairly linear region can be observed between 0 and MK5,000,000; above MK5,000,000 the data becomes sparse. Therefore, a threshold of MK5,000,000 was considered as a reasonable choice that is consistent with Mean Excess Function under EVT.
{"image_source":{"path":"images/18d27045db8eb1d118506e12c3e629411b6ffb652f7b4a342a20d713f525b003.jpg"},"content":"","chart_caption":[{"type":"text","content":"Figure 2: Complementary Cumulative Distribution Function"}],"chart_footnote":[]}
{"image_source":{"path":"images/9f13b33c561fc13311ba86a0c69b0b8facbf512d277d374b339cd34901605619.jpg"},"content":"","chart_caption":[{"type":"text","content":"Figure 3: Mean Excess Function Plot against Thresholds"}],"chart_footnote":[]}
Since the empirical distribution was non-linear implying the Pareto behaviour, we were justified to fit a Generalised Pareto Distribution (GPD) to the tails of fire loss data. The data was fitted to a GPD model using Maximum Likelihood Estimate as shown in Figure 4. The parameter estimates are U = 2167, and as shown in Table 3. The shape parameter is greater than 0 implying heavy tailed distribution followed by the data. The distribution for the excesses shows a smooth curve (see
{"image_source":{"path":"images/e56f246cba91f6d771599c62588f4619291262f5940ecf279e6ec754473fab2b.jpg"},"content":"","chart_caption":[{"type":"text","content":"Figure 4: Excess Distribution and Fitted GPD"}],"chart_footnote":[]}
Table 3: Model Parameters Estimation
| Model | Location (U) | Shape (ξ) | Scale (β) |
| G(X: U, ξ, β) | 2167 | 0.1938 | 3612.76 |
Therefore, the estimated three-parameter GPD model using MLE method becomes;
To measure the goodness of fit between the observed data and the theoretical distribution. The quantile-quantile plot (QQ-plot) serves as a valuable tool for initially evaluating the suitability of a parametric distribution's fit. In the context of Financial and Insurance scenarios, where data sets often exhibit fat-tailed behavior, the QQ-plot proves particularly useful . A well-suited parametric distribution should lead to a linear graph in the QQ-plot, as demonstrated in Figure 5. This visualization verifies the excellent fit of the Generalized Pareto Distribution (GPD) to the data, substantiating its efficacy for predictions. Furthermore, the QQ-plot aids in the identification of outliers within the dataset.
Additionally, an Anderson-Darling (AD) test was performed to assess the goodness of fit as shown in Table 4. The resulting p-value exceeded the 5% significance level, leading to the non-rejection of the null hypothesis. This outcome supports the conclusion that the data indeed adheres to the GPD within the context of Extreme Value Theory (EVT). The establishment of a good fit is pivotal; it empowers us to infer that the insurer is equipped to manage substantial claims by leveraging risk estimates, thus ensuring financial stability even in the face of significant challenges.
{"image_source":{"path":"images/417b95e00b57e1e409dd6c67db74ed3ed00f897442ef588df7c687596c4df565.jpg"},"content":"","chart_caption":[{"type":"text","content":"Figure 5: Quantile-Quantile Plot (QQ-Plot) of Residuals"}],"chart_footnote":[]}
Table 4: Goodness of Fit Test
| Test | Hypothesis | Alternative Hypothesis | Test Statistic | P-Values |
| A-D | Data follow GPD | Data does not follow GPD | 4.02 | 0.659 |
3.3 Risk Measures
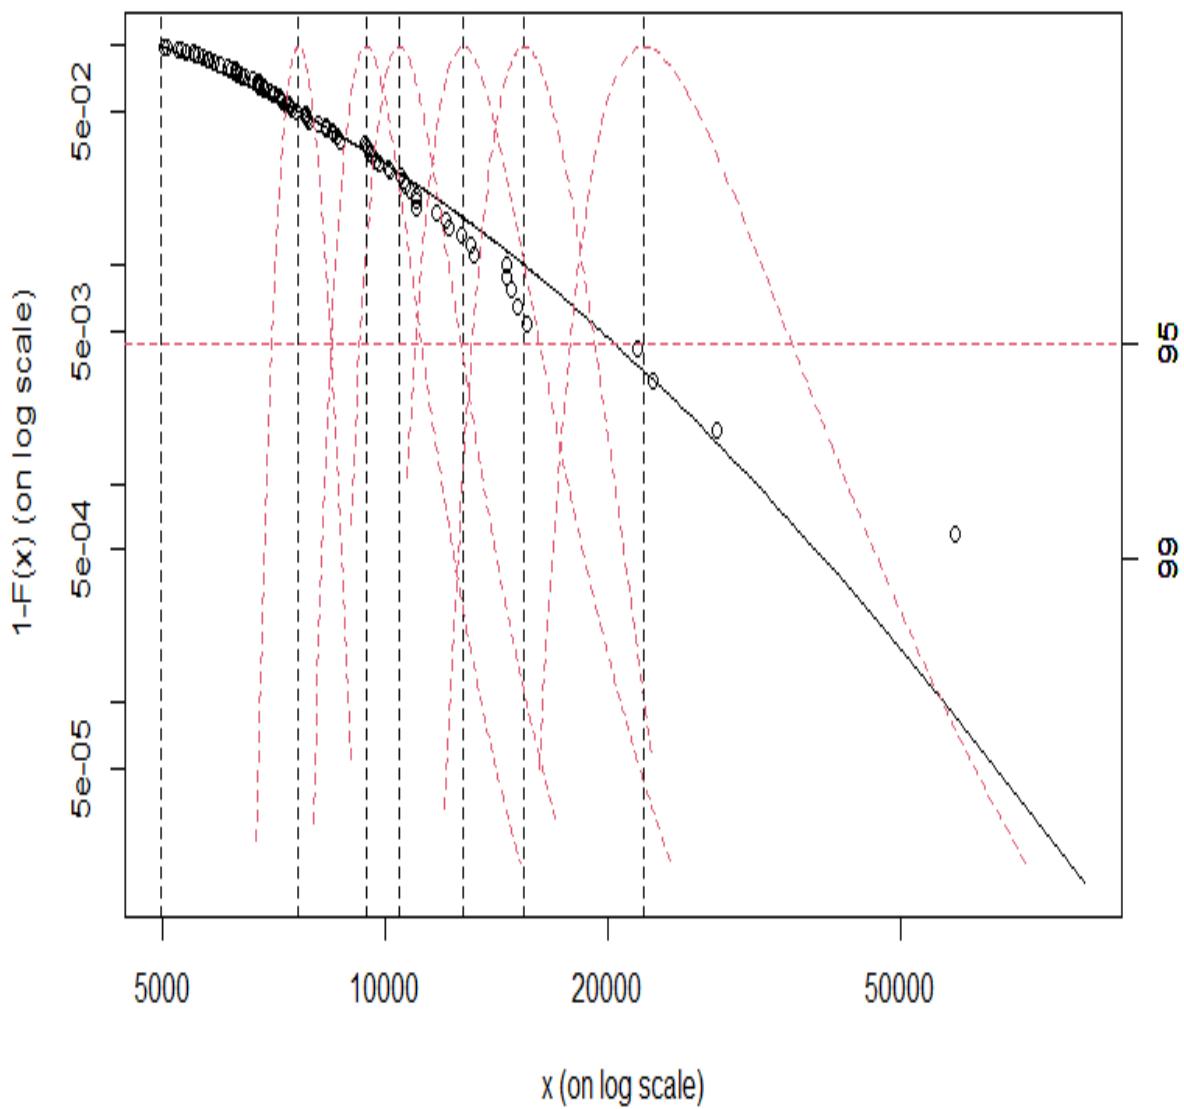
With the GPD model successfully fitted to fire loss data, we can now employ it to assess the risk associated with higher quantiles, as well as insurers' capital value at risk, and the expected losses within a specified time frame. For instance, our estimated 99% Value at Risk stands at MK15,437,440 in the most unfavorable scenario, accompanied by a lower interval of MK13,156,630 and an upper interval of MK19,201,590. This prediction encompasses the projected loss that the company should anticipate in their claims handling for the upcoming fiscal year.
This holds notable significance within the realm of operational risk management, particularly in adherence to regulatory requirements. Calculating extremely high quantiles (99%) aids in evaluating potential losses and gauging the company's solvency under exceedingly adverse conditions. Consequently, such assessments help in determining the company's resilience in the face of catastrophic scenarios, allowing for early detection and necessary action. As depicted in Figure 6, the Tail Loss alongside the Estimated 99% VaR exemplifies these insights effectively.
{"image_source":{"path":"images/e611aadecbe303d8f93ec335f1c6e70c01e456e4642e859bfb1dad603a3ec30b.jpg"},"content":"","chart_caption":[{"type":"text","content":"Figure 6: Tail Loss with Estimated 99% Value at Risk (VaR)"}],"chart_footnote":[]}
Even though Value at Risk (VaR) offers an estimation of the highest potential loss at the designated confidence level, i.e. 99%, it lacks insight into the scale of losses that could surpass the VaR threshold. Expected Shortfall (ES) overcomes this drawback by assessing the average value of all losses surpassing the VaR threshold. ES tell us about the average expected loss given that the loss amount is greater than VaR with certain probability level. For example, ES(0.05) with confidence level of 95% is defined as the expectation of the worst 5 cases out of 100 cases provided the loss is greater than VaR(0.05). Using a confidence level of 95% the ES is MK12,762,850 revealing that there is 5% probability that minimum loss would be equal to MK12,762,850 or greater or we are 95% confident that the maximum loss would be equal MK12,762,850 or less if loss exceeds VaR calculation in our next financial year.Table 5 below, reports the estimates of VaR and expected losses at different confidence levels as estimated by a three-parameter GPD.
Table 5: Value at Risk and Expected Loss Estimates (Interval Estimate (MK'000))
| VaR | Lower CI | Estimate | Upper CI | |
| 90% | 4853.09 | 4970.04 | 5302.19 | |
| 95% | 7038.21 | 7645.84 | 8439.94 | |
| 99% | 13156.63 | 15437.44 | 19201.59 | |
| ES | 90% | 8469.46 | 9443.91 | 11202.59 |
| 95% | 11065.51 | 12762.85 | 16145.44 | |
| 99% | 17923.64 | 22427.06 | 35467.68 |
{"image_source":{"path":"images/af3c9ff03b07356806bacfee19360d6797ca066207231fbc649fb2d32eff5b5d.jpg"},"content":"","chart_caption":[{"type":"text","content":"Figure 7: Estimate of 95% Value at Risk and Expected Shortfall"}],"chart_footnote":[]} {"image_source":{"path":"images/3dd4e79d54f5243be6dacb05f7ba4a51a15935e98713db63cc9dbc0589577a55.jpg"},"content":"","chart_caption":[{"type":"text","content":"Figure 8: Estimates of 90%, 95%, and 99% Value at Risk and Expected Shortfalls"}],"chart_footnote":[]}
IV. CONCLUSION AND RECOMMENDATIONS
4.1 Conclusion
The study's primary objective was to develop a mathematical model employing Extreme Value Theory (EVT) and Risk Measures to estimate and predict significant fire insurance claims. This aimed to offer insurance companies a more precise grasp of potential risks linked to substantial fire-related losses. The study established a three parameter Generalized Pareto Distribution (GPD) within the framework of EVT for estimating insurer risk due to catastrophic fire incidents. The significance of assessing fire-related financial losses for insurers was highlighted, es pecially considering the infrequent but influential extreme events that can distort overall loss patterns. By applying EVT techniques, including the GPD and Peaks Over Threshold (POT) method, to a dataset of historical fire insurance claims, the study accurately modeled the tail behavior of large losses. Parameters derived from these models enabled the calculation of probabilities for extreme loss events, thereby supporting enhanced risk management and pricing strategies for insurance companies. The findings showcased the efficacy of the EVT approach in accurately modeling and estimating the risk associated with substantial fire insurance claims. The research contributes to the insurance field by offering an improved mathematical and statistical framework for modeling significant fire insurance claims. Through this approach, insurers can better comprehend the potential financial consequences of rare fire incidents, facilitating more informed risk assessment and resource allocation. In summary, this study's methodology and findings have significant implications for managing and mitigating the risks associated with fire related losses in the insurance sector.
In terms of modeling significant fire insurance claims through the extreme value approach, our recommendations encompass several key points. It is advisable for insurers to employ the three-parameter Generalized Pareto Distri bution (GPD) within this approach, enabling a robust assessment of risk associated with substantial fire insurance claims. Moreover, insurance companies are encouraged to allocate capital for potential large losses, guided by the Value at Risk (VaR) and Expected Shortfall metrics calculated from the three-parameter GPD under the Extreme Value Theory framework. Leveraging insights derived from this methodology, companies can then formulate well-informed strategies for pricing and capital reserving that align with the distinct risk profile of fire insurance policies. In addition, we recommend that, future research should include other methods for estimating VaR of fire loss such as Historical method and compare results to Extreme VaR and also, should extend univariate EVT models to multivariate EVT models that may capture a broad spectrum of covariates of fire occurrence influencing fire losses to commercial property.
ACKNOWLEDGEMENTS
The authors would like to thank the Mathematical Sciences department of the University of Malawi.
List of Abbreviations
The following table below lists abbreviations in the manuscript:
| Abbreviation | Meaning |
| EVT | Extreme Value Theory |
| GPD | Generalised Pareto Distributions |
| POT | Peaks Over Threshold |
| GLM | Generalised Linear Models |
| GEVD | Generalised Extreme Value Distribution |
| ES | Expected Shortfalls |
| VaR | Value at Risk |
| RBM | Reserve Bank of Malawi |
| MLE | Maximum Likelihood Estimation |
| MSE | Mean Square Error |
| MEF | Mean Excess Function |
| ccdf | Complementary Cumulative distribution function |
| AD | Anderson Darling test |
| Q-Q plot | Quantile-Quantile plot |
Declarations
Availability of Data
Data will be made available upon request.
Competing interests
The authors declare that there are no competing interests.
Funding
The authors received no funding from any any agency.
Author's contributions
The manuscript concept design and supervision was done by Nelson Dzupire, coding and analysis was done by Dan Kachusa, and finally the manuscript development was done by Samuel Gyamerah.
Ethical Approval section
This is not applicable.
Conflict of Interest
The authors declare no conflict of interest.
Ethical Approval
Not applicable
Data Availability
The datasets used in this study are openly available at [repository link] and the source code is available on GitHub at [GitHub link].
Funding
This work did not receive any external funding.
References
Cite this article
Related Research




Special Issue
Launch a focused special issue to highlight research, emerging trends, and expert insights in your academic field.
