




IntelliPaper
Abstract
The primary responsibility of any country's government is to enhance the quality of life for its citizens, ensuring they have opportunities to live comfortably. Government actions significantly influence the social, economic, and political stability of a nation. Public servants play a crucial role in implementing these public policies and services. Consequently, the number of public servants is a critical indicator of the accessibility of public services. Numerous studies explore the availability of public services based on a country's macroeconomic and demographic metrics. We believe that public services should aim to positively impact every citizen's life, thus improving their quality of life. In this paper, our study intended to examine the availability of government services using social and economic indicators relevant to families and individuals -such as the gross domestic product per capita, the number of government employees per thousand people, and the country's happiness index. The cluster regression method was utilized for this analysis.
Explore Digital Article Text
I. INTRODUCTION
The quality of life in a country is measured by indicators such as social support, healthy living, freedom of choice, generosity, gross domestic product per capita and levels of corruption. This study used the 2022 World Happiness Report rankings to identify the countries with the highest levels of happiness. This index covers 146 countries, with Finland and Denmark ranking as the happiest, while Afghanistan, Zimbabwe, and Lebanon rank at the bottom. We used the results of this report to find an average happiness index of 5.55. Of these countries, 74 were above the mean happiness index and 72 were below it, indicating a normal distribution in the range [2.4, 7.82].
The per capita is a crucial economic indicator of the quality of life for citizens and households. This study uses 2022 data from the International Labor Organization (ILO) and the World Bank (WB). For instance, in 2022, Brazil's per capita was reported as 8,872 USD by the ILO, while the WB estimated it at 8,917 USD - a difference of 46 USD. When calculated across 146 countries, the most considerable discrepancies were found in Cyprus (10,078 USD), North Cyprus (3,232 USD), the Netherlands (596 USD), Lebanon (508 USD), Ukraine (310 USD), the State of Palestine (242 USD), and Taiwan (189 USD). For the 146 countries, GDP per capita in 2022 was compared with figures from 2010. The global average per capita rose from 14,276 USD in 2010 to 18,437 USD in 2022, indicating an average per capita growth of in these years. However, Venezuela's per capita declined by , reducing the total average growth rate by two percentage points for these countries. Significant declines were also calculated in Lebanon , Yemen , Iran , and Libya . In contrast, substantial growth occurred in Ethiopia , China , Kosovo , Vietnam , the State of Palestine , Moldova , Cambodia , Panama , Kenya , Latvia , Guatemala , and Mongolia . Our research will use GDP per capita data from the ILO for analysis.
Public servants are responsible for ensuring citizens have access to social support and opportunities. Dashdelger, G., and Bayaraa, S.-D. studied the availability of public services in relation to GDP, population size, land area, labor force, and number of public servants. They evaluated the availability of public services across 108 countries based on their socio-economic potential and human resources, proposing the most optimal cluster options. However, countries like Tanzania, Yemen, Zimbabwe, and Afghanistan have large populations but low labor force participation, while nations such as Libya, North Cyprus, Russia, Togo, and Lesotho have disproportionately high numbers of civil servants. These discrepancies undermine the significance of their research. Our goal is to address and eliminate these weaknesses.
We used data on GDP per capita, the number of public servants per thousand people (NPS), and happiness index scores for 146 countries listed in the 2022 Happiness Index. Due to missing NPS data for 2022, Montenegro, Côte d'Ivoire, North Macedonia, Congo-Brazzaville, Gabon, Burkina Faso, Comoros, and Mauritania were excluded from the study. Countries like Benin, Chad, Cyprus, Togo, and Turkmenistan, where exact NPS were unavailable, estimates were made based on their proportion in the total labor force. As a result, this research includes data for 138 countries (see Figure 1).
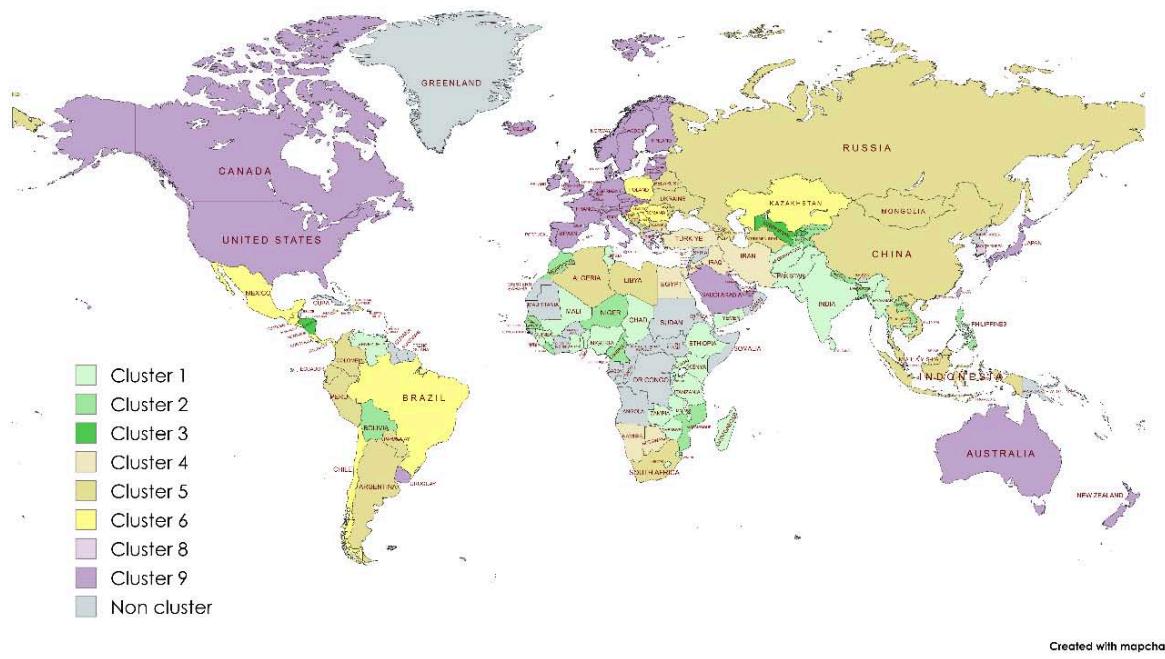 Figure 1 Other countries not included in this study, such as Columbia and Peru, are shown in the same color in Figure 1. Among these 138 countries, the average NPS was 72. Countries with notably highest NPS included Belarus (390), Libya (305), Kosovo (225), Russia (218), North Cyprus (188), Benin (179), Togo (172), Lesotho (170), Iceland (165), and Norway (160). In contrast, Niger (6), Gambia (5), Mozambique (3), Mali (3), and Nepal (3) had among the extremely lowest NPS. This study evaluates citizens' access to public services by analyzing GDP per capita, the NPS, and happiness index scores.
II. METHODOLOGY
The purpose of this research is to model the availability of public services in countries based on their economic capacity and quality of life using cluster regression. In the sample regression model, and are independent variables, and Y is a dependent variable. It becomes
were GDP per capita (USD),
were the happiness index of the country,
were the numbers of public servants per thousand people for the country.
Where can take values between one and 138.
According to sample data of 138 countries, GDP per capita is and the happiness index is . Also, the number of public servants per thousand people is . For these samples, the correlation coefficients for the pairs and were 0.226 and 0.299, respectively, indicating a weak linear relationship between each factor and the outcome Y. To assess the combined effect of and , we selected a second order non-linear model.
First, we divided the set into three subsets based on GDP per capita: 'low', 'medium', and 'high', and the set into three subsets based on the happiness index: 'low', 'medium', and 'high'. As a result, we formed nine clusters. Then, a non-linear regression model with two factors was constructed using data from 138 countries. This model was,
In model (1), is the value estimated by the model. Also, the model parameters were , , , , and . We estimated these parameters by the least squares method. After building the model, for each cluster, the countries with the smallest difference between the actual and estimated values of the NPS, or the best fit of the model, were determined.
III. THE MODELING OF NPS
We construct a sample regression model that describes number of public servants per 1000 people (Y) in terms of GDP per capita ( ) and the happiness index ( ). The countries in the study are divided into classes by GDP per capita, and by happiness index (Table 1).
We based this division on the sample means and medians: had a mean of 18,320 and a median of 6,848, while had a mean of 5.59 and a median of 5.724. This classification resulted in 47 countries with low, 50 with average, and 41 with high GDP per capita. Similarly, for the happiness index, 38 countries were low, 44 were average, and 56 were high (Table 1). Each row or column in the table thus represents approximately one-third of the countries surveyed, enhancing the study's generalizability.
Table 1
| Factors | World Happiness index (real numbers) | ||||
| Levels | low | medium | high | ||
| Values | [2.3, 5] | [5.01, 6] | [6.01, 7.5] | ||
| GDP per capita (US dollar) | low | [350, 4000] | 30 | 14 | 3 |
| medium | [4001, 20000] | 8 | 27 | 15 | |
| high | [20001, 130000] | - | 3 | 38 | |
The cluster classification in Table 1 is represented by the countries (see Table 2).
Table 2
| World Happiness index (real numbers) | ||||
| low | medium | high | ||
| [2.3, 5] | [5.01, 6] | [6.01, 7.5] | ||
| GDP per capita (US dollar) | [350 USD, 4000 USD] | Afghanistan, Zimbabwe, Lebanon, Rwanda, Lesotho, Sierra Leone, Tanzania, Malawi, Zambia, India, Togo, Yemen, Ethiopia, Chad, Madagascar, Sri Lanka, Myanmar, Eswatini, Mali, Palestine State, Tunisia, Pakistan, Kenya, Nigeria, Uganda, Benin, Cambodia, Ghana, Guinea, Venezuela (30) | Niger, Senegal, Mozambique, Cameroon, Morocco, Liberia, Laos, Bangladesh, Gambia, Nepal, Tajikistan, Bolivia, Kyrgyzstan, Philippines (14) | Honduras, Uzbekistan, Nicaragua (3) |
| [400 1 USD, 2000 0 USD] | Jordan, Egypt, Namibia, Iran, Iraq, Georgia, Botswana, Turkey (8) | Ukraine, Algeria, Indonesia, Vietnam, Mongolia, Moldova, Jamaica, Paraguay, Ecuador, Colombia, Libya, South Africa, Albania, Armenia, Thailand, Peru, Bosnia and Herzegovina, Azerbaijan, Belarus, Turkmenistan, Dominican Republic, North Cyprus, China, Malaysia, Argentina, Bulgaria, Russia (27) | El Salvador, Guatemala, Kosovo, Brazil, Serbia, Mauritius, Kazakhstan, Mexico, Costa Rica, Chile, Hungary, Panama, Romania, Croatia, Poland (15) | |
| [200 01 USD, 1300 00 USD] | Hong Kong, South Korea, Greece (3) | Portugal, Japan, Kuwait, Latvia, Cyprus, Estonia, Slovakia, Lithuania, Malta, Italy, Uruguay, Spain, Singapore, Taiwan, Saudi Arabia, United Arab Emirates, Slovenia, Bahrain, France, Belgium, Czech Republic, United Kingdom, United States, Canada, Germany, Ireland, Australia, Austria, New Zealand, Israel, Norway, Sweden, Luxembourg, Netherlands, Switzerland, Iceland, Denmark, Finland (38) | ||
Using data from 138 countries, a non-linear regression model was then constructed in the Eviews program (see Table 3). Table 3
| Models | Coefficients | R-squared | DW stat | |||||
| $a_0$ | $a_1$ | $a_2$ | $a_3$ | $a_4$ | $a_5$ | |||
| Model (2). | 5.205875 | -0.000658 | 11.32069 | -8.59E-09 | -0.119189 | 0.000223 | 0.098642 | 1.949692 |
| Prob. | 0.0305 | 0.1531 | 0.1517 | 0.5952 | 0.0150 | 0.2854 | ||
| Model (3). | -242.291 | 93.18779 | -54.22787 | -7.388177 | -0.941057 | 8.204855 | 0.134009 | 2.025026 |
| Prob. | 0.844 | 0.9335 | 0.7031 | 0.8608 | 0.0997 | 0.5669 | ||
| Model (4). | -244.6906 | 93.78564 | -54.58833 | -7.08988 | 0 | 7.114253 | 0.133905 | 2.0232 |
| Prob. | 0.8522 | 0.9374 | 0.7389 | 0.895 | - | 0.7807 | ||
We estimated the model coefficients using the least squares method, with crucial statistical results presented in Table 3. In the model, we not calculated the multicollinearity between and . The model (2) is
Initial results indicate that per capita values are significantly higher than the happiness index and the NPS. That reduces the confidence levels of the coefficients in model (2) and suggests the need for further refinement. The model (3) becomes
Consequently, model (3) was developed by transforming variable using its natural logarithm, which improved the significance of all coefficients except . Therefore, we refined model (3) by setting the coefficient to zero. In the final model (4), the confidence probability of the coefficients improved, exceeding 0.7389 (see Table 3). This model (4) becomes
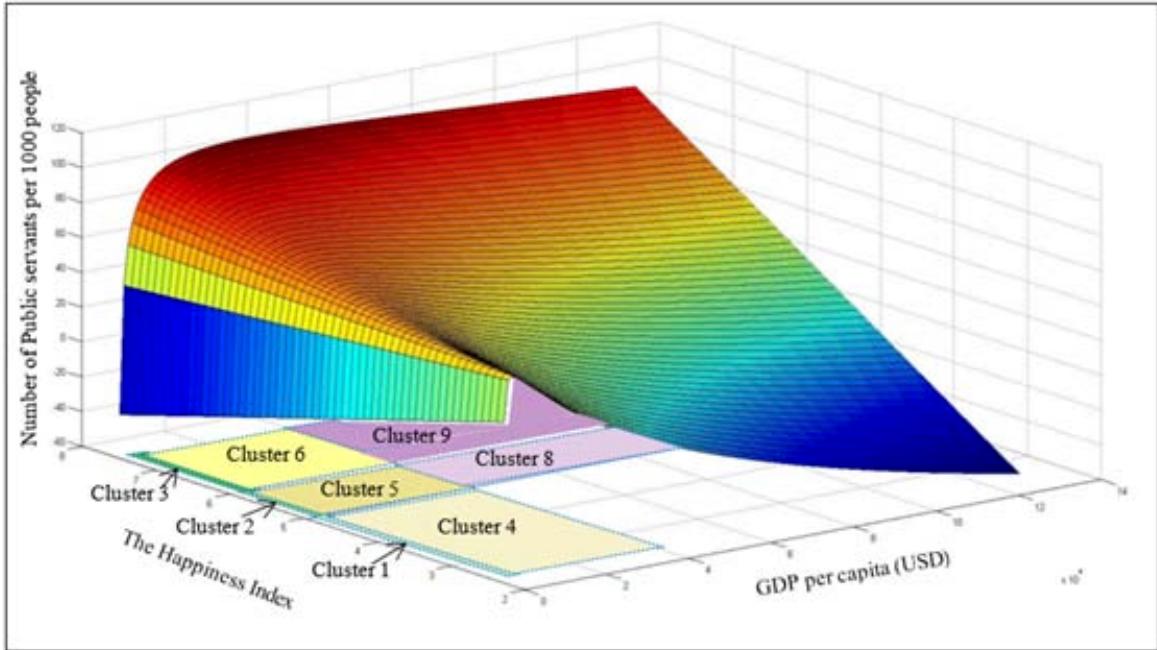
The equation (4) is a second order non-linear model (see Figure 2). The horizontal plane in Figure 2 illustrates the cluster partition regions. As shown, the increase in NPS with rising happiness index values was expected to be gradual in clusters 1 to 6 but more sharply linear in clusters 8 and 9 (see Figure 2). However, extreme differences in GDP per capita complicate interpretation, so correlation analysis between these factors was applied.
 Figure 2
As shown in Table 3, while improving from model to model, the R-squared coefficient for model (2) was 0.098642, and the Durbin-Watson (DW) index, which measures autocorrelation in the regression residuals, was 1.949692. For model (4), these values were 0.133905 and 2.0232, respectively. Table 3 shows that these parameters have improved with each model update.
Thus, model (4), as represented by equation (4), demonstrates higher confidence probabilities for its coefficients, and the DW index is nearly 2, indicating that it is an excellent model. Here, the coefficient of R-squared is 0.133905, which shows that the model (4) explains a non-linear relationship between these factors. We utilized the model (4) to estimate the NPS in each country.
IV. ANALYSIS OF THE CLUSTER REGRESSION
For each cluster, we calculated the correlation between the factors and the NPS (see Table 4).
| Clusters | Correlation coefficients | ||
| $corr(X_1,X_2)$ | $corr(X_1,Y)$ | $corr(X_2,Y)$ | |
| 1 | 0.2722 | -0.0178 | -0.0438 |
| 2 | -0.0169 | 0.2685 | 0.1421 |
| 3 | 0.1699 | -0.0328 | -0.9905 |
| 4 | -0.1225 | -0.3222 | 0.1612 |
| 5 | -0.1289 | 0.0313 | 0.0093 |
| 6 | 0.2975 | 0.1809 | -0.4382 |
| 7 | - | - | - |
| 8 | 0.2342 | 0.9754 | 0.0142 |
| 9 | 0.5906 | 0.1845 | 0.4413 |
| Clusters | Correlation coefficients | ||
| $corr(X_1, X_2)$ | $corr(X_1, Y)$ | $corr(X_2, Y)$ | |
| 1 | 0.2722 | -0.0178 | -0.0438 |
| 2 | -0.0169 | 0.2685 | 0.1421 |
| 3 | 0.1699 | -0.0328 | -0.9905 |
| 4 | -0.1225 | -0.3222 | 0.1612 |
| 5 | -0.1289 | 0.0313 | 0.0093 |
| 6 | 0.2975 | 0.1809 | -0.4382 |
| 7 | - | - | - |
| 8 | 0.2342 | 0.9754 | 0.0142 |
| 9 | 0.5906 | 0.1845 | 0.4413 |
Based on a calculation, we made the following analysis.
- Cluster 1 includes 30 countries characterized with a low GDP per capita and a low happiness index. Correlation coefficients show an association among these variables: GDP per capita has a correlation of 0.2722 with the happiness index, -0.0178 with the NPS, and the happiness index correlates at -0.0438 with the NPS (see Table 4). Thus, these factors have a minimal negative impact on public service availability in this cluster. This suggests that increasing GDP per capita could potentially raise the happiness index in these countries.
According to model (4), estimated values of NPS show a weak positive correlation (0.062) with the actual values. Moreover, countries such as Lesotho, Togo, Benin, and Venezuela are experiencing disproportionately high numbers of NPS, which could place significant pressure on their state budgets. In contrast, countries like Rwanda, Zambia, India, Eswatini, Kenya, Nigeria, and Cambodia have significantly fewer public servants than the average, jeopardizing the availability of public services. For countries like Afghanistan, Malawi, Yemen, and Madagascar, the difference between actual and estimated values is minimal, suggesting that their reported data is realistic and that the NPS aligns with local conditions.
- Cluster 2 comprises 14 countries with low GDP per capita and an average happiness index. For these countries, GDP per capita shows a very weak negative correlation (-0.0169) with the happiness index but a positive correlation (0.2685) with the NPS. The happiness index and NPS have a positive correlation of 0.1421 (see Table 4). In these countries, GDP per capita is the primary driver of increased public service availability, but it does not appear to be a factor in improving the happiness index.
In this cluster, model (4) yields a very weak positive correlation (0.0286) between the estimated and actual values of NPS. The results from model (4) indicate that in countries like Liberia, Tajikistan, and Kyrgyzstan, an excess of public servants hinders private sector activity. In contrast, Morocco, Bangladesh, Nepal, Bolivia, and the Philippines have lower-than-average NPS, which could reduce access to public services. Laos shows the slightest difference between estimated and actual values for NPS, suggesting an optimal NPS level based on our model.
- Cluster 3 includes three countries (Honduras, Uzbekistan, and Nicaragua) characterized by low GDP per capita and a high happiness index. For these countries, per capita GDP shows a positive correlation (0.1699) with happiness index but a very weak negative correlation (-0.0328) with the NPS. In cluster 3, the correlation coefficient between GDP per capita and the NPS, indicating that these factors are almost unrelated. The happiness index and NPS have a very strong negative correlation of -0.9905 (see Table 4). This suggests that increasing NPS in these countries may negatively impact the happiness index. However, the limited number of countries in this cluster reduces the reliability of the estimates.
In these countries, despite having low GDP per capita income, there are notable examples of initiatives that effectively enhance citizens' quality of life and elevate the happiness index. For these countries, the ten indicators of happiness index in the "World Happiness Index 2022" report are shown as of 2021 (see Table 5).
| Country name | Life Ladder | Log GDP per capita | Social support | Healthy life expectancy at birth | Freedom to make life choices | Generosity | Perceptions of corruption | Positive affect | Negative affect | Confidence in national government |
| Honduras | 6.11 | 8.57 | 0.81 | 63.85 | 0.83 | 0.12 | 0.85 | 0.81 | 0.27 | 0.23 |
| Nicaragua | 6.09 | 8.61 | 0.85 | 65.65 | 0.9 | 0.03 | 0.67 | 0.80 | 0.29 | 0.59 |
| Uzbekistan | 6.18 | 8.94 | 0.9 | 65.3 | 0.93 | 0.19 | 0.66 | 0.7 | 0.23 | 0.91 |
| Average | 5.66 | 9.6 | 0.81 | 65.5 | 0.78 | 0.034 | 0.73 | 0.66 | 0.29 | 0.48 |
Although these countries have a low GDP per capita, the life ladder, social support, positive affect, and freedom to make life choices for citizens are above the average of the countries surveyed. According to the estimates from model (4), Uzbekistan has an excess of NPS, while Honduras faces a deficit. In Nicaragua, the difference is slighter.
- Cluster 4 comprises eight countries with an average GDP per capita, and a low happiness index. Correlation coefficients show an association among these variables: GDP per capita has a correlation of -0.1225 with happiness index, -0.3222 with the NPS, and the happiness index correlates at 0.1612 with the NPS (see Table 4). This suggests that to increase GDP per capita in these countries, a reduction in NPS may be necessary. But the happiness index had a significant positive effect on the NPS. This suggests that cluster 4 may not be adequately prioritizing citizens' quality of life and access to public services.
Compared to the model average, Georgia and Botswana exhibit higher NPS, whereas Jordan and Namibia fall below average. Notably, Iraq has the most minor deviation from the actual NPS value estimated by model (4), reflecting a calibration of its NPS in line with its economic potential.
- Cluster 5 consists of 27 countries classified as average in terms of GDP per capita and happiness index, representing 19.6% of all countries surveyed. In this cluster, GDP per capita correlates the happiness index at -0.1289 and NPS at 0.0313. However, there is a very weak positive correlation (0.0093) between happiness index and NPS (see Table
4). This coefficient, indicating that the happiness index and NPS are almost unrelated. This suggests that to increase the happiness index in these countries, a recruitment in GDP per capita may be not necessary. Additionally, other happiness indicators, beyond GDP per capita, are needed to enhance the availability of public services.
Within this cluster, countries such as Ukraine, Libya, Belarus, North Cyprus, Russia, and Turkmenistan have NPS values that exceed model (4) estimates. At the same time Jamaica, Ecuador, Colombia, Peru, and China fall below average. Mongolia shows the slightest deviation from the estimated NPS. Notably, Libya's NPS is about 4 times higher than the model's estimated value.
- Cluster 6 comprises 15 countries characterized by average GDP per capita, and a high happiness index. In this cluster, GDP per capita shows a correlation of 0.2975 with the happiness index, 0.1809 with NPS, and -0.4382 between the happiness index and NPS (see Table 4). Therefore, for this cluster, when the NPS increased, the happiness index increased, while the availability of public services decreased. A vital advantage of the cluster is that the high happiness index is influenced more by non-economic factors, such as freedom and the ability to make choices for a citizen, than by economic conditions.
Within the cluster, NPS values are notably high in Kosovo, Hungary, and Croatia, while El Salvador, Guatemala, and Chile have significantly lower NPS values. In contrast, Serbia shows the minimal difference from the model (4) estimates.
-
Cluster 7 is defined by high GDP per capita, and a low happiness index. However, our research found no countries that fit this classification, indicating that nations with high economic potential do not necessarily exhibit low happiness levels.
-
Cluster 8 comprises three countries—Hong Kong, South Korea, and Greece—characterized by high GDP per capita, and an average happiness index.
For these countries, per capita GDP shows a weak positive correlation (0.2342) with the happiness index but a very strong positive correlation (0.9754) with the NPS. The happiness index and NPS were almost unrelated (see Table 4). In
Cluster 8, as GDP per capita rises, the number of civil servants increases significantly, leading to a rise in the happiness index as well.
In these countries, despite their high GDP per capita, enhancing access to public services necessitates equitable policies prioritizing improving the quality of life and fostering positive outcomes. For these countries, the ten indicators of happiness in the "World Happiness Index 2022" report are shown as of 2021. Despite having higher GDP per capita, these countries fall below the surveyed average in positive affect, generosity, and citizens' freedom to make life choices (see Table 6).
Table 6
| Country name | Life Ladder | Log GDP per capita | Social support | Healthy life expectancy at birth | Freedom to make life choices | Generosity | Perceptions of corruption | Positive affect | Negative affect | Confidence in national government |
| Hong Kong | 5.32 | 10.93 | 0.82 | 0.67 | 0.39 | 0.53 | 0.22 | 0.49 | ||
| Greece | 6.1 | 10.27 | 0.85 | 71.15 | 0.57 | -0.16 | 0.75 | 0.62 | 0.31 | 0.4 |
| South Korea | 6.11 | 10.69 | 0.81 | 73.65 | 0.72 | -0.03 | 0.68 | 0.56 | 0.22 | 0.43 |
| Average | 5.66 | 9.6 | 0.81 | 65.5 | 0.78 | 0.034 | 0.73 | 0.66 | 0.29 | 0.48 |
Model (4) estimates indicate that Greece has a surplus, while Hong Kong has a deficit, in NPS. In South Korea, this difference is more minor.
- Cluster 9 includes 38 countries characterized by high GDP per capita, and a high happiness index, representing 27.5% of all countries considered in this study. In this cluster, GDP per capita shows a strong correlation of 0.5906 with the happiness index, a weak correlation of 0.1845 with NPS, and a correlation of 0.4413 between the happiness index, and NPS (see Table 4). For these countries, the above correlation coefficients are all positively correlated, contributing to the improved availability of public services. These countries effectively leverage their economic advantages to enhance citizens' quality of life, indicating good access to public services.
According to model (4), the disparity between actual and estimated NPS is significant in countries such as Latvia, Slovakia, Lithuania, Iceland, and Norway. At the same time, it is smaller in Spain, Bahrain, Taiwan, Saudi Arabia, Austria, and Luxembourg. France, Belgium, and the Netherlands show minimal differences in these values. Overall, the findings suggest that improving delivery of public service relies more on implementing citizen-centered policies rather than simply increasing the NPS.
V. CONCLUSION
Although GDP per capita is often used to assess a country's happiness index, the correlation between these indicators is 0.69, indicating a non-linear relationship. As a result, both the happiness index, and GDP per capita were selected as independent factors in our research, which evaluates the delivery of public services across countries. The government serves as the largest employer in any nation and implements policies that support citizens' income, guarantee livelihoods, control inflation, and allocate budgets effectively. Therefore, the role of public servants in delivering these services is crucial, making it a crucial outcome factor of our study. We obtained the model with a numerical sample of 138 countries, and applied the model (4) to each cluster individually, which ensured that the research was stable and accessible. We calculate the model's coefficient of determination (0.249) using the mean squared error and residuals from model (4). This shows that our model can explain about 25 percent of NPS. Our findings show that clusters 1, 5, and 9 account for 68.9% of the 138 countries surveyed, indicating that GDP per capita and happiness index exhibit similar dynamic patterns across nations. These three clusters of countries each have a distinct model of public service delivery, shaped by their GDP per capita and happiness index.
For cluster 3 countries, comparing the results of the model (4) with Table 4, NPS in the country with high trust in the government was excessive. In contrast, NPS in the country with low trust in a government did not reach the value of the model or lack of public services. Therefore, the countries in clusters 2, 3, and 6 were identified as exemplary in delivering public services, effectively utilizing their GDP per capita and happiness index.
In cluster 5, the average difference between actual and estimated values of NPS was 19, highlighting the need for these countries to avoid excessive increases in NPS in the future. By contrast, other clusters showed slight negative differences, suggesting that these countries could afford to increase their NPS somewhat. Additionally, in nations experiencing war or internal conflict, the NPS was significantly higher than model estimates. To stabilize their domestic economies, these countries have implemented short-term management strategies, including expanding civil services, enhancing welfare policies, and providing grants. Comparing the results of model (4) with Table 6 for Cluster 8 countries shows that trust in government was below the survey average, or support for government policies was weak. Therefore, the inability of the countries in clusters 4 and 8 to fully leverage their GDP per capita and happiness index indicates a need for progress in delivering public services to citizens.
We did not intend to rank the countries in which we are currently clustering. Instead, we determined the availability of public services in the country by evaluating the number of public servants. The countries with GDP per capita or happiness index values at the upper or lower ends of each cluster may exhibit behaviors that don't fit well within the regression model. We think that this difficulty can be corrected using the fuzzy cluster method. In the future, we will use a fuzzy logic model to evaluate the delivery of public services in countries not assessed by the happiness index.
4. World Map: Simple: https://www.mapchart.net/world.html
Conflict of Interest
The authors declare no conflict of interest.
Ethical Approval
Not applicable
Data Availability
The datasets used in this study are openly available at [repository link] and the source code is available on GitHub at [GitHub link].
Funding
This work did not receive any external funding.
References
Cite this article
Related Research



Special Issue
Launch a focused special issue to highlight research, emerging trends, and expert insights in your academic field.
