




IntelliPaper
Abstract
An evaluation of the risks influencing project performance was conducted in the railway construction industry in the Eastern area of Nigeria in order to reduce the risks connected with a specific activity and the potential for worker harm. The data obtained from a self-administered questionnaire survey of the construction industries was calculated using the Likert scale and the mean index formula following a brief instruction on health, safety, and environmental culture in the industry. Using a qualitative approach to data analysis and a matrix analysis table, the amount of risk was ascertained. Six categories of hazards, together with their subcategories, were chosen from construction-related projects based on the literature that was mentioned. To ensure that every company in the research region was equally represented, three firms were chosen at random from each state. Employees in the chosen construction industry received 160 questionnaires in total. 44 did not answer for a variety of reasons, bringing the sample size down to 116. A rate of 72.5% for the respondent was found. Within two months, the distribution and collection were completed. Using Cronbach's alpha reliability coefficient, which gauges the consistency of elements in question answers, reliability tests were run on each risk scale. Social, political, and construction hazards are the riskiest of the six categories of risk mentioned. The findings are consistent with the literature, which shows that the most common dangers in the construction sectors within the analyzed locations are poor safety performance and a lack of understanding of safety regulations
Explore Digital Article Text
I. INTRODUCTION
Risk is a measurement of the possibility that a certain danger may cause harm, taking into account the potential degree of the injury. According to , risk may be classified into several different categories, including financial, political, design, construction, and physical risk.
Physical risk: earthquakes, windstorms, hurricanes, rainstorms, snow, wind, cold, and other uncommon factors are included in this. Risks that arise during the building phase of a project are referred to as construction risks . It covers things like site possession delays, equipment malfunctions, and the amount, accessibility, and output of project labor. Design risks can result from several factors, including an incomplete design scope, information availability, new technology, innovation application, the level of detail and accuracy required, and the interaction of the design with the construction method . Design risks are risks resulting from improper structural analysis by structural engineers. Political risk: this is a result of the unknowns brought on by political unrest for the instability of the site works, including civil unrest, political tenure changes, boundary disputes, communal unrest over alleged inadequate compensation, legislative changes, war, and revolution. Financial risk is the umbrella term for uncertainties that have the potential to result in unforeseen financial losses, including human and physical injuries, which are invariably expensive [4]. In the planning stage of any health, safety, and environmental management system throughout project construction, risk assessment plays a crucial role.
Risks that have a high potential loss but a low chance of happening are often handled differently than those that have a low potential loss but a high chance of happening [5]. Any project, regardless of industry, has some risk, and since each project is different—particularly in the construction sector—risk varies too—any project manager should be interested in learning more about it [6]. Therefore, a project's success or delivery, as well as, in some situations, the organization's survival, depend on having a sufficient and thorough understanding of the commercial, political, construction, and operational risks and uncertainties involved [7].
II. LITERATURE REVIEW
Risk is the possibility that a material, action, or procedure will be harmful. Risk is defined by as an unfavorable result of an occurrence for which a potential outcome may be recognized, quantified, and anticipated. Risk is determined by the frequency of occurrence and the seriousness of the outcome. According to research, risk in Pakistan's construction industry is defined as a confluence of factors that negatively impact the project's schedule, budget, scope, and quality objectives. According to risk in project management is the likelihood that an event will occur and have an unfavorable impact on the project's success or continuity in terms of its budget, quality, completion schedule, operational use, and overall sustainability for both the present and future generations. Risk was defined by as a combination of likelihood, severity, and exposure to all associated risks with an activity. Every building project is different from the next in terms of its degree of complexity and unique obstacles, which affect the occurrence and effect of risk. Therefore, when risk is there in a project and there is insufficient knowledge at the outset, the project's cost, duration, and quality tend to increase. According to , risks may, however, diminish as a project develops and as hazards become more certain as the project moves forward, the project's degree of risk can also drop.
In [13] claim that because various individuals have varied opinions and interpretations of the elements, sources, probabilities, repercussions, and preferred courses of action associated with a given risk, there are variations in how risk is perceived at both the individual and organizational levels. According to [14] the factors that make construction hazardous and prone to health and safety risks, include the state of the work's physical environment, the nature of the operations, the methods, the materials, the heavy equipment used, and the project's physical characteristics. The overall project cost, quality, and delivery time all demonstrate how important it is to have proper health and safety procedures and regulations in place [15].
Based on further pointed out that risks associated with the construction industry primarily affect project cost estimates, schedule overruns, failure to meet quality standards, and operational requirement compliance. He also mentioned the possibility of construction-related hazards arising from man-made accidents that cause structural damage, equipment failure, worker casualties, or natural catastrophes like earthquakes, floods, landslides, etc. Financial risk might take the shape of project cost inflation, delays in receiving funding, or changes in interest rates or currency rates . Additional risk factors include political and environmental ones brought on by modifications to laws and regulations, conflict and social unrest, permits and approvals, and particular ones like coming across hazardous wastes, different subsurface conditions, running into problems with soils, etc. . Defective or incomplete designs may also cause loss. Other possible project risk factors include labor availability, spare part availability, construction equipment supply, logistics, and procurement delays. In the construction sector, risk is obvious in various forms, and the degree of risk is always correlated with the complexity of the project . The scale and complexity of the projects account for a large portion of the recognized hazards in the construction sector . The number of possible dangers that might arise increases with the size of the project. Many variables might increase the likelihood of a risk event; the most frequently cited ones are financial, environmental (including the project's surroundings, location, and general rules), time, design, and quality. The amount of technology employed and the dangers facing the company are additional factors that affect the likelihood of risk . No matter the size or scope of the project, several hazards are exclusive to the construction business and that might arise.
According to [22], the risk identification process is a crucial step in attempting to manage risk in a specific project since the outcome of this stage will influence the assessment phase, which comes after. As a result, risk will not be assessed if it is not discovered. The process of identifying hazards that may impede a program, organization, or investment from accomplishing its goals is known as risk identification [23]. It entails expressing and recording the worry. Numerous scholars have delineated various methods for discerning risk in a project. According to [24], there are three categories into which the different identification procedures may be divided: identification carried out by the risk analyst, identification made by the analyst through an interview with a project team member, and identification made by the analyst as the head of a working group.
Risk assessment is a process that may take many different forms, as pointed out. Furthermore, the goal of these forms and procedures is to achieve a level of risk that is acceptable. The process of determining whether risks are sufficiently managed while taking into account any existing measures, as well as assessing the amount of risk while taking individuals in danger into consideration. Regardless of the activity involved, risk assessment is a difficult stage, according to and . This stage represents a definite vision and an attempt to forecast the future and evaluate potential risks, which goes beyond any statistical or quantitative computation.
The second and most crucial step is risk analysis, which is when gathered information regarding possible risks is examined . A tabulation of the risk events taken into consideration, events eliminated, likelihoods, and effects are typical contents of risk registers. The outcomes of earlier risk assessment and analysis (risk grading or ranking), as well as current control measures, scheduled management activities, responsibility distribution, and action scheduling . This content is derived from recorded data from each identified risk, including the unique reference number, the date of the most recent risk update, a brief description of the risk, its materiality, an assessment of all potential consequences, the likelihood that the risk will materialize, a risk rating based on the likelihood and the most severe consequence, risk responses along with their current status, and the risk owner .
A project's assets value (AV), vulnerability (V), threats that could exploit this vulnerability (T), the likelihood that the threat will materialize (P), and impact (I) on the project after it has occurred are all considered in the risk management process when evaluating a potential risk [30]. A risk assessment result must meet the requirements of uniqueness, dependability, objectivity, and repetition to be considered legitimate [31]. To encourage practitioners to adopt risk assessment tools, the analysis must be simple. The most effective qualitative and quantitative risk analysis instruments in the oil and gas, construction, and other sectors were examined by [32]. They discovered that the most often used techniques for quantitative risk assessment were Expected Monetary Value (EMV), break-even analysis, scenario analysis, and sensitivity analysis, whereas the most commonly used tools for qualitative risk assessment were engineering judgment, business experience, and personal experience. Similar investigations by [33] and [34] yielded very identical results. The most commonly used quantitative risk assessment tools are not sophisticated, suggesting that practitioners often use them to support their experience and judgment when assessing construction risks [35]. To enhance the usability of risk analysis tools, it is crucial to reflect on the real practice of risk analysis and appreciate practitioners' experience. For any alternative tool to be successful, simplicity and facilitation of professional experience should be key attributes.
Choosing an appropriate risk assessment model for a specific project can be challenging, as methods should be chosen based on the type of risk, project scope, and specific method requirements and criteria.
The desired outcome of the assessment should be reliable . The selection of the right technique often depends on experience, expertise, and available computer software . Organizations must determine the most critical factors for their project and develop risk assessments accordingly. Risk in construction is an event that adversely affects project objectives and depends on the probability and severity of accident occurrence [30]. To manage risks, four interdependent elements are required: hazard identification, risk analysis, risk control selection, and risk control implementation and maintenance [33]. Risk can be assessed using matrices, which estimate probability and consequences in qualitative or quantitative ways. A risk matrix is used to rank risks in order of importance, including severity, consequences, and impact. Risk increases if probability or severity rise concurrently. A risk matrix can be used as a 3x3 cell matrix, 5x5 cell matrix, or 7x7 cell matrix for risk assessment of a larger structure [34]. Figure 1 is the risk matrix table
Figure 1: Risk Matrix of Construction
| PROBABILITY | CONSEQUENCE | |||||
| INSIGNIFICANT1 | MINOR2 | MODERATE3 | MAJOR4 | CATASTROPHIC5 | ||
| RARE | 1 | L | L | L | M | M |
| UNLIKELY | 2 | L | M | M | M | H |
| POSSIBLE | 3 | L | M | M | H | E |
| LIKELY | 4 | M | M | H | E | E |
| CERTAIN | 5 | M | H | E | E | E |
-
L = Low: Low Risk needs to be managed by routine procedures.
-
M = Medium: Moderate Risk needs to specify management responsibilities.
-
H = High: High Risk needs senior management attention.
-
E = Extreme: Extreme Risk means that detailed action is required.
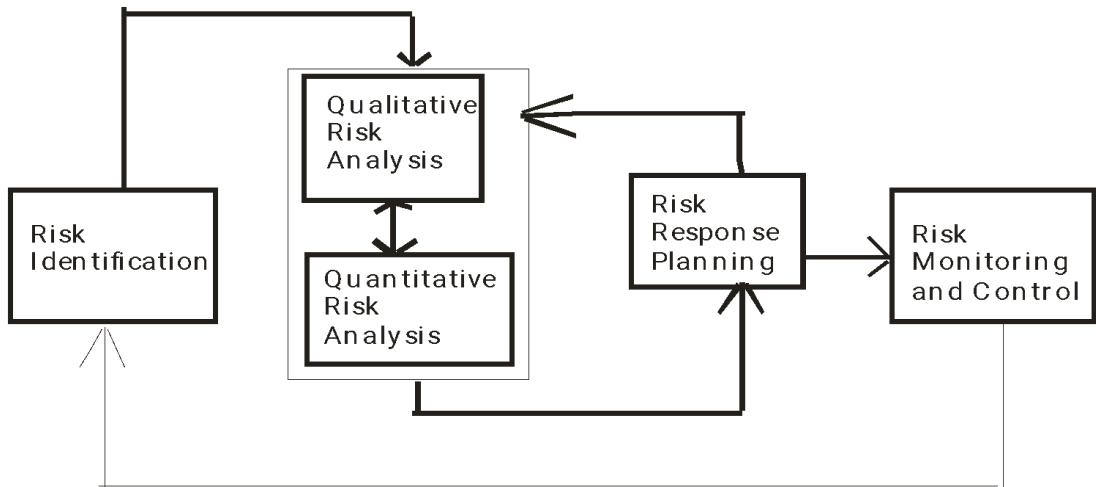
According to [37] two types of risk assessments: Quantitative Risk Assessment and Qualitative Risk Assessment. Figure 2 is the risk assessment cycle.
 Figure 2: Risk Assessment Cycle [28]
Quantitative risk assessment measures risks by relating the probability of risk occurring to the possible severity of the outcome and assigning a numerical value [27]. It evaluates identified risks in terms of probability and impact, analyzing the probability and severity of each risk on project objectives. Risk probabilities are categorized into very low (0 - 0.13 = very low, 0.14 - 0.32 = low, 0.43 - 0.6 = moderate, 0.7 - 1.4 = high, 1.5 - above = very high) and severity of impact (0 - 0.9 = very low, 1 - 5 = low, 6 - 7 = moderate, 8 - 10 = high, 11 - 15 = very high). Quantitative analysis measures the probability of risk occurring on a project and quantifies its impact on cost, schedule, quality, or objectives. This approach estimates the impact of a risk in a project.
Qualitative risk assessment is a common form of risk assessment, based on personal judgments and defined as high, medium, or low . It is usually satisfactory as it determines the time frame for further action. Generic risk assessment covers similar activities or work equipment in different departments, sites, or companies . Qualitative risk assessment assesses the impact and likelihood of identified risks, while quantitative risk assessment determines the importance of addressing specific risks and guiding risk response. Evaluation of the quality of available information can modify risk assessment. According to emphasizes that risk assessment should cover all aspects of an organization, including health and safety management, maintenance procedures, training programs, and supervisory arrangements. In various types of risks in project execution, including physical, construction, design, political, financial, legal, and environmental risks. Physical risks include landslides, rain flooding, snow, wind, and other unusual elements .
Construction risks involve delays in site possession, equipment breakdowns, labor shortages, new technology, and failure to construct to specifications . Design risks arise from improper structural analysis by structural engineers, including incomplete design scope, information availability, new technology, innovation, and interaction with construction methods. Political risks arise from uncertainties due to political unrest, changes in law, war, and revolution, as well as financial risks due to poor business decisions, cash flow problems, disputes, inflation, and inadequate payment variation . Legal/contractual risks arise from changes in government clauses that adversely affect the construction industry, leading to ongoing construction or the contractor being asked to stop work . Environmental risks arise from pollution of air, and water bodies, ecological damage, water treatment, preserving historical finds, and local environmental regulations.
III. METHODOLOGIES
This research focuses on the rehabilitation and construction of railway tracks in the Eastern part of Nigeria, using materials such as textbooks, documents, magazines, the internet, journals, and articles. The case study involves companies involved in highway and railway track construction. Data was analyzed using mean index formulas and quantitative data analysis. Participants had at least 2-10 years of experience on the projects. A mini-training on health and safety in construction was conducted to obtain accurate answers. The targeted group includes Site engineers, contractors, site supervisors, safety officers, storekeepers, and foremen. The distribution of questionnaires was effective due to the ease of obtaining standard data. Six types of risks and their sub-titles were selected from construction projects. Respondents were asked to rank their answers using a five-point scale. The study focuses on five eastern Nigerian states, Enugu, Anambra, Ebonyi, Imo, and Abia, and targets three companies from each state for equal representation. The companies are registered with the Federal Ministry of Works and Transport. A total of 160 questionnaires were distributed to staff working with the selected contractors. Due to various reasons, 14 companies did not participate, reducing the sample size to 116. The respondent's rate was 89.23%. The distribution and collection were carried out within two months. The study used Cronbach's Alpha Reliability Coefficient for Likert-type scales to compare the reliability of a summated, multi-item scale versus a single-item question, highlighting the unreliability of single-item questions and the need for more reliable methods [30]. The reliability tests were performed on scales of each risk and risks using Cronbach's .
The formula for Cronbach [30] is as shown below;
Where K= is the number of items considered and r = is the mean of the inter-item correlations (Scale Values). The test accepts negative and accepts positive from 0 to 1.1, with a coefficient of over 0.7 considered reliable. The alpha score is 1.1, indicating highly interrelated data and scale consistency with sample size. The size of alpha is determined by the number of items in the scale and mean inter-item correlations. The research focuses on the probability and impact of risk factors analysis using questionnaire information. The mean of scores is calculated using the information obtained from the questionnaires.
The formula for the mean index is as shown below;
Where:
- ai = Constant expressing the weight to each enquiry(1 to 5).
2. Xi = frequency of response.
- N = total number of inquiries made.
The results were then used to assign the scores of likelihoods and consequences to risk assessment. The probability and impact tables are shown in Tables 1 and 2 as shown below. The grading of the results to be assigned in the matrix analysis is as follows;
Table 1: Probability of Risks
| Descriptor | Explanation |
| Very Low | Not expected to happen. |
| Low | Small likelihood but could well happen. |
| Medium | Less than equal chances. |
| High | Greater than equal chances. |
| Very high | Almost certain that it will happen. |
Table 2: Impact of Risk Events
| Descriptor | Explanation |
| Very Low | Negligible effect |
| Low | Slight effect |
| Medium | Reasonable effect |
| High | Serious Danger |
| Very high | The impact is unacceptable. |
The results were then used to assign the scores of likelihoods and consequences into the risk matrix table. The grading/scaling of the results to be assigned in the matrix analysis is as follows;
Every person that was interviewed had worked on the research projects for one to ten years. The targeted audience is everyone engaged in a project at any point in its lifespan, including contractors, site engineers, site supervisors, safety officials, storekeepers, foremen (including those with and without expertise), etc. The demographic information of the respondents is shown in Table 3 below, table 4 is the years of work experience, and Table 5 is the type of project involvement.
Table 3: Demographic Data of Respondents
| Profession of Respondents | No | %Age | Cumm%Age |
| At least a degree certificate holder in related fields | 22 | 18.97 | 18.97 |
| Diploma or equivalent certificates | 38 | 32.76 | 51.73 |
| Tradesmen or Technical Vocational trainees and below | 56 | 48.28 | 100 |
Table 4: Years of Working Experiences
| Years of working experiences | No | %Age | Cumm% Age |
| 1 – 3 | 61 | 52.59 | 52.59 |
| 3 – 6 | 36 | 31.03 | 83.62 |
| Above 6 | 19 | 16.38 | 100 |
Table 5: Types of Project Involvement
| Types Of Project Involvement | Number Of Companies Visited | Number Of Questionnaires Filled | Cumm% |
| Highway Construction | 14 | 86 | 74.14% |
| Railway Construction | 1 | 30 | 25.86% |
| Both Construction | Nil | 0 | 0% |
| Total | 15 | 116 | 100% |
This shows that 51.73% of the respondents are generally educated and have ample experience in the construction industry while 48.28% of the respondents comprised both technical trainees. Based on their years of experience, it was noticed that a lower percentage occurred on people that have above 6 years of experience.
below. The results were tabulated and categorized according to their categories. The results were then assigned scores of likelihoods and consequences into a risk matrix assessment, with the grading of the results.
VI. ANALYSIS AND INTERPRETATION
The results of the analysis of level are shown in tables 6 to 11 and represented in figure 3 to 8
Table 6: Social Risks in Project Construction
| No | Risks | Probability | Impact | Risks Scale | Level of Risk |
| 1 | Certain Attitudes (stubborn, recklessness) | 3.5 | 3.6 | 12.6 | High |
| 2 | Lack of Awareness of Safety Regulations | 3.9 | 4 | 15.6 | Extreme |
| 3 | Poor Safety Awareness of Project Manager | 2.6 | 2.7 | 7.02 | Moderate |
| 4 | Inappropriate use of Ladders and Hoists | 2.5 | 2.7 | 6.75 | Moderate |
| 5 | Lack of Experienced Project Managers | 2.5 | 3 | 7.5 | Moderate |
| 6 | Dangerous Demolition of Work | 2.5 | 2.7 | 6.75 | Moderate |
| 7 | Inadequate Safety Performance | 3.6 | 3.9 | 14.04 | High |
| 8 | Struck by Falling Objects, Materials and Tools | 2.3 | 2.7 | 6.21 | Moderate |
| 9 | Unsafe Position or Posture | 2.6 | 2.9 | 7.54 | Moderate |
| 10 | Poor Inspection | 2.3 | 2.9 | 6.67 | Moderate |
| 11 | Supervisory Fault | 2.9 | 2.8 | 8.12 | Moderate |
| 12 | Failure to Secure Materials during Hauling or Lifting | 2.5 | 2.4 | 6 | Moderate |
| 13 | Reluctance to Input Tools for Safety | 3.8 | 4 | 15.2 | Extreme |
| 14 | Stepping or Striking against Objects | 3 | 3.1 | 9.3 | Moderate |
| 15 | Slippery and Muddy Work Surface | 2.8 | 3.1 | 8.68 | Moderate |
| 16 | Strenuous Movement | 2.7 | 2.6 | 7.02 | Moderate |
| 17 | Used Defective Tools or Equipment | 2.6 | 2.9 | 7.54 | Moderate |
| 18 | Lack of Warning System | 2.4 | 2.8 | 6.72 | Moderate |
| 19 | Operating Equipment without Authority | 2.4 | 2.8 | 6.72 | Moderate |
| 20 | Unsafe Facilities and equipment | 2.3 | 2.6 | 5.98 | Moderate |
| 21 | Mechanical Failure of Machinery | 3.1 | 3.3 | 10.23 | High |
| 22 | Lack of Certain abilities | 2.9 | 2.7 | 7.83 | Moderate |
| 23 | Limitation of Working Area | 2.6 | 2.3 | 5.98 | Moderate |
| 24 | Collapse of Temporary Structure | 2.5 | 3 | 7.5 | Moderate |
| 25 | Lack of Teamwork Spirits | 2.8 | 3.1 | 8.68 | Moderate |
| 26 | Low Tool Maintenance | 2.7 | 2.8 | 7.56 | Moderate |
| 27 | Improper Cleaning and Unusable Materials | 2.7 | 2.7 | 7.29 | Moderate |
| 28 | Working close to furnace | 2.1 | 2 | 4.2 | Moderate |
{"image_source":{"path":"images/1da22b3c00ad9d06ecfba7440c2e31458429f5c73ee92137bf96d9b9fad54f0e.jpg"},"content":"","chart_caption":[{"type":"text","content":"Figure 3: Column Representation of Probability and Impact of Social Risk"}],"chart_footnote":[]}
Table 7: Physical Risks in Project Construction
| No | Risks | Probability | Impact | Risks Scale | Level of risk |
| 1 | Land slide | 1 | 1.5 | 1.5 | Low |
| 2 | Rain flooding | 2.4 | 2.5 | 6 | Moderate |
| 3 | Wind | 1.2 | 1.4 | 1.68 | Low |
| 4 | Cold | 1.3 | 1.1 | 1.43 | Low |
| 5 | Earthquakes | 1.2 | 1 | 1.2 | Low |
| 6 | Windstorm | 1.2 | 1 | 1.2 | Low |
| 7 | Hurricane | 1.1 | 1 | 1.1 | Low |
| 8 | Rainstorm | 1.4 | 2.2 | 3.08 | Low |
{"image_source":{"path":"images/98aa085830a6df62271ac00496ad228f57d8b021992a980663e011155e3ad380.jpg"},"content":"","chart_caption":[{"type":"text","content":"Figure 4: Column Representation of Probability and Impact of Physical Risk"}],"chart_footnote":[]}
Table 8: Design Risks in Project Construction
| No | Risks | Probability | Impact | Risks Scale | Level of risk |
| 1 | Improper analysis by engineer. | 2.6 | 3.1 | 8.06 | Moderate |
| 2 | Incomplete design scope | 1.9 | 2.9 | 5.51 | Moderate |
| 3 | Interaction of design with method of construction. | 3.1 | 3 | 9.3 | Moderate |
| 4 | Level of detail required and accuracy. | 3.2 | 3.2 | 10.24 | High |
| 5 | Less availability of information | 2.7 | 2.7 | 7.29 | Moderate |
| 6 | Innovative application. | 2.7 | 2.7 | 7.29 | Moderate |
{"image_source":{"path":"images/5e160dd1921d8214a70b6f4f338a4691af0450e78e8860cb08b20aff0c979905.jpg"},"content":"","chart_caption":[{"type":"text","content":"Figure 5: Column Representation of Probability and Impact of Design Risk"}],"chart_footnote":[]}
Table 9: Political Risks in Project Construction
| No | Risks | Probability | Impact | Risks Scale | Level of risk |
| 1 | Change of political tenure/Government | 3.6 | 3.8 | 13.68 | High |
| 2 | Boundary grievances | 3.5 | 3.5 | 12.25 | High |
| 3 | Change in law | 2.9 | 3 | 8.7 | Moderate |
| 4 | War | 2.3 | 3 | 6.9 | Moderate |
| 5 | Revolution | 2.1 | 2.4 | 5..04 | Moderate |
| 6 | Inadequate compensation | 3.2 | 3 | 9.6 | Moderate |
{"image_source":{"path":"images/132d88af570a61db8a77b846c19c06e56bb3ea3ac24b809d11bfaaf7d4df7c95.jpg"},"content":"","chart_caption":[{"type":"text","content":"Column Representation of Political Risk"},{"type":"text","content":"Figure 6: Column Representation of Probability and Impact of Political Risk"}],"chart_footnote":[]}
Table 10: Financial Risks In Project Construction.
| No | Risks | Probability | Impact | Risks Scale | Level of risk |
| 1 | Dispute | 2.7 | 2.9 | 7.83 | Moderate |
| 2 | Inflation | 3.5 | 2.7 | 9.45 | Moderate |
| 3 | Inadequate payment variation | 3 | 3.2 | 9.6 | Moderate |
| 4 | Cash flow variation | 2.9 | 2.7 | 7.83 | Moderate |
{"image_source":{"path":"images/607f04733d3465ece1dfbb056d24669d664d453c9066fa74f9a0a43e614a37f8.jpg"},"content":"","chart_caption":[{"type":"text","content":"Figure 7: Column Representation of Probability and Impact of Financial Risk"}],"chart_footnote":[]}
Table 11: Construction Risks in Project Construction
| No | Risks | Probability | Impact | Risks Scale | Level of risk |
| 1 | Equipment breakdown | 3.5 | 3.5 | 12.25 | High |
| 2 | Failure to construct to program | 3.2 | 3.1 | 9.92 | Moderate |
| 3 | Poor workmanship | 2.9 | 2.8 | 8.12 | Moderate |
| 4 | Incorrect specification | 3 | 2.8 | 8.4 | Moderate |
| 5 | Delay in information | 3 | 3 | 9 | Moderate |
| 6 | Damage during construction due to negligence of any party | 3.9 | 3.5 | 13.65 | High |
| 7 | Vandalism and accident | 3 | 2.9 | 8.7 | Moderate |
{"image_source":{"path":"images/a7dcb075bac3d64287788a3c4c36f2b92a68589181eeb8fefad0a0a77009ffc0.jpg"},"content":"","chart_caption":[{"type":"text","content":"Figure 8: Column Representation of Probability and Impact of Construction Risk"}],"chart_footnote":[]}
V. DISCUSSIONS OF FINDINGS, CONCLUSION AND RECOMMENDATION
The study aims to analyze the level of risks and their impact on those in danger, with a focus on social risk, which is the most extreme level of risk.
It is observed that all workers on a construction site are at risk, supporting the literature that social, political, and construction risks are the critical causes of accidents. The study also identifies all parties involved in construction projects, including customers and contractors, as at risk. This supports the findings of , who stated that employees and contractors working full-time at the site are the most obvious groups at risk, and it is necessary to ensure their competence to perform their tasks. It was discovered that there is no discernible difference between employers and construction workers in terms of the rate of frequency or severity of the hazards that were identified. Furthermore, the outcome demonstrates a lack of willingness to use safety instruments, poor safety performance, mechanical failure, specific attitudes (carelessness), shifting political power, boundary disputes, equipment malfunctions, and damage during construction. The findings of this study can help safety officers, safety managers, construction managers, and all other project participants pool their resources and work toward reducing construction-related accidents by addressing the underlying causes of accident. In light of the study's findings, the researcher would like to provide some comments and ideas here, particularly for the clients and contractors. Nonetheless, other contractors and transportation organizations may utilize the study's findings to enhance the security of their highway labor force.
The customer who orders the work is a key player in the movement to raise the bar for health and safety regulations. In addition to making sure that health and safety regulations are being followed on the job site, he should demand on proof of good health and safety records and the contractor's performance throughout the tendering process. The study suggests that contractors should adequately consider the risks associated with their project and prioritize managing them based on the level of risk. Specifically, high-ranking risks should receive special attention to avoid catastrophic consequences for the project, but other risk categories should also be managed to guarantee timely, budget-conscious, high-quality delivery that will satisfy clients, particularly end users.
Conflict of Interest
The authors declare no conflict of interest.
Ethical Approval
Not applicable
Data Availability
The datasets used in this study are openly available at [repository link] and the source code is available on GitHub at [GitHub link].
Funding
This work did not receive any external funding.
References
Cite this article
Related Research




Special Issue
Launch a focused special issue to highlight research, emerging trends, and expert insights in your academic field.
