



IntelliPaper
Abstract
Poly ionic liquidwas introduced as aqueous two-phase extraction (ATPE) sorbent accompanied with UV spectrophotometry for Allura red (AR) separation in food samples. Different parameters, like pH value, adsorption temperature and time , were studied. the preconcentration factor for AR was 27. The linear range, detection limit (DL), correlation coefficient (R) and relative standard deviation (RSD) were found to be 0.10-9.00 μg/mL, 5.2 μg/L, 0.9987 and 3.10% (n=3, c=4.00 μg/mL).This method was successfully applied for separation / analysis of allura red pigment in food samples with satisfactory results.
Explore Digital Article Text
I. INTRODUCTION
Synthetic colorants are common food additives used in food industry, due to their stable nature, bright colors and low price. Allura red (Fig.1) is one of the eleven synthetic colorants which are allowed to be used within a certain limit in food, such as ice cream, candies, pastries, beverages, jelly and hams . The maximum usage of AR in candies and beverages are 0.3 g/kg and 0.1g/kg, respectively; which are strictly regulated by the hygienic standards for food additives of China.
Excessive use of safety AR as food additives has been questioned, because AR is potentially toxic and carcinogenic, especially harmful to the intellectual development of children[2].
The AR detection methods included high performance liquid chromatography as a separation method [3], UV-vis spectrophotometry[4], differential pulse polarography[5], voltammetry and Fluorescence spectrophotometry. Fluorescence spectrophotometry as detection method has many advantages of lower-cost analysis, easier operation and better accuracy. Therefore, this method was applied for separation of AR in food samples.
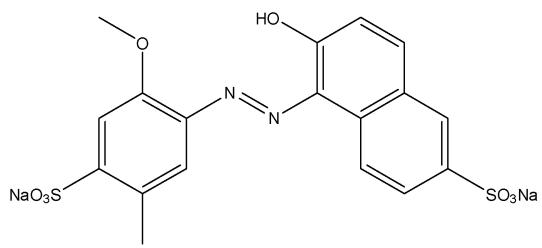 Fig. 1: Chemical Structure of Allura Red
Ionic liquid, also known as low-temperature molten salt, is composed of all ions at room temperature material. Ionic liquids have the advantages of low vapor pressure, good thermal stability, nonflammable and miscible with a variety of solvents. By changing the ionic liquid anion-cation combination or the introduction of functional groups, we can get a large number of functional ionic liquids that can meet the analytical needs and have adjustable performance. Common ionic liquid functionalization methods include 1) improved ionic liquid lipophilicity and surface activity by introduction of long alkyl chains; 2) improved ionic liquid polarity enhancement by incorporation of polar substituents; 3) Hydrogen bond acceptors make ionic liquids and hydrogen bonds stronger; 4) using biomolecules as ionic liquid raw materials to reduce the toxicity of ionic liquid environment. Ohno's research team successfully prepared a series of amino acid functionalized hydrophilic ionic liquids through ion exchange-neutralization reaction.
Polymerized ionic liquids, poly(ionic liquid)s or polymeric ionic liquids, all abbreviated as PIL is the polymeric form of ionic liquids[6]. They have half of the ionicity of ionic liquids since one ion is fixed as the polymer moiety to form a polymeric chain. PILs have a similar range of applications, comparable with those of ionic liquids but the polymer architecture provides a better chance for controlling the ionic conductivity. They have extended the applications of ionic liquids for designing smart materials or solid electrolytes.
Poly ionic liquid was used in food analysis/ separation and enrichment technology used to eliminate the matrix interference and to improve the sensitivity. Common extraction techniques include solid phase extraction and liquid phase extraction. Solid phase extraction was used to load the adsorbent of special materials, and for adsorption and elution of the two processes, the analysis taking a long time, compared with liquid phase extraction, solid phase extraction technology is easier and faster. Liquid phase extraction mainly includes liquid-liquid extraction, single-drop extraction, hollow fiber extraction, dispersion liquid microextraction and aqueous two-phase extraction (ATPE). ATPE is a two-phase system using a two-phase system in a certain concentration, pH, temperature conditions formed by the two-phase extraction and separation technology, compared with the traditional organic solvent extraction, the two-phase system has the advantages of good performance in the biological Compatibility, small interfacial tension, mild operating conditions, adjustable extraction performance and no volatile organic solvent residues, known as green separation technology. The formation of a dual aqueous system [7] includes alcohol-salts, polymers, polymers-polymers, surfactants-salts and the like. Rogers research group [8] for the first time using hydrophilic ionic liquids and to form a double aqueous phase. The strong polarity of ionic liquids and ionic liquids larger specific surface area, so that the ionic liquid-based aqueous two-phase extraction is widely used in analytical chemistry [9].
II. EXPERIMENTAL SECTION
2.1 Reagents
All chemicals and reagents were at least of analytical reagent grade, unless otherwise stated. Allura red standards were obtained from the Sigma-Aldrich (Shanghai, China). A standard stock solution was prepared by dissolving 10.0 mg of each standard in 100 mL of ethanol and stored in dark at 4°C. N-methylimidazole (Darui Fine Chemicals, Shanghai, China), 4-chloromethystyrene and 2, 2-Azobis-2 methylpropionitrile (AIBN) were bought from Chemical Reagent Co., Ltd (China). K PO , N, N-dimethylformamide (DMF), methanol, ethylether, ethyl acetate (Sinopharm Chemical Reagent Co., Ltd., Shanghai, China)
2.2 Equipment
FTIR spectra were measured with a Bruker Tensor 27 spectrometer (Bruker Company, Germany). Samples were pressed into KBr pellets and recorded at the frequencies from 500 to 4500 cm with resolution of 4 cm . Centrifuge (Anke Scientific Instrument Factory Shanghai, China), timing multifunctional oscillator (Guohua Co., Ltd., China), digital constant temperature water-bath (Guohua Co., Ltd., China). UV-2550 spectrophotometer (Shimadzu Corporation, Japan) was used.
2.3 Preparation of Aqueous Two-Phase Extraction (ATPE) Poly Ionic Liquid (PILs)
2.3.1 Preparation of IL Monomer
1-methylimidazolium IL monomer was prepared through the reaction of 6.56 g of 1-vinylimidazole and 12.21g of 4-chloromethystyrene in 30 mL of methanol at 60°C for 24 h under vigorous stirring, the product was dried in the vacuum at 50°C to remove methanol then the product was washed by ethylether (4-5) times and with distilled water 3 times the product was yellow viscous ionic liquid.
2.3.2 Preparation of Aqueous Two-Phase Extraction (ATPE) Poly Ionic Liquid
0.095g of 2, 2-Azobis-2methylpropionitrile (AIBN) and 15 ml of N, N-dimethylformamide (DMF) were added to the product at 60°C for 24 h. Before the reaction was inflated to the solution for (20min). The product was poured slowly into a little amount of ethyl acetate then the product was dried in the vacuum for 24 h at 45°C.
2.3.3 Phase Diagram Determination
Amino acid ionic liquids and dual aqueous phase using the cloud point method [8] determination, the specific measurement steps are: (1) accurately weighed 0.5000g pure ionic liquid placed in a test tube, the test tube into a water bath, low temperature (2) adding a little water to dissolve the ionic liquid in the test tube and stirring to make the solution clear and transparent; (3) adding saturated aqueous solution into the solution until the system just appears When turbidity, record the volume of the inorganic salt solution added; (4) continue to add water dropwise to clarify the cloudy system, and then add saturated aqueous solution to just appear cloudy, record the volume of inorganic salt solution used: Repeatedly and repeatedly calculated the turbidity system ionic liquid and salt mass percentage(Fig.2.), you can get a more complete double junction line.
{"image_source":{"path":"images/c6245b9c0683e69ee4cc5e1eb860b1058bff58ba9734880cc3a1edb42c0b31ab.jpg"},"content":"","chart_caption":[{"type":"text","content":"Fig.2: Phase Diagrams of PIL -K "},{"type":"equation_inline","content":"_3"},{"type":"text","content":"PO "},{"type":"equation_inline","content":"_4"},{"type":"text","content":" in ATPE. (n= 2(line1), 4(line 2), 6(line 3) and 8(line 4)"}],"chart_footnote":[]}
2.3.4 Response Surface Optimization Design
PIL and aqueous two-phase system extraction rate of metal ions include: the ionic liquid anion and cation species, inorganic salt type, the type and amount of auxiliary complexing agent, pH and temperature, the experimental A three-factor three-level response surface model was established by Box-Behnken method according to the amount of EDTA, pH and temperature. The average of three measurements was fitted by the following second-order linear equation [10]
2.4 Procedure for Extraction
A 40.0 mL of the working solution or aqueous sample and 0.05 g of PIL, 0.05 g of (pH=7.0) and 0.05 mL of allura red standard or sample solution were added and transferred into a centrifuge tube and subsequently shaken for 15 min at room temperature. Then, the AR was analyzed using UV-2550-vis spectrophotometer at 246 nm.
2.5 Sample Preparation
1.000 g of Candy was weighed in a small beaker after grinding into powder. The powder was dissolved in 30 mL distilled water at 60 °C ultrasonically extracted for 30 min and then filtered and was poured into 250.0 mL flask then dissolved with distilled water.
5.000 g beverage(fruit juice) was transferred into a 100.0 mL volumetric flask and dissolved in deionized water. The sample solution was put in the darkness at C.
III. RESULTS AND DISCUSSION
3.1 Characterization of PIL by FTIR
The FTIR spectra of PIL (Fig. 3) was significantly reduced due to the characteristic absorption of imidazole groups, the transmittance at wave numbers 591 and 733 cm was due to P-F stretching vibration in the PILs, which showed that PILs were well immobilized on the surface of ATPE systems.
{"image_source":{"path":"images/bf2bf178d5745dd4973238f107ec3280e63425d01b0a0b845ba0a04ce8a42c32.jpg"},"content":"","chart_caption":[{"type":"text","content":"Fig. 3: FT-IR spectra of PIL"}],"chart_footnote":[]}
3.2 ATPE System Phase Diagram
Double junction of ATPE can provide the minimum concentration of ionic liquid and inorganic salt and the volume ratio of upper and lower phases required to form a dual aqueous phase. The double junction line near the coordinate axis has good phase-forming ability and can produce better Separation effect and enrichment multiple [11]. According to the reported literature, has a large free energy of hydration and possesses a good capability of phase formation [12]
3.3 Effect of PH value
PH is one of the important parameters for extraction of AR onto PIL. There were aromatic and azo in the structure of AR, so, its adsorption on PIL occurs mainly by hydrophobic dispersion interaction and weak dipolar force mechanisms. The pH range of the procedure was investigated and optimized between pH 8.0 and 12.0. As shown in (Fig. 4), the extraction efficiency of AR was varied with the pH value. It could be concluded that the extraction efficiency of AR on PIL was increasing to 0.7 when the pH values were 8.0-9.0, then it was approximately constant pH value at 8.0, it is highly possible that AR have been completely ionized(AR-) at these pH values and this because of negative charge of the pigment and repulsive force[13], the extraction efficiency decreased to above between the pH value11.0 and 12.0 and this due to the decrease of hydrogen bonding interaction [14].
{"image_source":{"path":"images/98d036b591087481b552b283f1bd050b07156961a4e800bb6910c54fac3a50a7.jpg"},"content":"","chart_caption":[{"type":"text","content":"Fig. 4: Effect of pH on Extraction Efficiency"}],"chart_footnote":[]}
3.4 Effect of salt Amount
Fixed Allura red amount of 0.5 mL, PIL from 0.5g salt was added 0.5-3.0g Results showed that the extraction rate of PIL on allura red was the highest at 0.5g of salt(88%), then it decreased to(80%), then remained unchanged (Fig.5). So 0.5g of salt was used.
{"image_source":{"path":"images/cf23486ac16c417e443ee93c096765f2d60fe50c17224e5e92680a9d45767dda.jpg"},"content":"","chart_caption":[{"type":"text","content":"Fig. 5: Effect of Salt Amount on Extraction Efficiency"}],"chart_footnote":[]}
3.5 Adsorption Temperature
The extraction efficiency of AR on MNPs at various temperatures (5-60°C) were investigated (Fig.6). The extraction efficiency of AR was increasing from C to C and then it decreased and increasing from C to C. The experiment was done at C.
{"image_source":{"path":"images/f0210c50e277659433d4069b8bbe471c2b5953086ed7eb4749b9e1c8b082162a.jpg"},"content":"","chart_caption":[{"type":"text","content":"Fig. 6: Effect of Temperature on Extraction Efficiency"}],"chart_footnote":[]}
3.6 Capacity of Adsorption
The capacity of adsorption is known as the highest volume of allura red adsorbed per gram of PIL MNPs. The adsorption capacity of AR on PIL MNPs was studied (Figure. 7).
When the concentration of AR was , the adsorption of Allura red reached the maximum. The adsorption capacity for PIL is calculated as .
{"image_source":{"path":"images/7556b17f013f9564cbd56135f25d90a9cb2acaeee9ecd010e5779f114809c84b.jpg"},"content":"","chart_caption":[{"type":"text","content":"Figure 7: Adsorption capacity"}],"chart_footnote":[]}
3.7 Interference Effects
The effect of interferents which food samples may contain on separation of Allura red in the availability of interferents was investigated. the tolerance limit for different interferents was as follow, for interferents , , , the tolerance ratio was 102. for interferent , tebuconazole ratio was 53, for 2-nitrophenol ratio was 35 and it was 15 for , , , Carbendazim, 4-Nitrophenol, phenol. The results showed that most of the foreign substances had no interference with Allura red.
3.8 Analytical Performance
Under optimum conditions described above, the preconcentration factor for AR was 27. The linear range, detection limit (DL), correlation coefficient (R) and relative standard deviation (RSD) were found to be 0.10-9.00 g/mL, 5.2 g/L, 0.9987 and 3.10% (n=3, c=4.00 g/mL).
3.9 Analysis of Sample
This method was introduced to determine the amount of AR in certain brands of some candies and beverages. To further verify for the viability of the method, recovery experiments were carried out, and the AR could be detected in these certain brands of candy and beverage. The obtained values of AR in candies and beverages were measured up to the national standard. To further verify the viability of the method, recovery experiments were carried out (Table 1). The values obtained for unspiked and spiked samples were satisfactory[15].
Table 1: The Recoveries of Allura Red in Candy Samples and Beverages (N=3)
| Samples | Added (μg mL-1) | Found (μg mL-1) | Recovery (%) |
| Candy | 0.00 | ND | — |
| 0.50 | 0.49 | 98.0 | |
| 2.00 | 2.01 | 100.5 | |
| 4.00 | 4.13 | 103.2 | |
| Beverages | 0.00 | 0.74 | — |
| 0.50 | 1.25 | 102.0 | |
| 2.00 | 2.88 | 107.0 |
3.10 Comparison with other Methods
The separation/analysis of AR in real samples was compared with some reported methods, such as solid phase extraction coupled with high performance liquid chromatography, Cloud-point extraction spectrometry, Multi-wall carbon nanotube filmbased electrochemical sensor, solid phase extraction coupled with UV-spectrophotometry and solid phase microextraction coupled with high performance liquid chromatography method were listed in Table 2. Compared with other reported methods, the method adopted in the present work is obviously had good linear range and lower limit of detection and standard deviation using new detector. Moreover, the extraction procedure was simpler and cheaper than that of SPE.
Table 2: Comparison With the Results in Other Literature
| Method | Detector | LR ug/ml | LOD μg/L | RSD (%) | Ref |
| SPME-HPLC | HPLC | 0.05-10.0 | 9.3 | 7.8 | [15] |
| Cloud-point extraction spectrometry | UV | 0.02-1.40 | 7.8 | 3.9 | [16] |
| MWCNT film-based electrochemical sensor | Electrochemical Workstation | 0.50-6.00 | 25.0 | NR | [17] |
| SPE-UV | UV | 1.0-6.0 | 2.4 | 7.0 | [18] |
| SPE-HPLC | HPLC | 0.50-20.0 | 32.2 | 6.0 | [19] |
| UV -Spectrophotometry | UV | 0.10-9.00 | 5.2 | 3.10 | This method |
3.11 Discussion of Mechanism
The adsorption mechanism could be discussed through extraction isotherms model.
So as to describe extraction capacities for AR by using nanoparticles, the widely used extraction isotherms, Langmuir and Freundlich ones, were introduced. The Langmuir adsorption equations are named as Eq (1).
(1) Langmuir:
Freundlich model equation is named as Eq. (2):
(2) Freundlich:
where was the maximum extraction at monolayer coverage (mg g ), is the AR concentration on the at equilibrium(mgg ), was the concentration of AR in sample at equilibrium(mgL ), b is the Langmuir extraction equilibrium constant (Lmg ), and 1/n are the Freundlich characteristic constants, proving the capacity of adsorption and the extraction intensity, respectively. The values of b and were calculated by the linear plot of Ce/q versus Ce and the values of and 1/n can be obtained from the intercept and slope of the linear plot of versus , respectively. The results showed that the linear correlation coefficient for the Langmuir model 0.995 was more than that for the Freundlich one 0.989 (Fig.8). This proved that the Langmuir model fitted the extraction data was better than the Freundlich one. The for extraction of AR by the magnetic nanoparticles obtained by the Langmuir isotherm model was 105.80 mgg .
{"image_source":{"path":"images/b0754340476ed6b3fcd2d9f033583f1c518ae6399352aa97c21d6dc03ea7d86b.jpg"},"content":"","chart_caption":[],"chart_footnote":[]} {"image_source":{"path":"images/6e7afcd122a8c6c8acbcefea51f28fac120bca63422df859da6bac295811c4c4.jpg"},"content":"","chart_caption":[{"type":"text","content":"Fig. 8: Adsorption of AR by Langmuir (A) and Freundlich(B) Isotherms Models"}],"chart_footnote":[]}
IV. CONCLUSION
In this work, PIL was synthesized as aqueous two phase extraction sorbent coupled with UV spectrophotometry to separate/determine AR in food samples. The magnetic separation greatly improved the separation rate and reduced the analysis time. In conclusion, PIL aqueous two phase extraction could be considered as a promising alternatives for the extraction of AR. This introduced method for the separation of allura red from real samples was proved to be satisfactory.
ACKNOWLEDGEMENTS
Authors acknowledge financial supply of National Natural Science Foundation of China (21155001, 21375117) and the Priority Academic Program Development of Jiangsu Higher Education Institutions.
Conflict of Interest
The authors declare no conflict of interest.
Ethical Approval
Not applicable
Data Availability
The datasets used in this study are openly available at [repository link] and the source code is available on GitHub at [GitHub link].
Funding
This work did not receive any external funding.
References
Cite this article
Related Research




Special Issue
Launch a focused special issue to highlight research, emerging trends, and expert insights in your academic field.
